- Essentials
- Getting Started
- Datadog
- Datadog Site
- DevSecOps
- Serverless for AWS Lambda
- Agent
- Integrations
- Containers
- Dashboards
- Monitors
- Logs
- APM Tracing
- Profiler
- Tags
- API
- Service Catalog
- Session Replay
- Continuous Testing
- Synthetic Monitoring
- Incident Management
- Database Monitoring
- Cloud Security Management
- Cloud SIEM
- Application Security Management
- Workflow Automation
- CI Visibility
- Test Visibility
- Test Impact Analysis
- Code Analysis
- Learning Center
- Support
- Glossary
- Standard Attributes
- Guides
- Agent
- Integrations
- OpenTelemetry
- Developers
- Authorization
- DogStatsD
- Custom Checks
- Integrations
- Create an Agent-based Integration
- Create an API Integration
- Create a Log Pipeline
- Integration Assets Reference
- Build a Marketplace Offering
- Create a Tile
- Create an Integration Dashboard
- Create a Recommended Monitor
- Create a Cloud SIEM Detection Rule
- OAuth for Integrations
- Install Agent Integration Developer Tool
- Service Checks
- IDE Plugins
- Community
- Guides
- Administrator's Guide
- API
- Datadog Mobile App
- CoScreen
- Cloudcraft
- In The App
- Dashboards
- Notebooks
- DDSQL Editor
- Sheets
- Monitors and Alerting
- Infrastructure
- Metrics
- Watchdog
- Bits AI
- Service Catalog
- API Catalog
- Error Tracking
- Service Management
- Infrastructure
- Application Performance
- APM
- Continuous Profiler
- Database Monitoring
- Data Streams Monitoring
- Data Jobs Monitoring
- Digital Experience
- Real User Monitoring
- Product Analytics
- Synthetic Testing and Monitoring
- Continuous Testing
- Software Delivery
- CI Visibility
- CD Visibility
- Test Optimization
- Code Analysis
- Quality Gates
- DORA Metrics
- Security
- Security Overview
- Cloud SIEM
- Cloud Security Management
- Application Security Management
- AI Observability
- Log Management
- Observability Pipelines
- Log Management
- Administration
Service Check
Overview
Service checks allow you to characterize the status of a service to monitor it within Datadog. Service checks monitor the up or down status of the specific service. You are alerted whenever the monitoring Agent fails to connect to that service in a specified number of consecutive checks. For example, you can get an alert any time the monitoring Agent on a Redis host reports three consecutive failed attempts to connect to Redis and collect metrics.
Service checks at the cluster level offer another effective way to monitor distributed or redundant systems that can withstand some failures. Use these alerts for architectures where individual hosts run multiple services, because they can surface the degradation of the service even if the hosts running that service remain available (and would pass a host-level health check).
You can set up monitoring and an alert for when a critical, non-redundant service is lost, or if a cluster is on the verge of failure due to widespread node loss. Other critical alerts could be a drop in request throughput or an increase in request latency.
You might need to set up a service check if an integration does not have one natively or for an internal service that you want to monitor for up or down status.
To use service checks, first set up the check:
Additional helpful documentation, links, and articles:
Once the service check is sending data, check out your check summary and set up dashboards, monitors, and alerts:
Visualize your service check in Datadog
Service checks can be visualized and used in 3 Datadog sections:
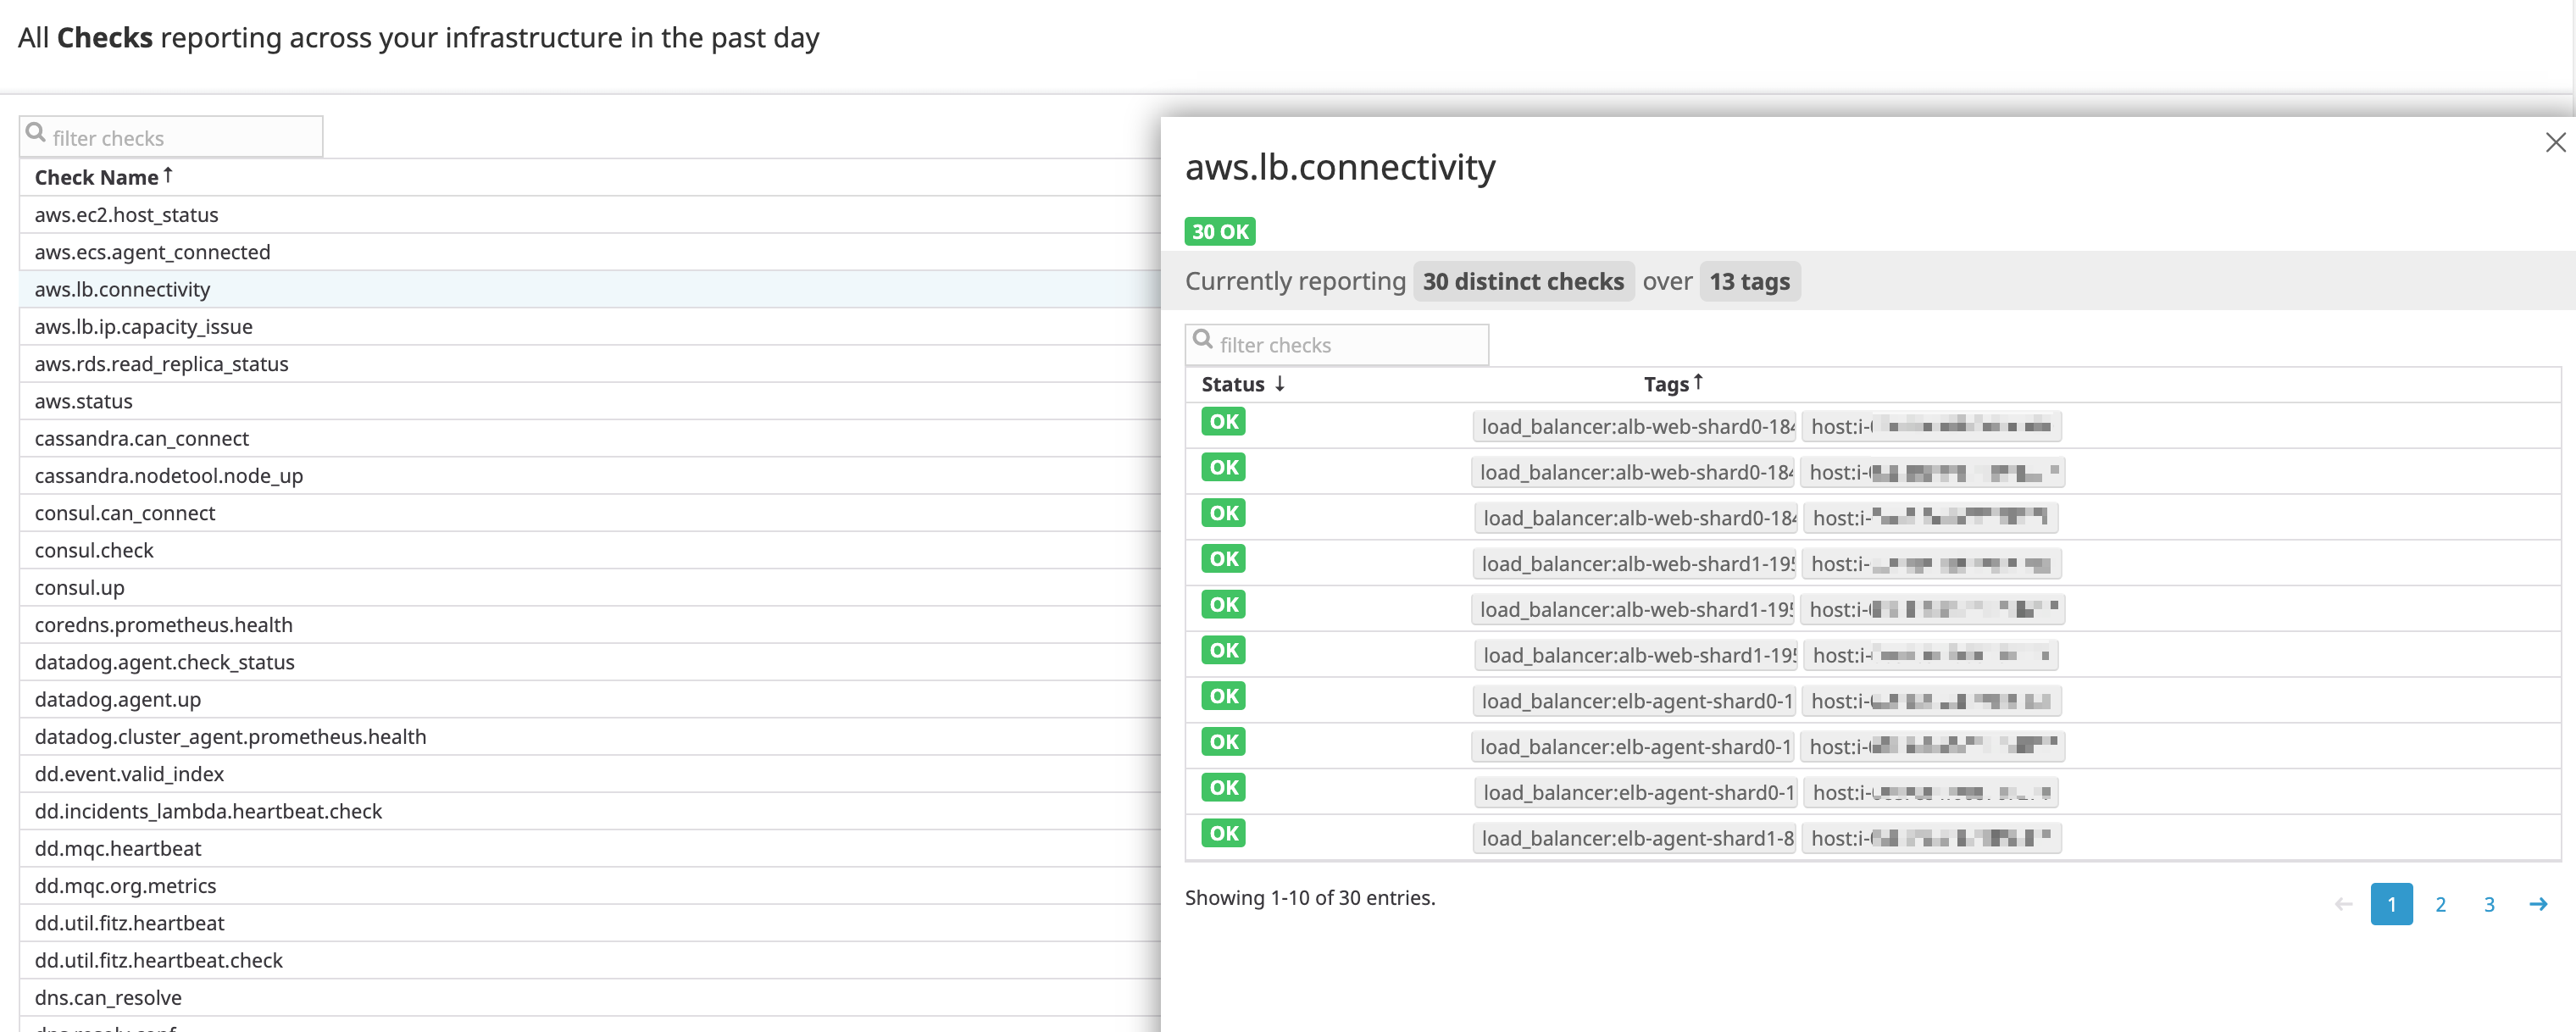
Check summary
The Check Summary page lists all checks reported across your infrastructure in the past day. Select a check to get insights on the status and tags associated with the check.
Screenboards
You can visualize service checks with a Check status widget in a screenboard:
After clicking on the Check status widget icon, the following pop-up appears:
In this form, you can:
- Check Name: Select your service check name.
- Reporting Timeframe: Select the time frame on which you want to aggregate your status.
- Scoping: Select a single check or a cluster of check statuses reported by a single tag value or a tag key.
- Widget Title: Set your widget title.
Service check monitor
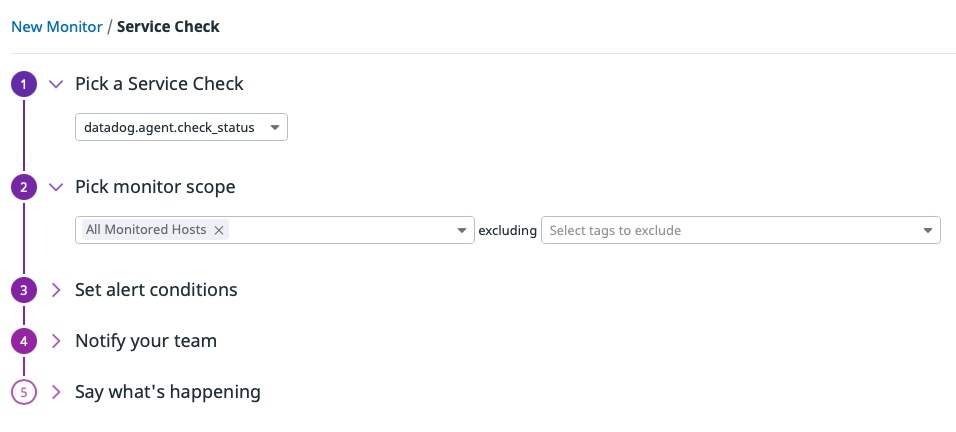
Even if you can’t graph a service check over time as you would for metrics, you can still monitor it with a Service Check Monitor.
In this form, you can:
- Pick a service check: Select the check status name to monitor.
- Pick monitor scope: Select the context for your monitor (including/excluding tags).
- Set alert conditions: Choose between a simple check alert or a cluster alert.
- Configure notifications and automations: Choose who this monitor should notify and edit the notifications sent (find more about Datadog notifications).
- Define permissions and audit notifications: Edit access permissions for your monitor and set audit notifications.
For more information on creating a service check, see Service Check Monitor.


