- Essentials
- Getting Started
- Datadog
- Datadog Site
- DevSecOps
- Serverless for AWS Lambda
- Agent
- Integrations
- Containers
- Dashboards
- Monitors
- Logs
- APM Tracing
- Profiler
- Tags
- API
- Service Catalog
- Session Replay
- Continuous Testing
- Synthetic Monitoring
- Incident Management
- Database Monitoring
- Cloud Security Management
- Cloud SIEM
- Application Security Management
- Workflow Automation
- CI Visibility
- Test Visibility
- Test Impact Analysis
- Code Analysis
- Learning Center
- Support
- Glossary
- Standard Attributes
- Guides
- Agent
- Integrations
- OpenTelemetry
- Developers
- Authorization
- DogStatsD
- Custom Checks
- Integrations
- Create an Agent-based Integration
- Create an API Integration
- Create a Log Pipeline
- Integration Assets Reference
- Build a Marketplace Offering
- Create a Tile
- Create an Integration Dashboard
- Create a Recommended Monitor
- Create a Cloud SIEM Detection Rule
- OAuth for Integrations
- Install Agent Integration Developer Tool
- Service Checks
- IDE Plugins
- Community
- Guides
- Administrator's Guide
- API
- Datadog Mobile App
- CoScreen
- Cloudcraft
- In The App
- Dashboards
- Notebooks
- DDSQL Editor
- Sheets
- Monitors and Alerting
- Infrastructure
- Metrics
- Watchdog
- Bits AI
- Service Catalog
- API Catalog
- Error Tracking
- Service Management
- Infrastructure
- Application Performance
- APM
- Continuous Profiler
- Database Monitoring
- Data Streams Monitoring
- Data Jobs Monitoring
- Digital Experience
- Real User Monitoring
- Product Analytics
- Synthetic Testing and Monitoring
- Continuous Testing
- Software Delivery
- CI Visibility
- CD Visibility
- Test Optimization
- Code Analysis
- Quality Gates
- DORA Metrics
- Security
- Security Overview
- Cloud SIEM
- Cloud Security Management
- Application Security Management
- AI Observability
- Log Management
- Observability Pipelines
- Log Management
- Administration
Search and Manage CI Tests
CI Visibility is not available in the selected site () at this time.
Overview
The Tests page is useful for developers who want to keep an eye on their test results.
You can access low-level and immediate insights:
- See what tests are failing and why.
- See your last commit’s test results.
- View the total duration of your tests in your feature branch.
- Find out if your commit introduces a new flaky test that wasn’t flaky before, indicating that your code change is what’s making it flaky. This gives you the opportunity to fix the problem before proceeding rather than contributing to the number of flaky tests in your CI.
You can also access high-level accumulation and trends:
- See the effects that changed code, added tests, and increased complexity have on your test suite performance over time.
- See which tests have become slower over time and identify the commit that introduced the regression.
- Take advantage of Datadog’s automatic test flakiness detection and tracking, which shows you which tests are becoming more or less unreliable over time.
Search for tests
To see your tests, navigate to CI > Tests and select between the Branches or Default Branches view.
Branches view
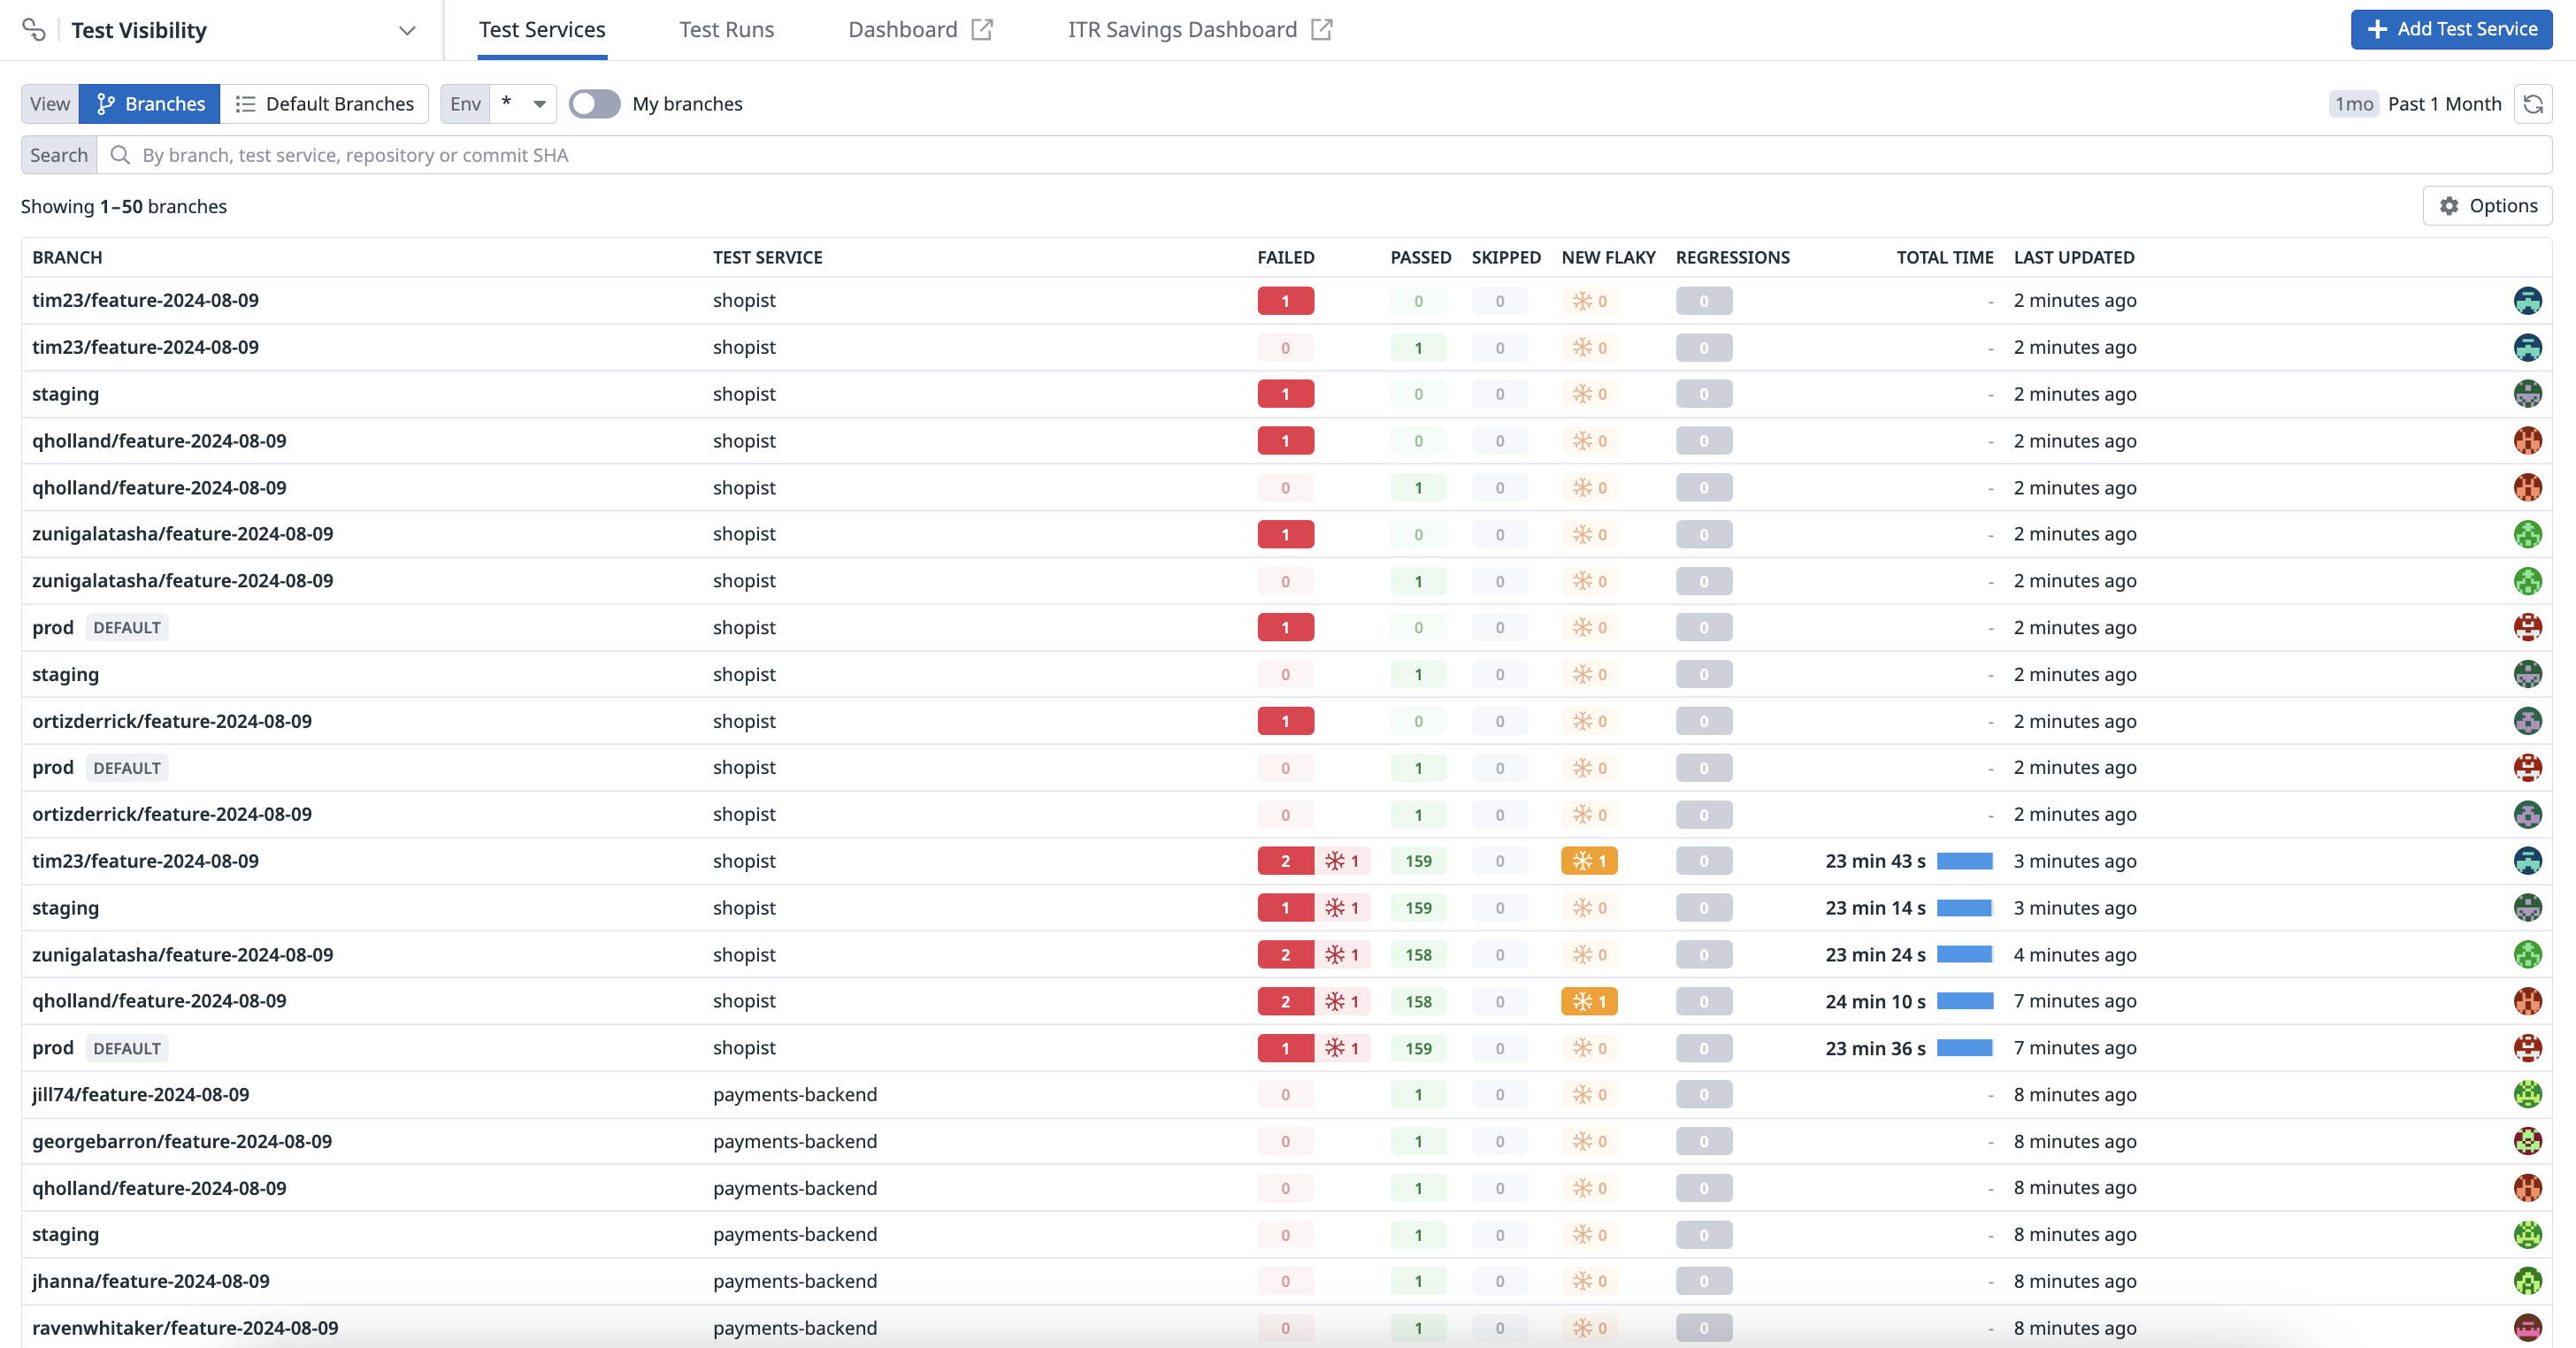
The Branches view of the Tests page lists all branches from all test services that have reported test results. This tab is useful for individual developers to quickly see the status of tests that run on their code branches and troubleshoot test failures.
In this page, you can filter the list by name, test service, or commit SHA, or to show only your branches (branches that contain at least one commit authored by you), enable the My branches toggle and add the email addresses you use in your Git configuration.
Test results
For each branch, you can see the test service, the number of failed, passed, and skipped tests, test regressions, total test time, when the commit was last updated, and the avatar of the author of the commit.
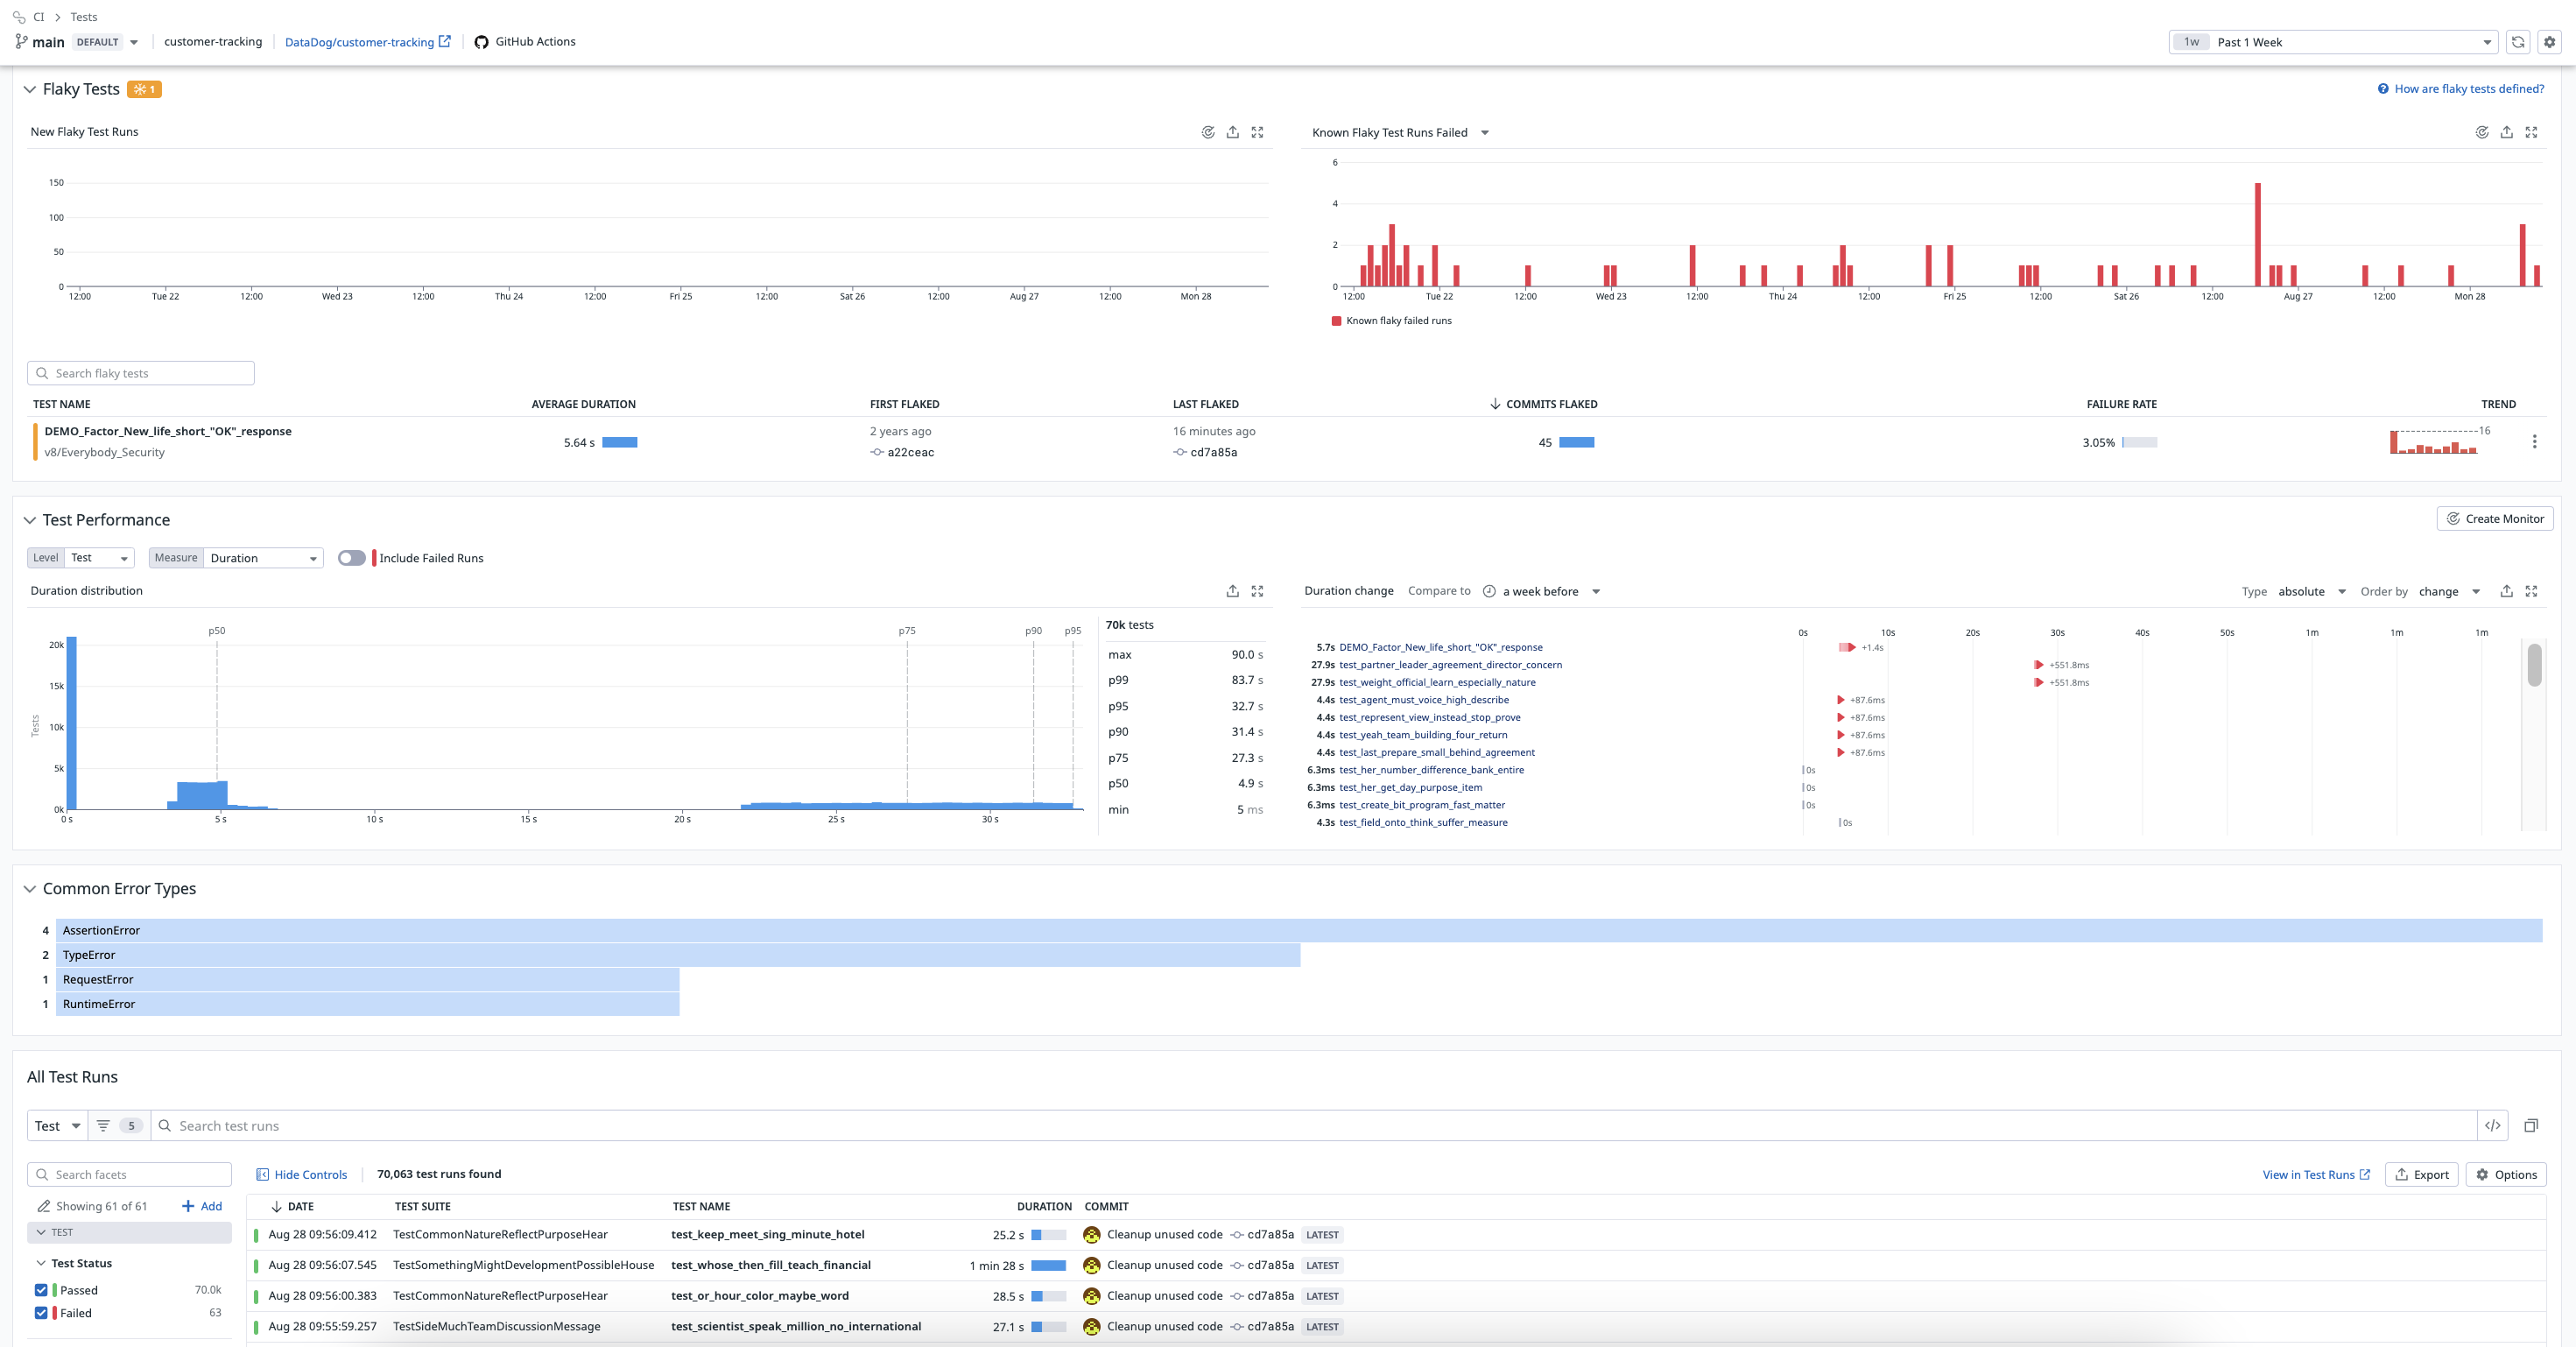
Click on a branch to explore the test details page, which includes information about the branch’s latest commits, flaky tests, test performance, common error types, and all test runs.
Test regressions
Test regressions are evaluated per commit in an effort to tie performance regressions to specific code changes.
Investigate for more details
Click on the row to see test suite run details such as test results for the last commit on this branch (or you can switch branches), failing tests and the most common errors, slow tests, flaky tests, and a complete list of test runs over the time frame selected. You can filter this list of test runs by facet to get to the information you want to see most.
Click into one of the test runs to see the test trace as a flame graph or a span list. The Runs (n) list on the left lets you quickly access traces for each retry of the test for the same commit.
Explore connections to services, resources, logs, and network events
Click the CI provider link to examine the Resource, Service, or Analytics page for the test. You can also find complete tags information and links to related log events and network monitoring events.
Default Branches view
The Default Branches view of the Tests page shows aggregated health metrics for the default branch of each test service. This view is useful for teams to understand the overall health of the service over time.
The Default Branches view shows similar information to the Branches view, but applied to the default branch.
Further reading
Additional helpful documentation, links, and articles:


