- Essentials
- Getting Started
- Datadog
- Datadog Site
- DevSecOps
- Serverless for AWS Lambda
- Agent
- Integrations
- Containers
- Dashboards
- Monitors
- Logs
- APM Tracing
- Profiler
- Tags
- API
- Service Catalog
- Session Replay
- Continuous Testing
- Synthetic Monitoring
- Incident Management
- Database Monitoring
- Cloud Security Management
- Cloud SIEM
- Application Security Management
- Workflow Automation
- CI Visibility
- Test Visibility
- Test Impact Analysis
- Code Analysis
- Learning Center
- Support
- Glossary
- Standard Attributes
- Guides
- Agent
- Integrations
- OpenTelemetry
- Developers
- Authorization
- DogStatsD
- Custom Checks
- Integrations
- Create an Agent-based Integration
- Create an API Integration
- Create a Log Pipeline
- Integration Assets Reference
- Build a Marketplace Offering
- Create a Tile
- Create an Integration Dashboard
- Create a Recommended Monitor
- Create a Cloud SIEM Detection Rule
- OAuth for Integrations
- Install Agent Integration Developer Tool
- Service Checks
- IDE Plugins
- Community
- Guides
- Administrator's Guide
- API
- Datadog Mobile App
- CoScreen
- Cloudcraft
- In The App
- Dashboards
- Notebooks
- DDSQL Editor
- Sheets
- Monitors and Alerting
- Infrastructure
- Metrics
- Watchdog
- Bits AI
- Service Catalog
- API Catalog
- Error Tracking
- Service Management
- Infrastructure
- Application Performance
- APM
- Continuous Profiler
- Database Monitoring
- Data Streams Monitoring
- Data Jobs Monitoring
- Digital Experience
- Real User Monitoring
- Product Analytics
- Synthetic Testing and Monitoring
- Continuous Testing
- Software Delivery
- CI Visibility
- CD Visibility
- Test Optimization
- Code Analysis
- Quality Gates
- DORA Metrics
- Security
- Security Overview
- Cloud SIEM
- Cloud Security Management
- Application Security Management
- AI Observability
- Log Management
- Observability Pipelines
- Log Management
- Administration
Configure Apdex score by service
Apdex (Application Performance Index) is an open standard developed by an alliance of companies that defines a standardized method to report, benchmark, and track application performance. Based on user experience satisfaction by measuring the response time of web applications and services, its role is to counterbalance response time average and percentiles which can be misleading when there are extreme data points.
Definition
Apdex is a numerical measure of user satisfaction with the performance of enterprise web applications. It converts many measurements into one number on a uniform scale on the [0;1] interval:
- 0 = no users satisfied
- 1 = all users satisfied
To define your Apdex, you need to be an administrator of your Datadog account. First define a time threshold—T—separating satisfactory response times from unsatisfactory response times from your web application or service. With one threshold you can then define three categories:
- Satisfied requests have a response time below T.
- Tolerated requests have a response time equal to or above T and below or equal to 4T.
- Frustrated requests have a response time above 4T or returns an error.
Once the threshold is defined and your requests are categorized, the Apdex is defined as:
$$\bo\text"Apdex"=({\bo\text"Satisfied"\text" requests" + {{\bo\text"Tolerated"\text" requests"} / 2}})/{\bo\text"Total"\text" requests"} $$
Selecting the correct threshold is important because the Frustrated requests are 4 times slower than “normal”. If T=3 the user waits 3 seconds for a page to load but does not tolerate waiting 12 seconds.
Apdex thresholds must be set by administrators, per service, before Apdex scores calculated.
Set your Apdex for your traces
To visualize your web application or service Apdex:
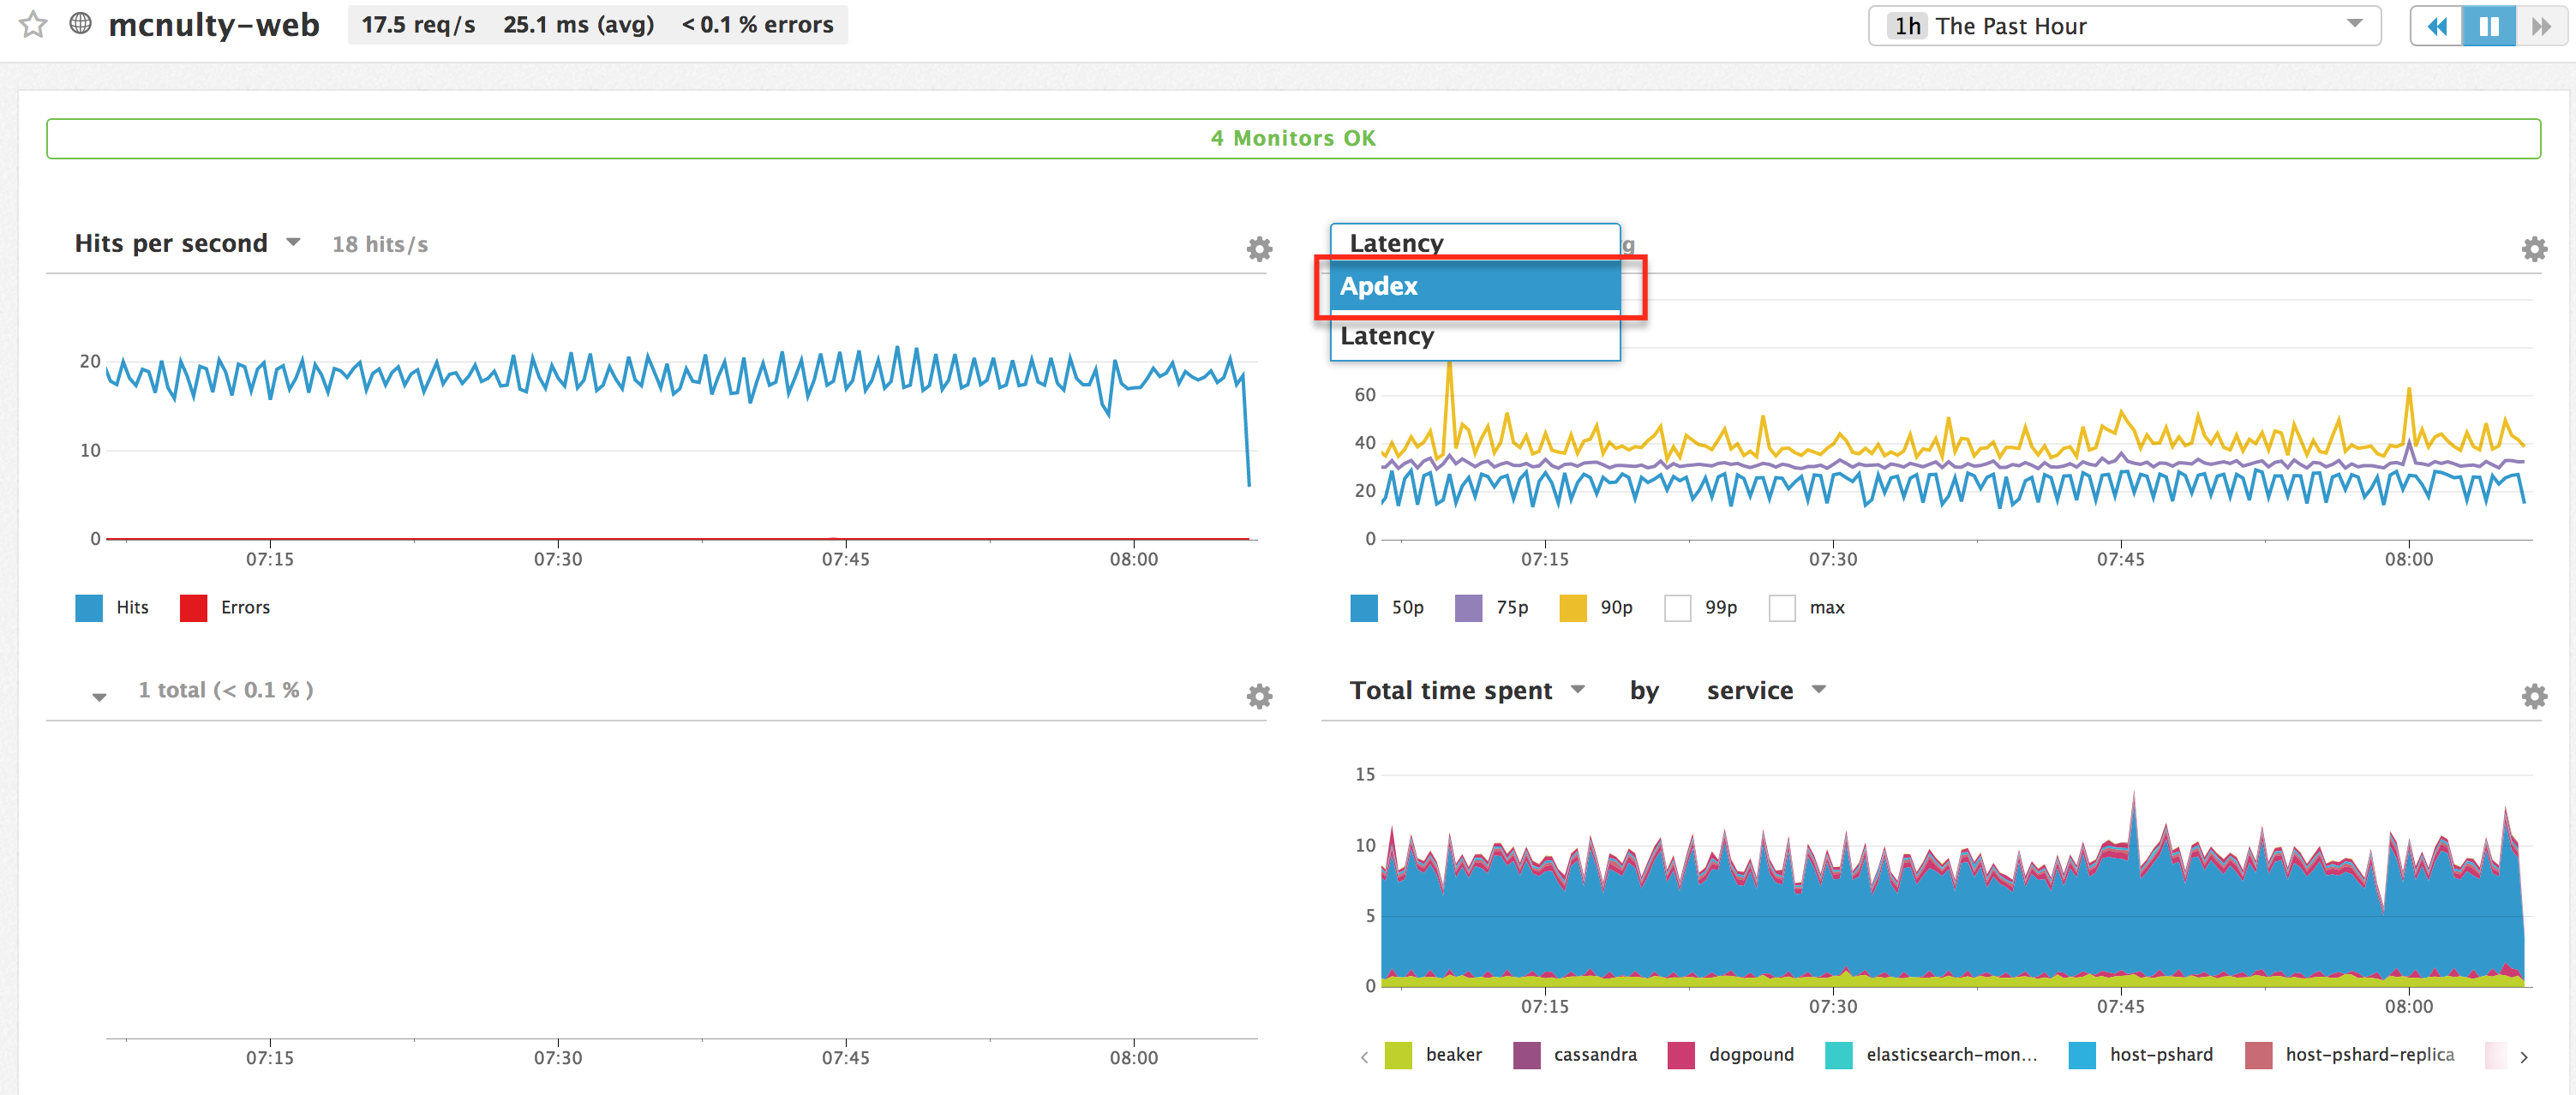
On the Service Catalog, click into a web service. On the upper right-hand graph, select Apdex instead of Latency. If you don’t see this option, check that you have clicked into a web service:
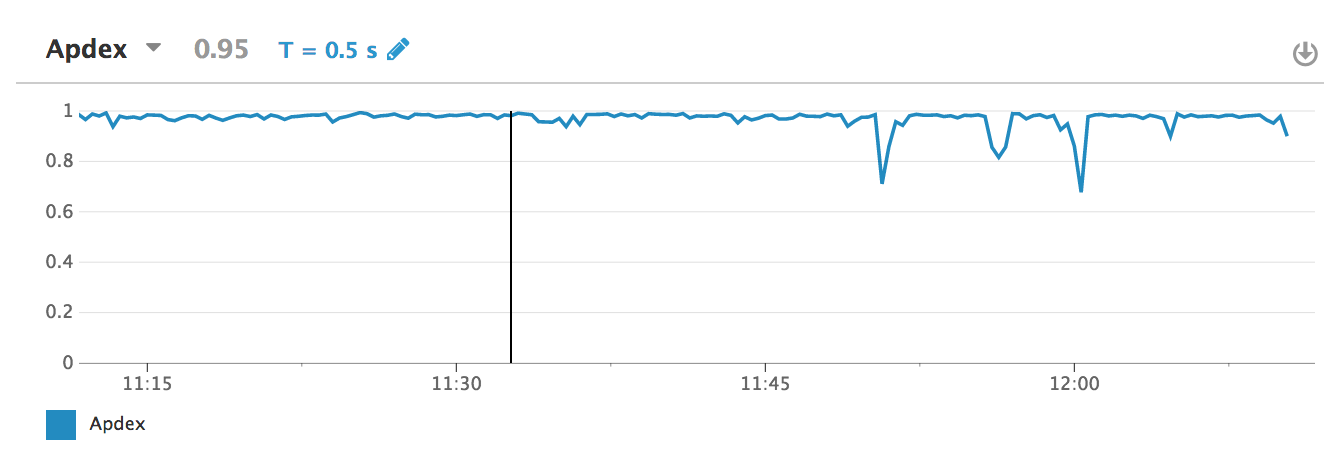
Use the pencil icon on the top left of your widget to configure your Apdex (you must be an administrator to see this icon):
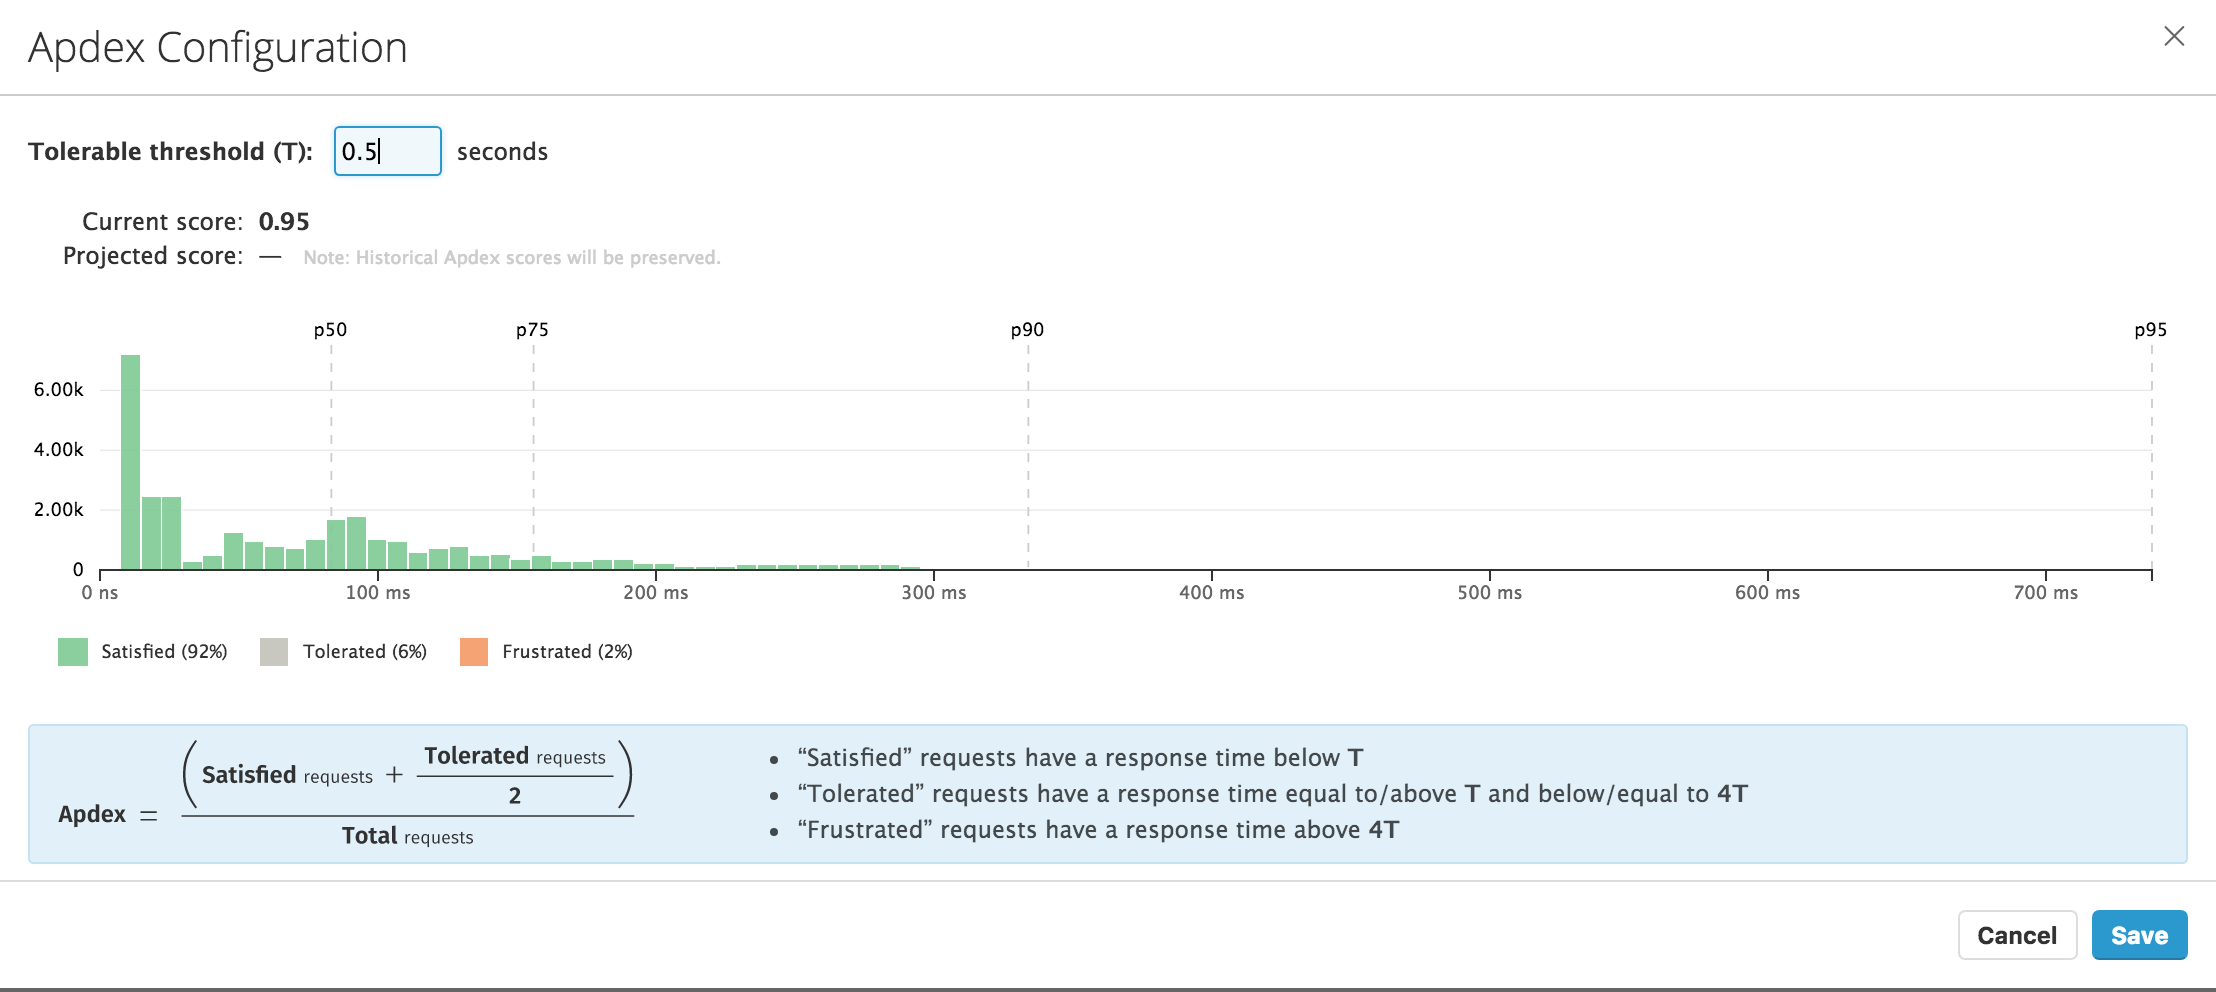
Enter your threshold directly to visualize your request distribution:
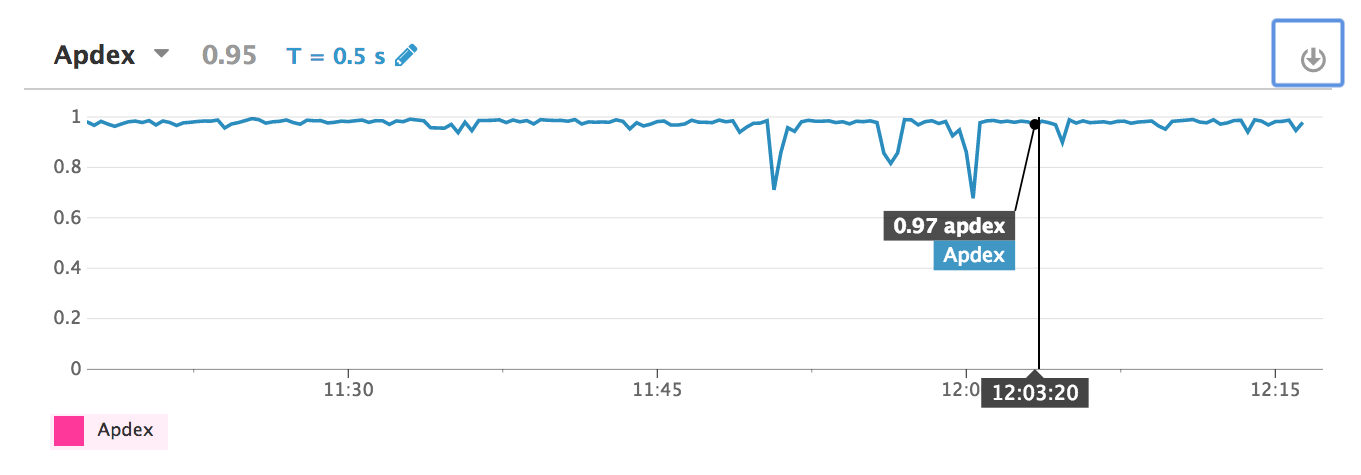
Save your widget to follow your Apdex evolution over time:
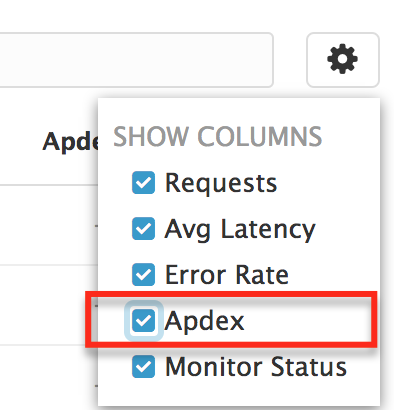
Display your Apdex on the Service Catalog
To display Apdex scores on the Service Catalog, select it in the configuration menu on the upper right corner of the page:
