- Essentials
- Getting Started
- Datadog
- Datadog Site
- DevSecOps
- Serverless for AWS Lambda
- Agent
- Integrations
- Containers
- Dashboards
- Monitors
- Logs
- APM Tracing
- Profiler
- Tags
- API
- Service Catalog
- Session Replay
- Continuous Testing
- Synthetic Monitoring
- Incident Management
- Database Monitoring
- Cloud Security Management
- Cloud SIEM
- Application Security Management
- Workflow Automation
- CI Visibility
- Test Visibility
- Test Impact Analysis
- Code Analysis
- Learning Center
- Support
- Glossary
- Standard Attributes
- Guides
- Agent
- Integrations
- OpenTelemetry
- Developers
- Authorization
- DogStatsD
- Custom Checks
- Integrations
- Create an Agent-based Integration
- Create an API Integration
- Create a Log Pipeline
- Integration Assets Reference
- Build a Marketplace Offering
- Create a Tile
- Create an Integration Dashboard
- Create a Recommended Monitor
- Create a Cloud SIEM Detection Rule
- OAuth for Integrations
- Install Agent Integration Developer Tool
- Service Checks
- IDE Plugins
- Community
- Guides
- Administrator's Guide
- API
- Datadog Mobile App
- CoScreen
- Cloudcraft
- In The App
- Dashboards
- Notebooks
- DDSQL Editor
- Sheets
- Monitors and Alerting
- Infrastructure
- Metrics
- Watchdog
- Bits AI
- Service Catalog
- API Catalog
- Error Tracking
- Service Management
- Infrastructure
- Application Performance
- APM
- Continuous Profiler
- Database Monitoring
- Data Streams Monitoring
- Data Jobs Monitoring
- Digital Experience
- Real User Monitoring
- Product Analytics
- Synthetic Testing and Monitoring
- Continuous Testing
- Software Delivery
- CI Visibility
- CD Visibility
- Test Optimization
- Code Analysis
- Quality Gates
- DORA Metrics
- Security
- Security Overview
- Cloud SIEM
- Cloud Security Management
- Application Security Management
- AI Observability
- Log Management
- Observability Pipelines
- Log Management
- Administration
Primary Operations in Services
APM services
APM services calculate trace metrics for errors, throughput, and latency. These are calculated based on resources that match a single span name, deemed the primary operation. These service metrics are used throughout the product, both as the default Service Page, in the Service Catalog, and the Service Map.
Note: Trace Metrics can be queried based on their trace.* namespace.
Primary operations
Definition
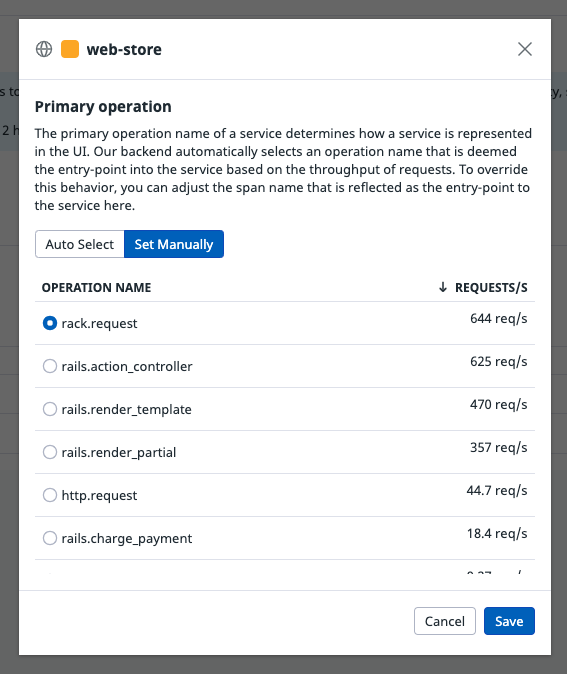
The primary operation name of a service determines how that service is represented in the UI. The Datadog backend automatically selects an operation name that is deemed the entry-point into the service based on the throughput of requests.
As an example, a web-store service can have multiple endpoints which are instrumented as resources. These resources then share the same primary operation because the entry-point into these resources is consistent. For example, the resources /user/home and /user/new should both have the same primary operation web.request. In different languages a primary operation for a service may look like:
| Service Type | Primary Operation |
|---|---|
| web | servlet.request, flask.request, web.request |
| db | postgres.query, db.query |
| custom-instrumentation | trace.annotation, method.call |
Configuration
When there are multiple primary operations defined for a service, the highest request throughput determines the operation automatically selected to be the entry-point for the service. An admin user can set this setting manually:
- Go to the APM settings page.
- Select the Primary Operation Name tab.
- Click on the edit icon for the service that you want to manually set.
- Click the Set Manually tab.
- Select the operation that you want reflected as the entry-point to the service.
- Click Save.
Viewing stats for additional span names
To ensure that all traces are being sent to Datadog correctly outside of any instrumentation, you can view your resources by additional span names that are considered a secondary operation with a dropdown menu. However, these are not used to calculate service-level statistics.
Manual instrumentation
When writing custom spans, statically set the span name to ensure that your resources are grouped with the same primary operation (for example, web.request). If the span is being named dynamically, set it as the resource (for example, /user/profile).
See Custom Instrumentation for your programming language for detailed information.
OpenTracing
When using Datadog, the OpenTracing operation name is a resource and the OpenTracing “component” tag is Datadog’s span name. For example, to define (in OpenTracing terms) a span that has the resource “/user/profile”, and the span name “http.request”:
Span span = tracer.buildSpan("http.request").start();

try (Scope scope = tracer.activateSpan(span)) {
    span.setTag("service.name", "service_name");
    span.setTag("resource.name", "/user/profile");
    // code being traced
} finally {
    span.finish();
}
For more information, see Setting up Java and OpenTracing.
from ddtrace.opentracer.tags import Tags
import opentracing
span = opentracing.tracer.start_span('http.request')
span.set_tag(Tags.RESOURCE_NAME, '/user/profile')
span.set_tag(Tags.SPAN_TYPE, 'web')

# ...
span.finish()
For more information, see Setting up Python and OpenTracing.
OpenTracing.start_active_span('http.request') do |scope|
  scope.span.datadog_span.resource = '/user/profile'
  # code being traced
end
For more information, see Setting up Ruby and OpenTracing.
opentracing.StartSpan("http.request", opentracer.ResourceName("/user/profile"))
For more information, see Setting up Go and OpenTracing.
const span = tracer.startSpan('http.request');
span.setTag('resource.name',  '/user/profile')
span.setTag('span.type', 'web')
// code being traced
span.finish();
For more information, see Setting up Node.js and OpenTracing.
using OpenTracing;
using OpenTracing.Util;

using (var scope = GlobalTracer.Instance.BuildSpan("http.request").StartActive(finishSpanOnDispose: true))
{
    scope.Span.SetTag("resource.name", "/user/profile");
    // code being traced
}
For more information, see Setting up .NET and OpenTracing.
// Once, at the beginning of your index.php, right after composer's autoloader import.
// For OpenTracing <= 1.0-beta6
$otTracer = new \DDTrace\OpenTracer\Tracer(\DDTrace\GlobalTracer::get());
// For OpenTracing >= 1.0
$otTracer = new \DDTrace\OpenTracer1\Tracer(\DDTrace\GlobalTracer::get());
// Register the global tracer wrapper
 \OpenTracing\GlobalTracer::set($otTracer);

// Anywhere in your application code
$otTracer = \OpenTracing\GlobalTracer::get();
$scope = $otTracer->startActiveSpan('http.request');
$span = $scope->getSpan();
$span->setTag('service.name', 'service_name');
$span->setTag('resource.name', '/user/profile');
$span->setTag('span.type', 'web');
// ...Use OpenTracing as expected
$scope->close();
For more information, see Setting up PHP and OpenTracing.
// Create a root span for the current request.
auto root_span = tracer->StartSpan("web.request");
// Set a resource name for the root span.
root_span->SetTag(datadog::tags::resource_name, "/user/profile");
For more information, see Setting up C++ and Custom Instrumentation.
Further Reading
Additional helpful documentation, links, and articles:

