- 重要な情報
- はじめに
- Datadog
- Datadog サイト
- DevSecOps
- AWS Lambda のサーバーレス
- エージェント
- インテグレーション
- コンテナ
- ダッシュボード
- アラート設定
- ログ管理
- トレーシング
- プロファイラー
- タグ
- API
- Service Catalog
- Session Replay
- Continuous Testing
- Synthetic モニタリング
- Incident Management
- Database Monitoring
- Cloud Security Management
- Cloud SIEM
- Application Security Management
- Workflow Automation
- CI Visibility
- Test Visibility
- Intelligent Test Runner
- Code Analysis
- Learning Center
- Support
- 用語集
- Standard Attributes
- ガイド
- インテグレーション
- エージェント
- OpenTelemetry
- 開発者
- 認可
- DogStatsD
- カスタムチェック
- インテグレーション
- Create an Agent-based Integration
- Create an API Integration
- Create a Log Pipeline
- Integration Assets Reference
- Build a Marketplace Offering
- Create a Tile
- Create an Integration Dashboard
- Create a Recommended Monitor
- Create a Cloud SIEM Detection Rule
- OAuth for Integrations
- Install Agent Integration Developer Tool
- サービスのチェック
- IDE インテグレーション
- コミュニティ
- ガイド
- API
- モバイルアプリケーション
- CoScreen
- Cloudcraft
- アプリ内
- Service Management
- インフラストラクチャー
- アプリケーションパフォーマンス
- APM
- Continuous Profiler
- データベース モニタリング
- Data Streams Monitoring
- Data Jobs Monitoring
- Digital Experience
- Software Delivery
- CI Visibility (CI/CDの可視化)
- CD Visibility
- Test Visibility
- Intelligent Test Runner
- Code Analysis
- Quality Gates
- DORA Metrics
- セキュリティ
- セキュリティの概要
- Cloud SIEM
- クラウド セキュリティ マネジメント
- Application Security Management
- AI Observability
- ログ管理
- Observability Pipelines(観測データの制御)
- ログ管理
- 管理
Sheets
このページは日本語には対応しておりません。随時翻訳に取り組んでいます。翻訳に関してご質問やご意見ございましたら、お気軽にご連絡ください。
Join the Beta!
Sheets is available in private beta. To qualify for this product beta, you should have existing use cases where you currently use spreadsheets (such as Excel or Google Sheets) with Datadog’s metrics, logs, or RUM data. If you're interested in this feature, complete the form to request access.
Request AccessOverview
Sheets is a spreadsheet tool that you can populate with Datadog data, enabling you to perform complex analysis and build reports without requiring technical expertise. It allows teams to use familiar spreadsheet functions like lookups, pivot tables, and calculations on Datadog data, so you don’t have to export and use another tool with stale data.
Sheets lets you manipulate, transform, and analyze data from logs, real user monitoring, and cloud cost monitoring in a familiar spreadsheet interface.
Create a table
Start by creating a table of data, either by building a new query from Sheets or transferring a query from the logs explorer, RUM explorer or metrics explorer.
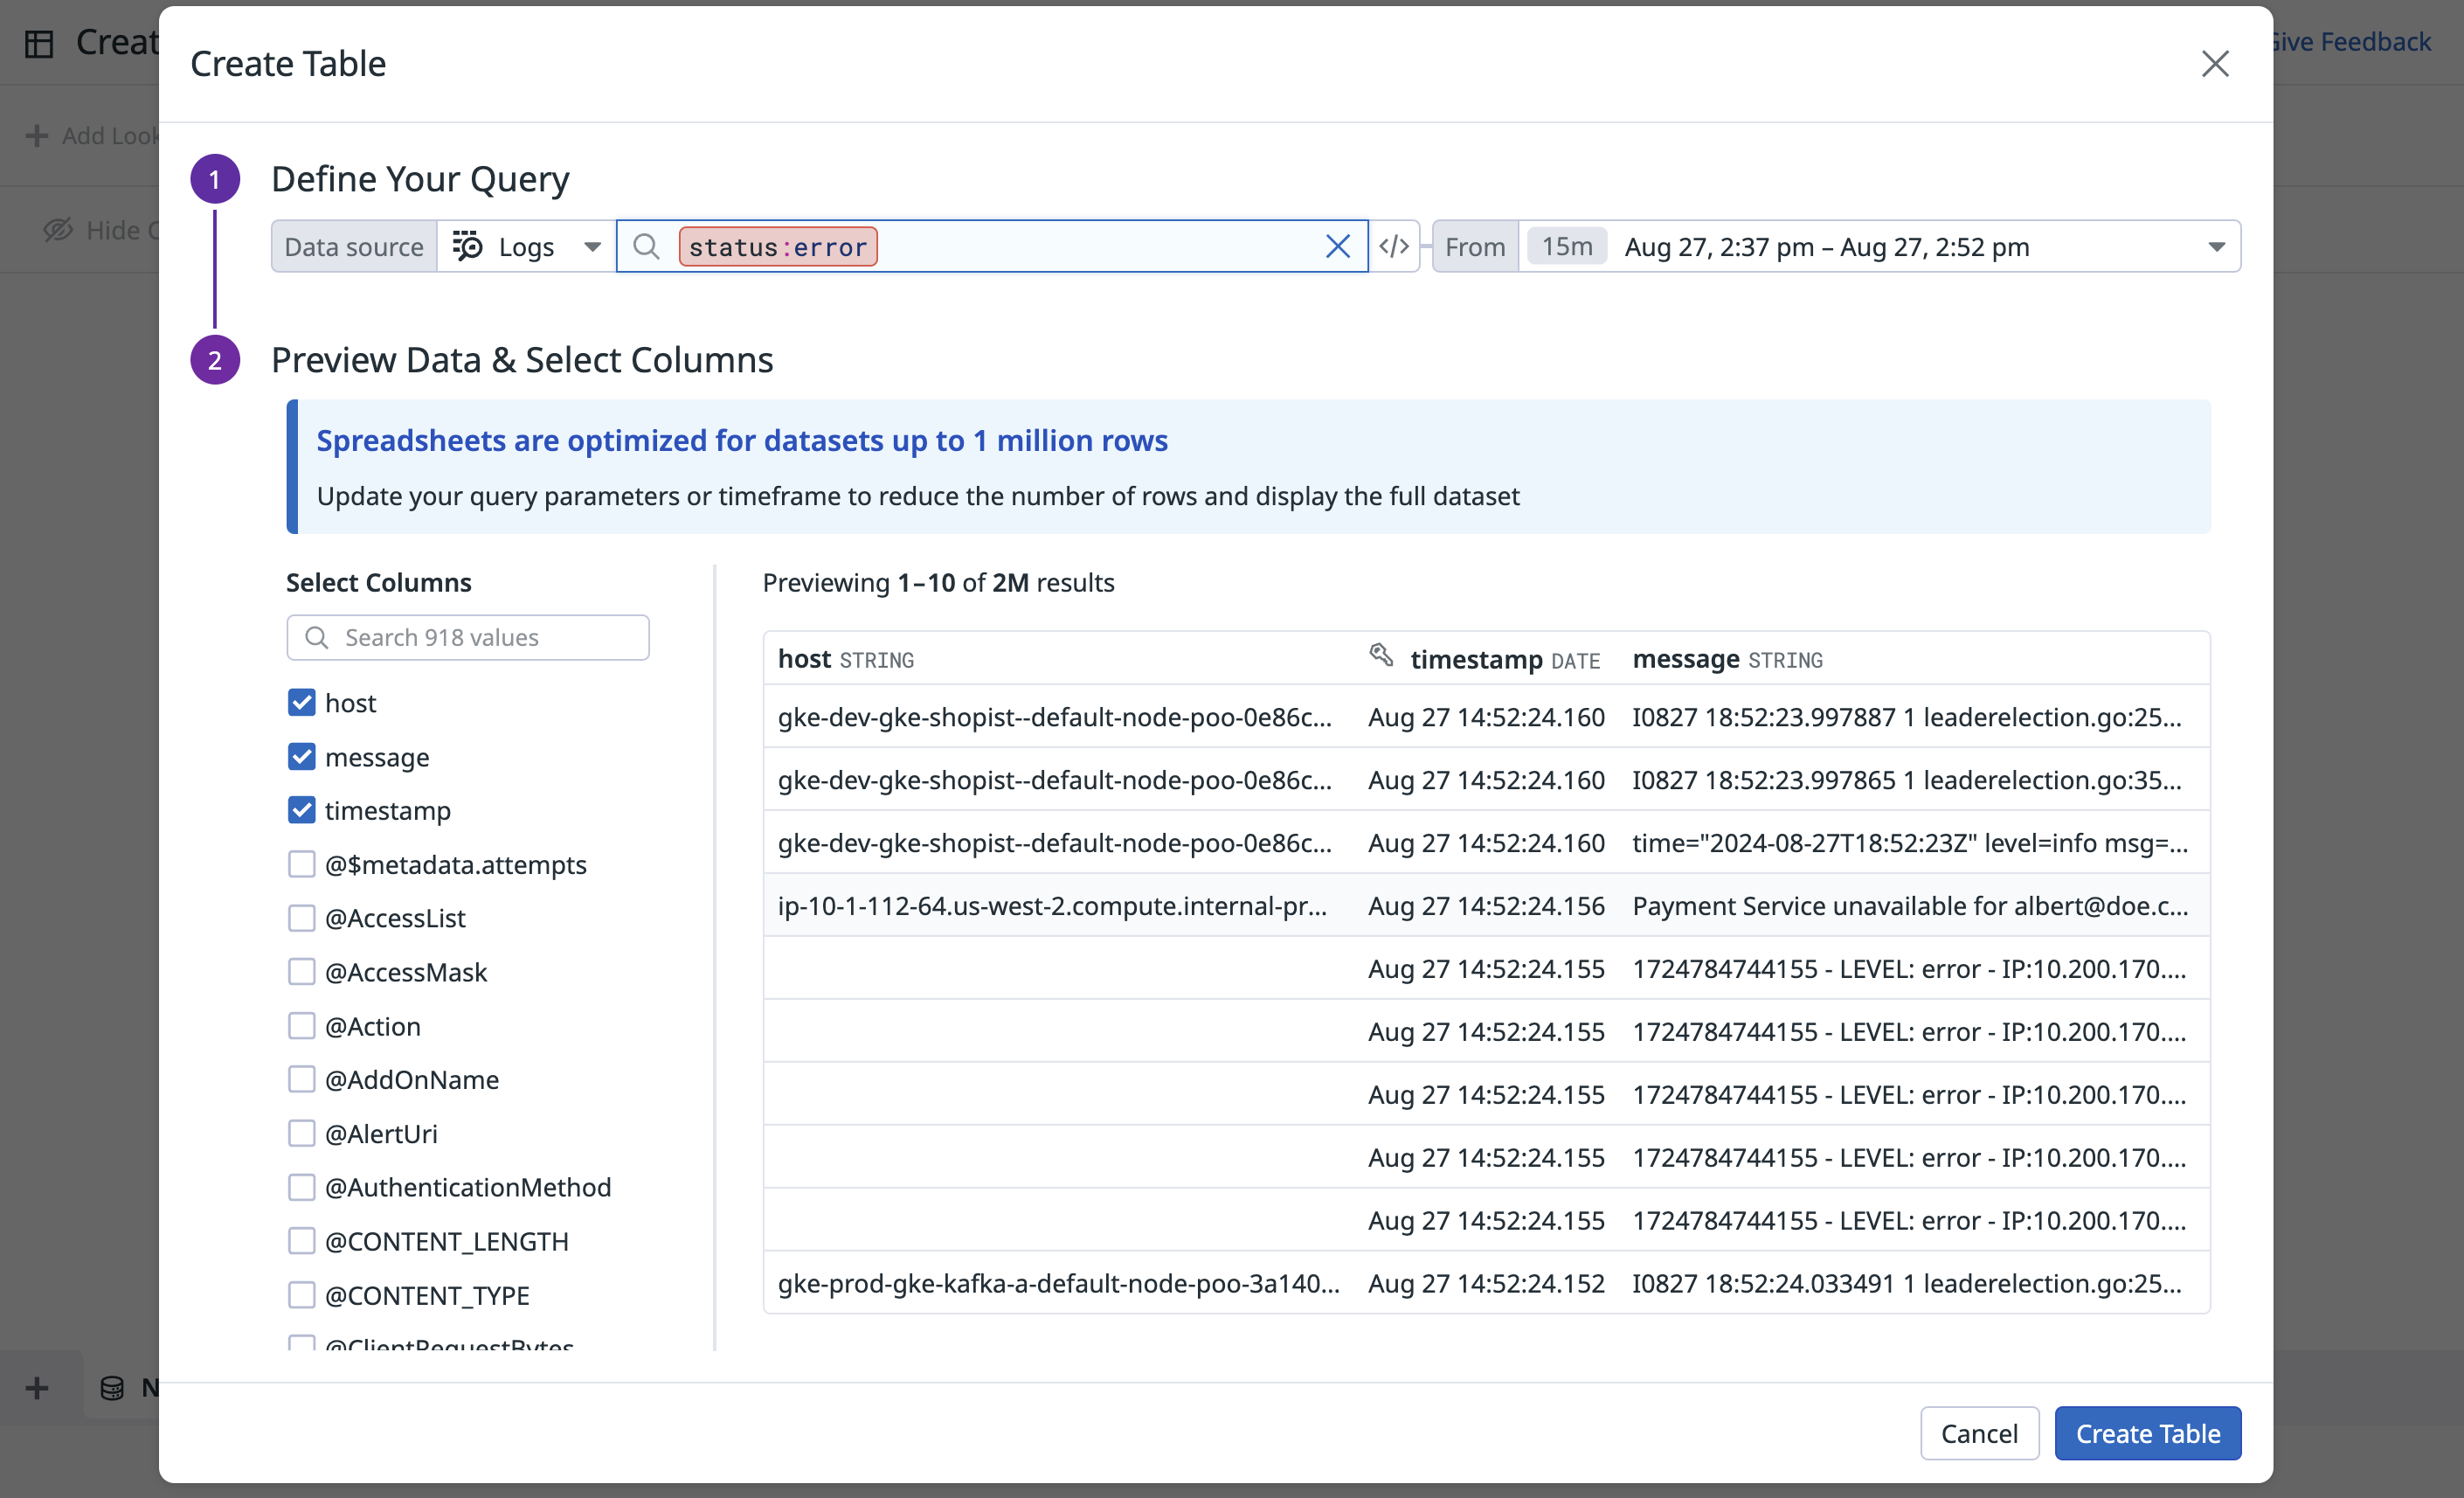
Add a new table in Sheets
- On the Datadog Sheets page, click New Spreadsheet.
- Click Add Data.
- Start building your query by selecting your Data source, and adding filtering parameters.
- Select the columns you want to display and preview the resulting table.
- Click Create Table.
Transfer your query to a spreadsheet
- On the page of a supported product (such as the Log Explorer), build the query of data you want to analyze, such as filtering your Logs view to those that have
status:error. - Click Open in Sheets. For a list of product pages you can create a table from, see the Supported data sources section.
- You can create a New Spreadsheet or add this table of data to an Existing Spreadsheet.
- Click Save and Open.
Calculated columns
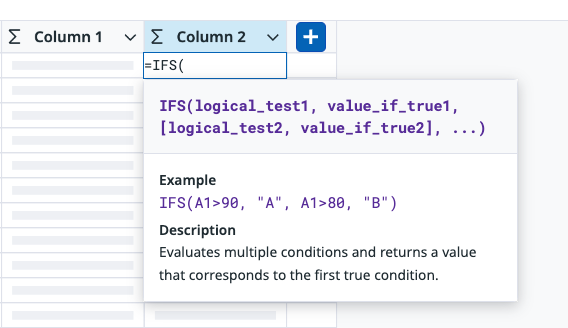
You can use a calculated column to add a formula, parse a log message, or add business logic to your data. Your calculated columns can be used in the pivot table you’ll create later.
From the header of the far right column of your table, click the Plus icon to Add calculated column. Enter a function to view the syntax and description of the function. For a full list of supported functions, see the Functions and Operators documentation.
Lookup
Lookup enriches your existing data and adds more context to your table. Click Add Lookup at the top of the page to add columns from another table or data source, such as Reference Tables. Lookup is like a left join or a vlookup in Excel or Google Sheets; it matches records on a common column, and returns additional columns of data to enrich your existing Sheets table.
For example, you have a table of RUM data with user emails, and you want to know which teams these users belong to. You can add a lookup that compares the user email column in your table with the work email column in a Reference Table. Lookup pulls the team from the Reference Table and adds it as a new column to your spreadsheet.
Pivot table
After you add a table of data to a spreadsheet, analyze and add context to your raw data with a Pivot table. Use pivot tables to summarize and organize large amounts of data into customized tables. It helps you analyze data to find patterns and trends, and see comparisons. For example, you can have a table of error logs with a hundred rows, but with a pivot table you can break down that data into a summary table that counts your error logs by method or region. To create a pivot table:
- From an existing spreadsheet that already has a table of data, click Add Pivot Table.
- In the Rows section, select the dimensions you want to analyze, such as the status of logs.
- In the Calculations section, select the dimensions you want to use in calculations, including sum, average, count, min, and max.
Supported data sources
Create tables and analyze the data pulled from the following data sources:
| Data Source | Product page |
|---|---|
| Logs | Logs Explorer |
| Real User Monitoring | RUM Explorer |
| Cloud Cost | Metrics ExplorerNote: The Cloud Cost data sources must be selected. |
Further reading
お役に立つドキュメント、リンクや記事:


