- Essentials
- Getting Started
- Datadog
- Datadog Site
- DevSecOps
- Serverless for AWS Lambda
- Agent
- Integrations
- Containers
- Dashboards
- Monitors
- Logs
- APM Tracing
- Profiler
- Tags
- API
- Service Catalog
- Session Replay
- Continuous Testing
- Synthetic Monitoring
- Incident Management
- Database Monitoring
- Cloud Security Management
- Cloud SIEM
- Application Security Management
- Workflow Automation
- CI Visibility
- Test Visibility
- Test Impact Analysis
- Code Analysis
- Learning Center
- Support
- Glossary
- Standard Attributes
- Guides
- Agent
- Integrations
- OpenTelemetry
- Developers
- Authorization
- DogStatsD
- Custom Checks
- Integrations
- Create an Agent-based Integration
- Create an API Integration
- Create a Log Pipeline
- Integration Assets Reference
- Build a Marketplace Offering
- Create a Tile
- Create an Integration Dashboard
- Create a Recommended Monitor
- Create a Cloud SIEM Detection Rule
- OAuth for Integrations
- Install Agent Integration Developer Tool
- Service Checks
- IDE Plugins
- Community
- Guides
- Administrator's Guide
- API
- Datadog Mobile App
- CoScreen
- Cloudcraft
- In The App
- Dashboards
- Notebooks
- DDSQL Editor
- Sheets
- Monitors and Alerting
- Infrastructure
- Metrics
- Watchdog
- Bits AI
- Service Catalog
- API Catalog
- Error Tracking
- Service Management
- Infrastructure
- Application Performance
- APM
- Continuous Profiler
- Database Monitoring
- Data Streams Monitoring
- Data Jobs Monitoring
- Digital Experience
- Real User Monitoring
- Product Analytics
- Synthetic Testing and Monitoring
- Continuous Testing
- Software Delivery
- CI Visibility
- CD Visibility
- Test Optimization
- Code Analysis
- Quality Gates
- DORA Metrics
- Security
- Security Overview
- Cloud SIEM
- Cloud Security Management
- Application Security Management
- AI Observability
- Log Management
- Observability Pipelines
- Log Management
- Administration
Error Tracking Explorer
Overview
The Error Tracking Explorer allows you to view, filter, and investigate issues. An issue is a group of similar errors related to the same bug. Datadog creates issues by computing a fingerprint for each error using some of its attributes such as the error type, the error message, or the stack trace. Errors with the same fingerprint are grouped together in the same issue.
Explore your issues
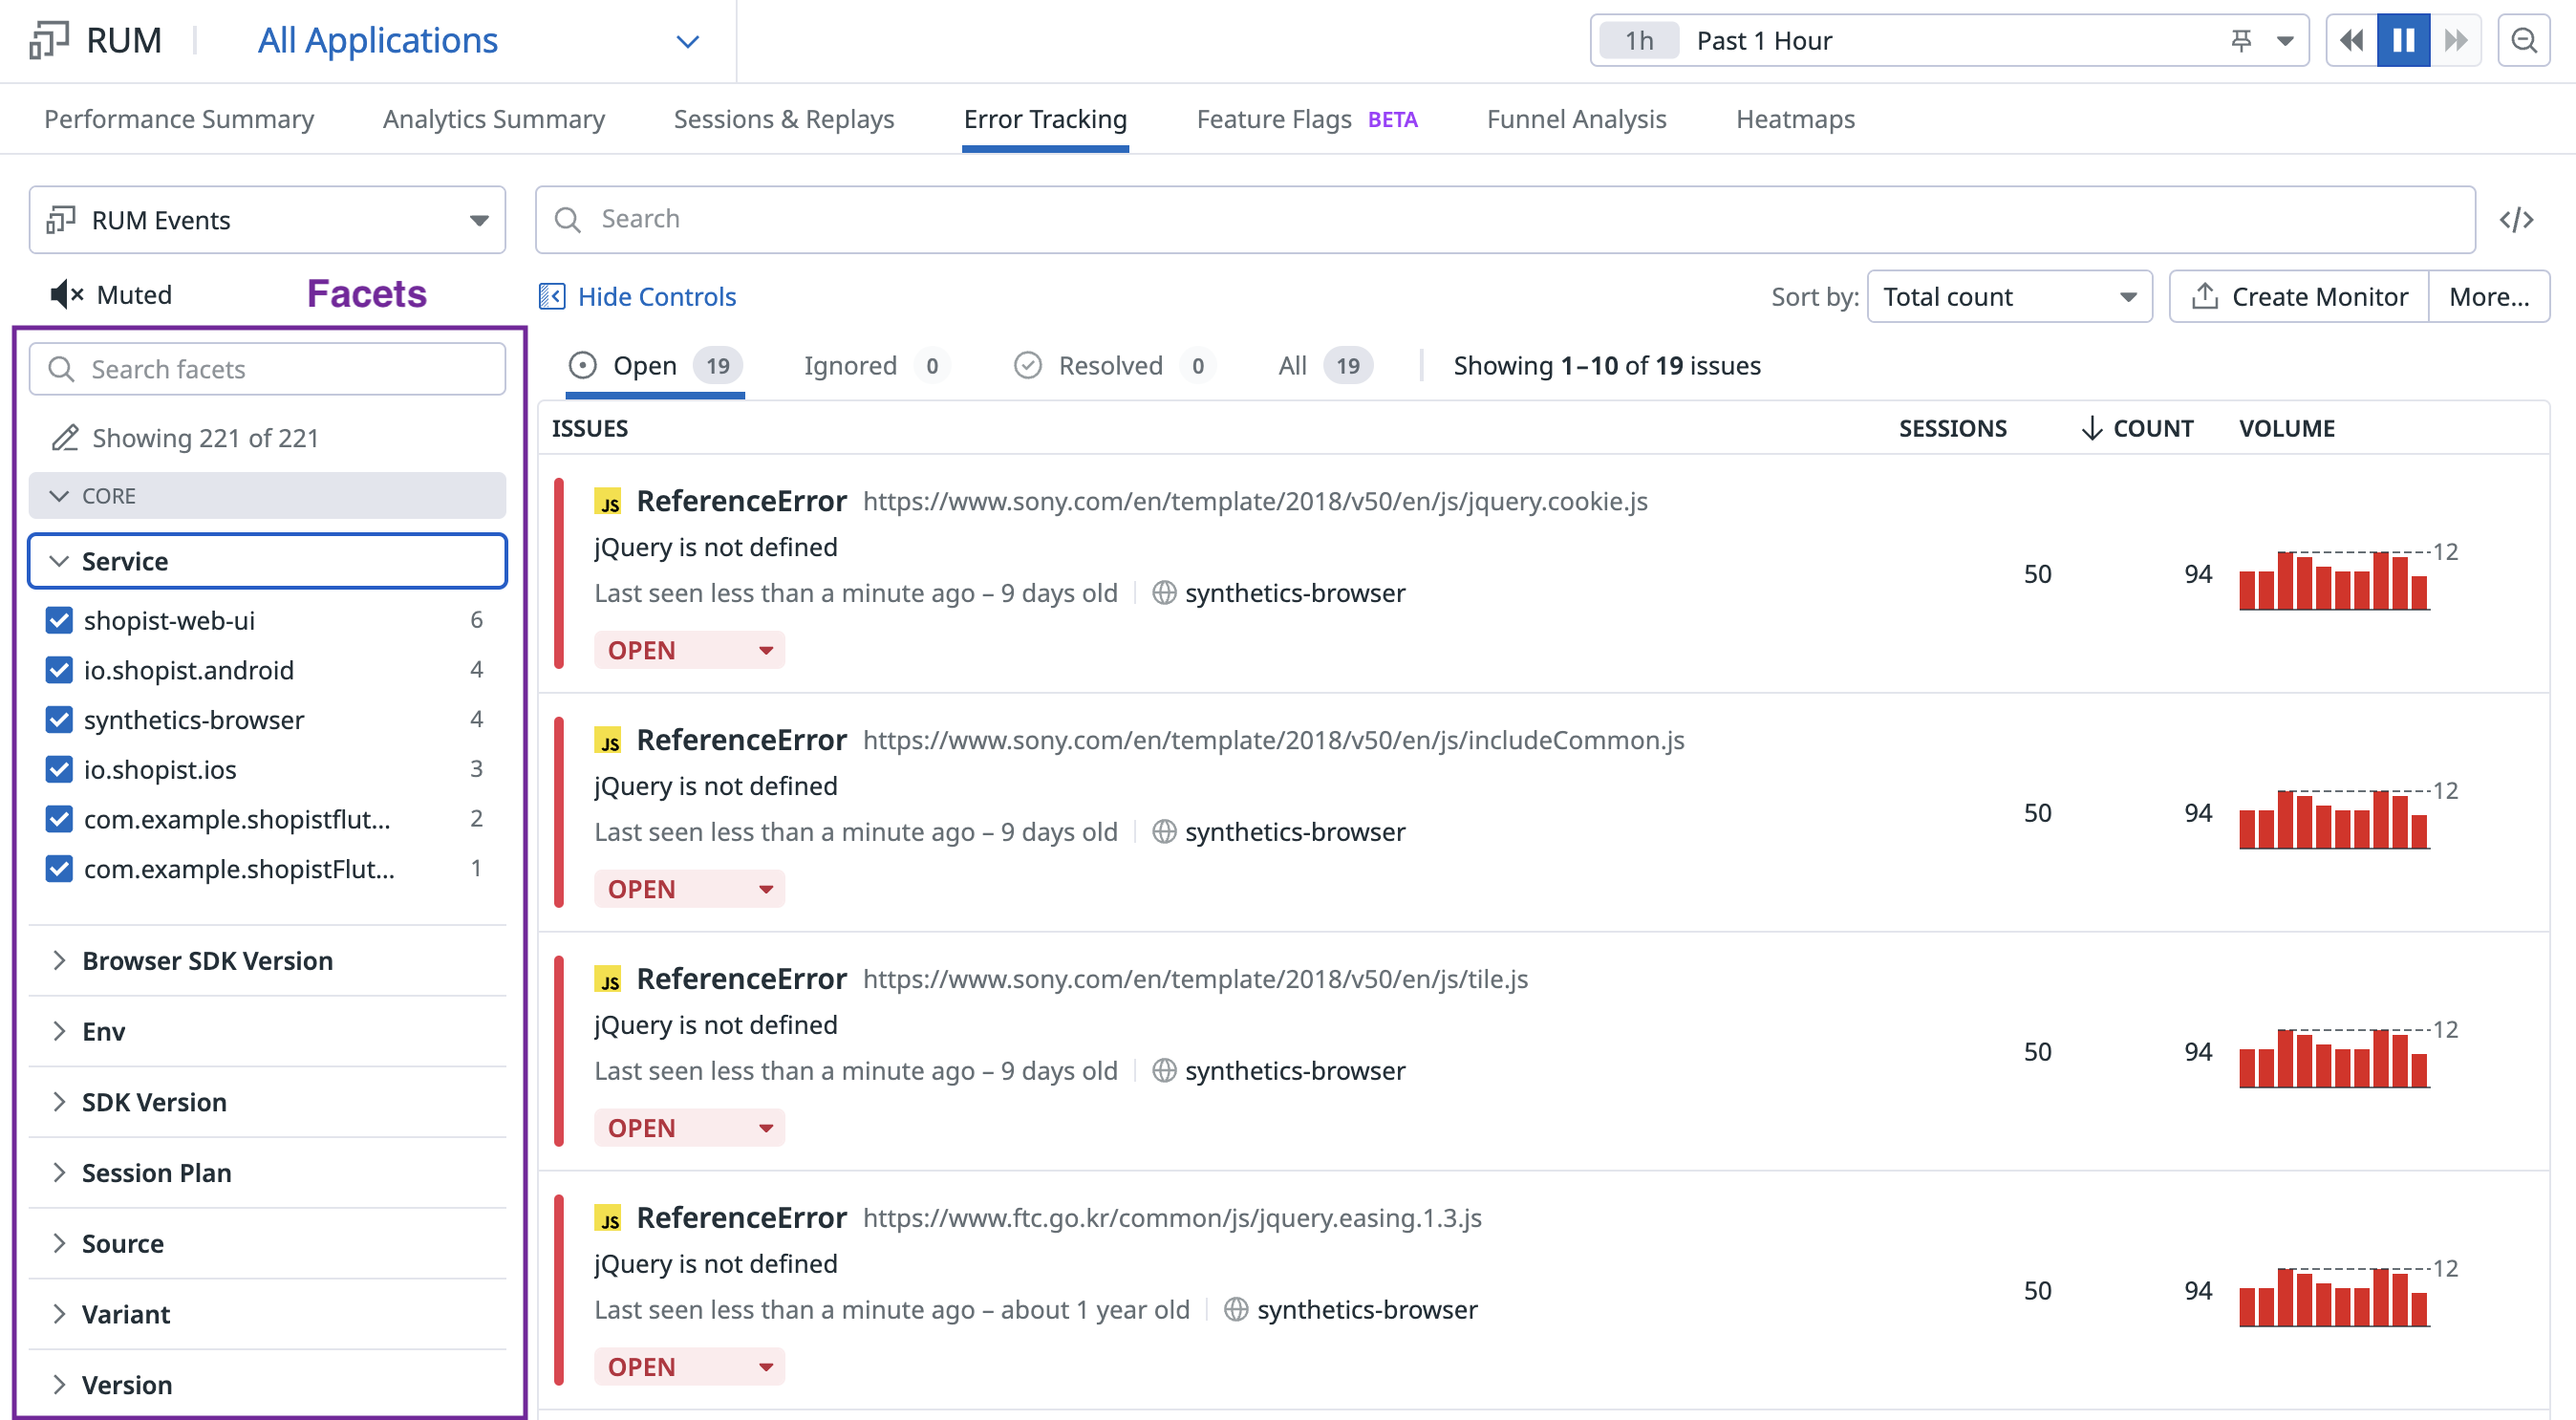
Each item listed in the Error Tracking Explorer is an issue that contains high-level information about the error, including the following:
- The error type and the error message
- The path to the file in which underlying errors are fired
- Important information about the issue’s lifetime:
- When it was first and last seen
- Graph of occurrences over time
- Number of occurrences in the selected time period
Time range
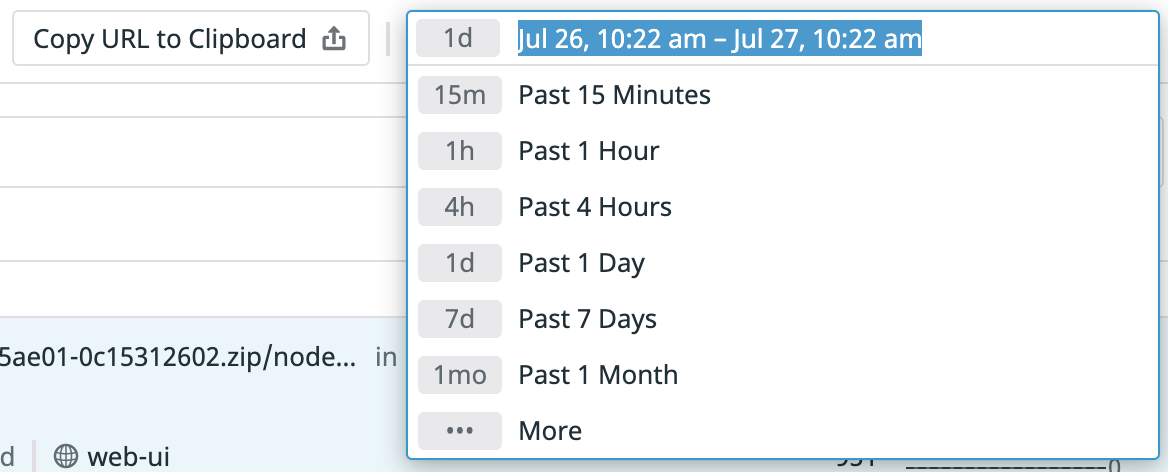
The time range appears on the top right of the Explorer as a timeline. This feature allows you to display issues having error occurrences within the selected time period. Change the time range by selecting a preset range from the dropdown.
Facets
Error Tracking automatically indexes a predefined list of attributes from your issues and creates facets out of it. A facet displays all the distinct members of an attribute for the selected time period and provides some basic analytics, such as the number of issues represented. Facets allow you to pivot or filter your issues based on the given attribute.
Click the Edit icon to see the list of available facets that you can show or hide from view.
Inspect an issue
Click on any issue to open the issue panel and see more information about it.
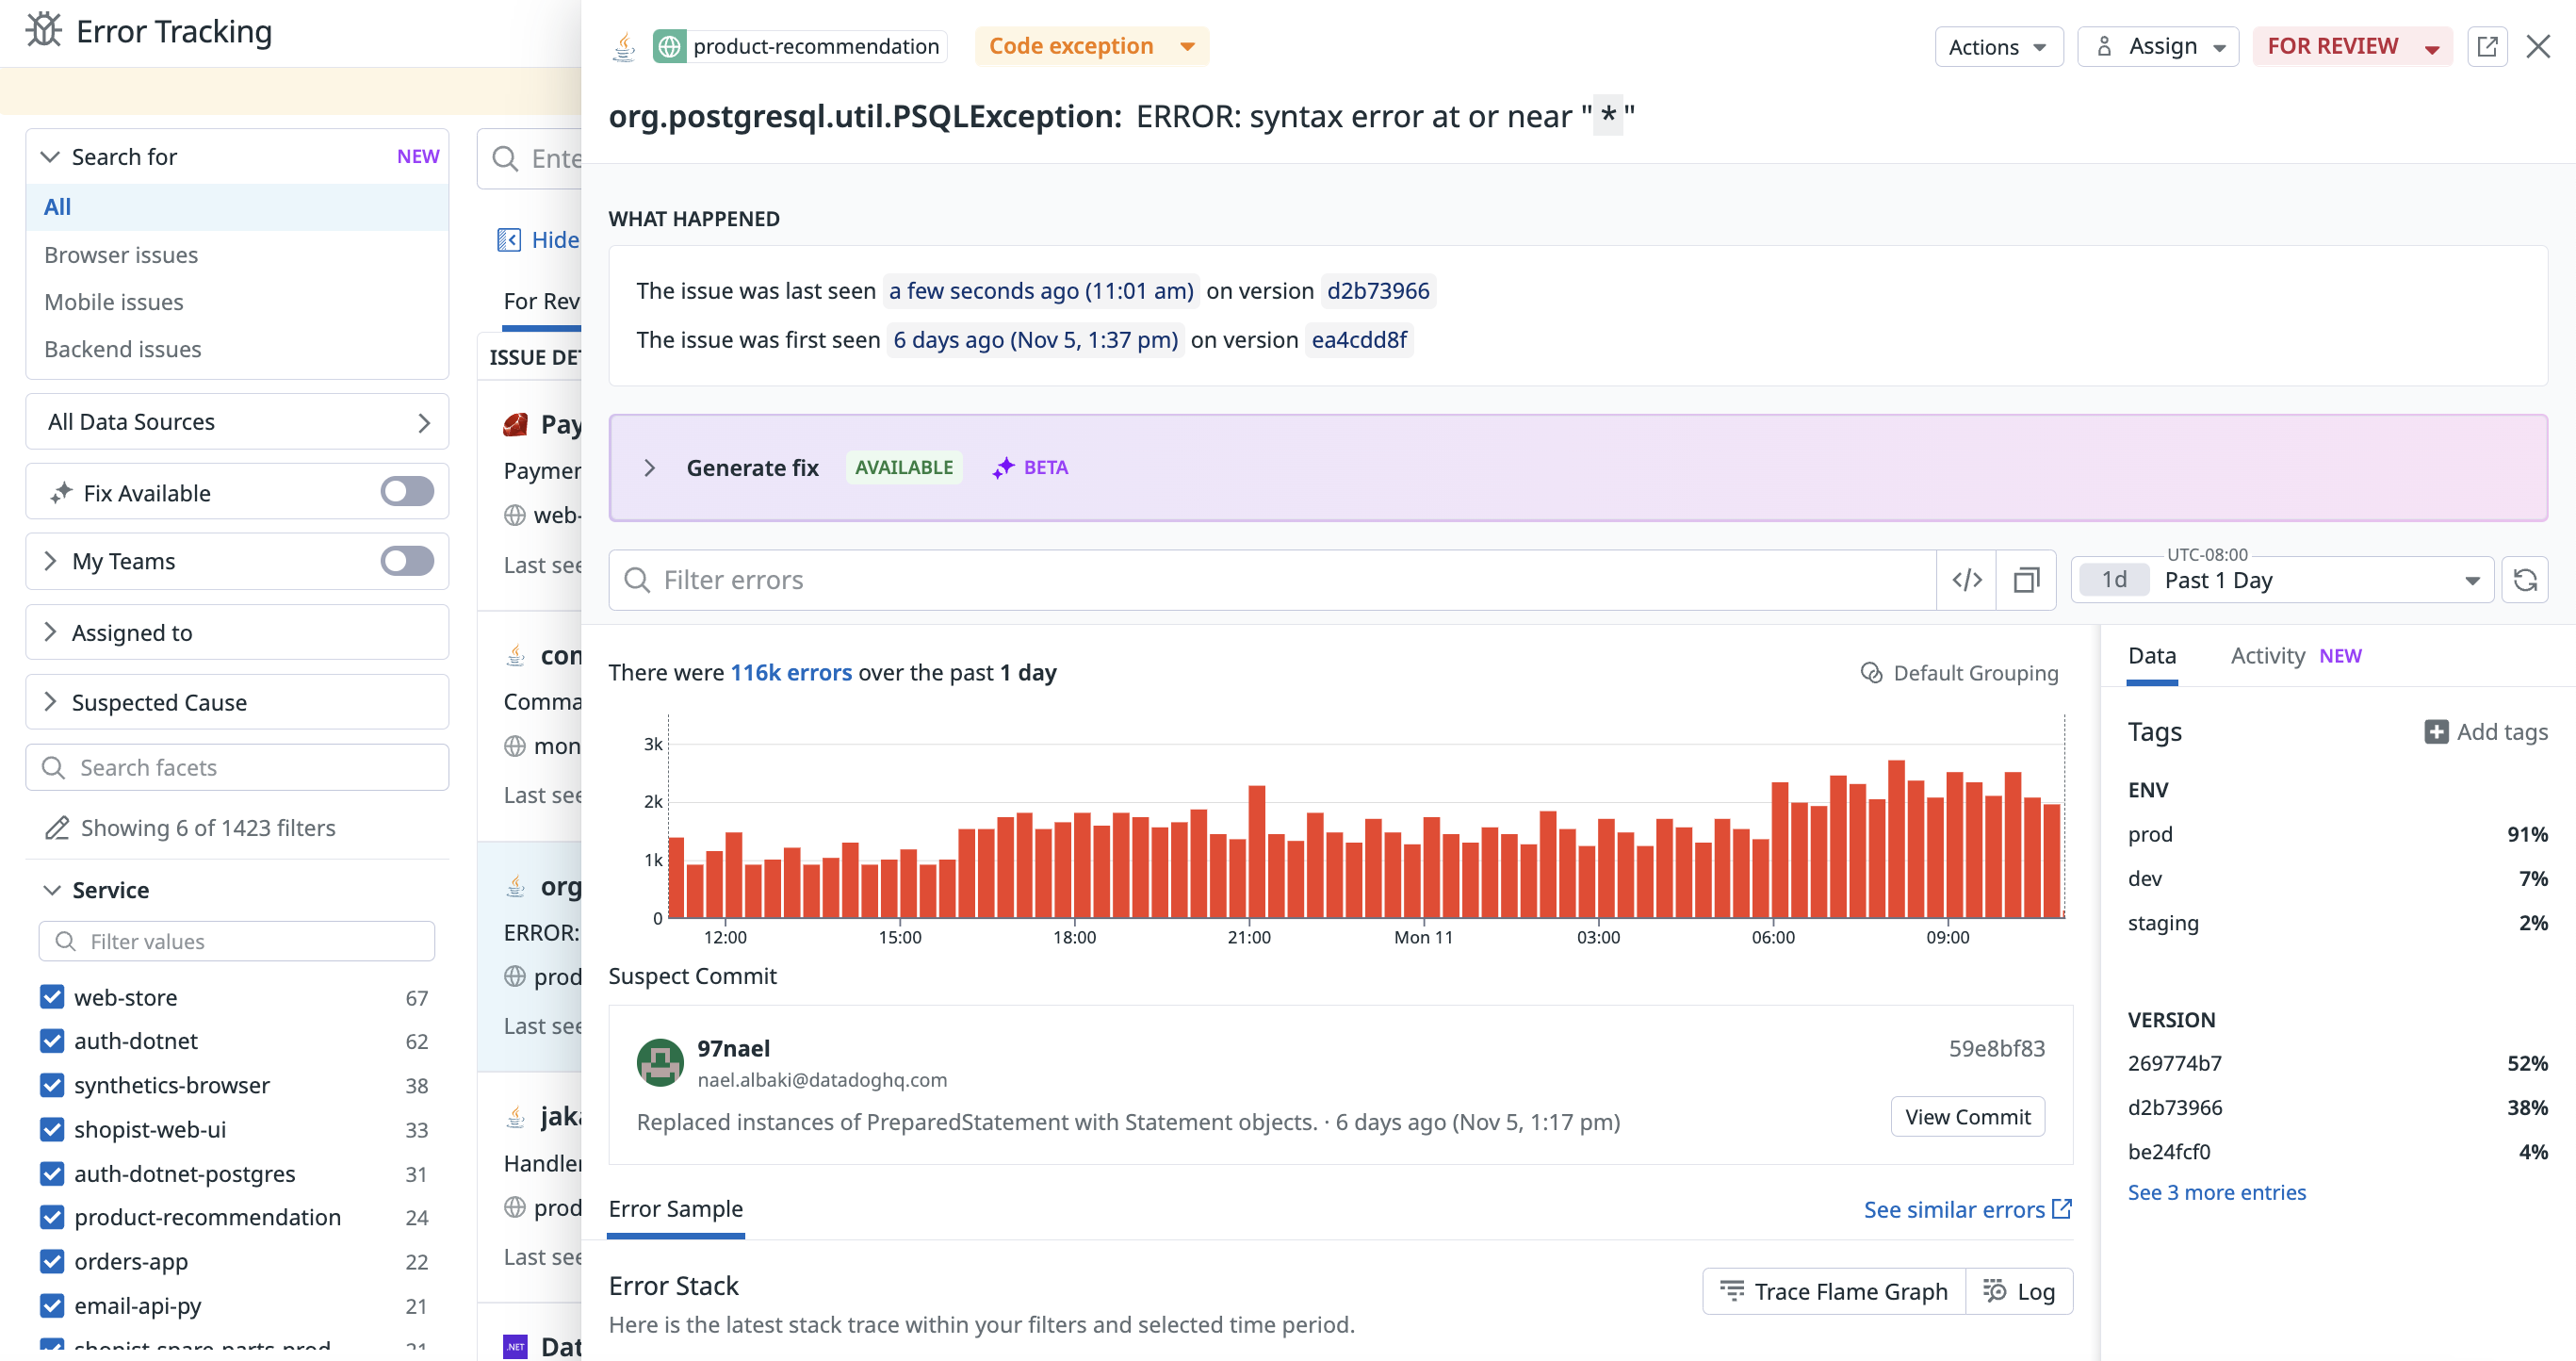
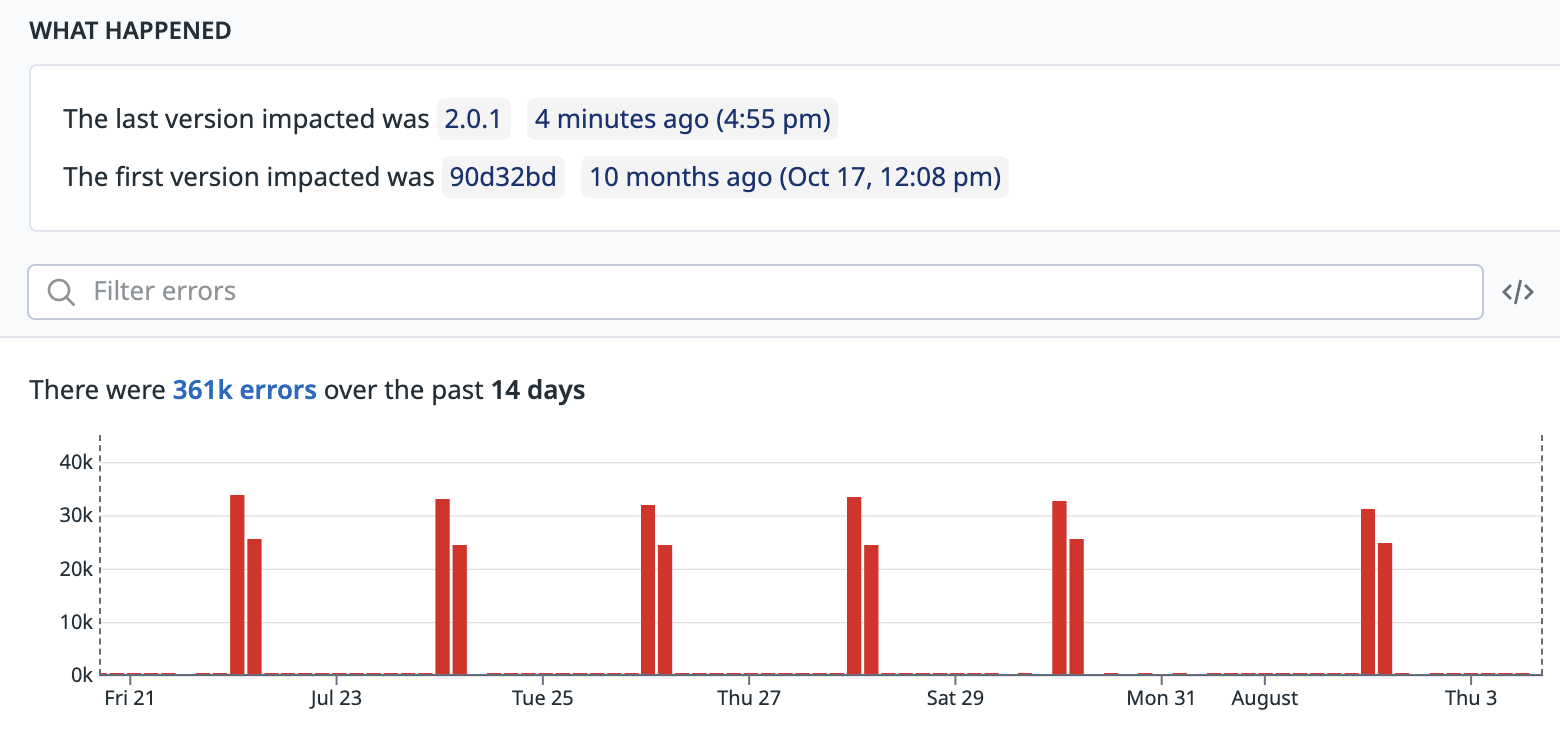
The high-level details you need when troubleshooting an issue can be found in the upper part of the panel. From here, you can understand its lifecycle: first and last occurrence dates, total count, as well as the count over time for the given issue.
The information shown in the issue panel varies depending on the error source. For example, an issue created from APM errors shows the error span tags, such as the resource or operation name, with direct access to the related trace or to logs that are linked to it.
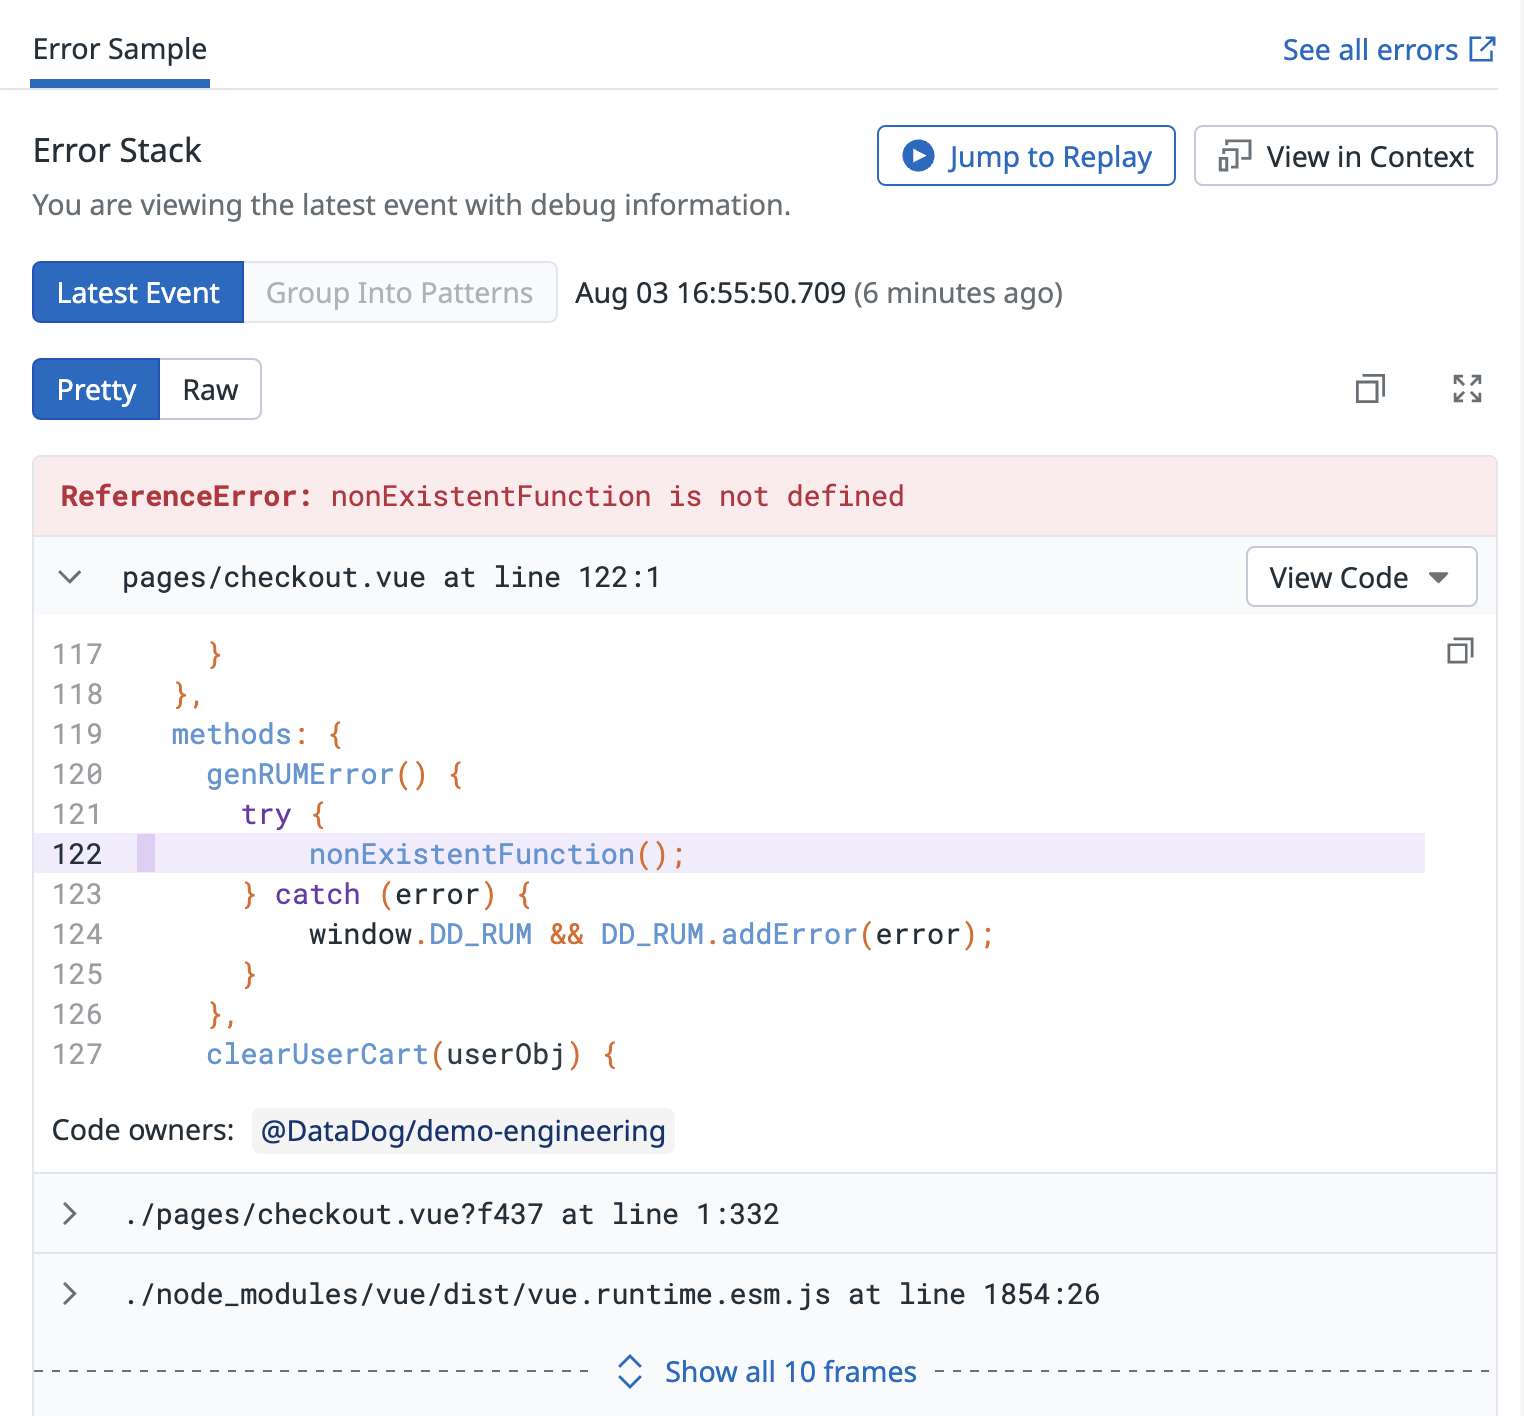
The lower part of the issue panel gives you the ability to navigate error samples from the related issue. Each error sample gives you troubleshooting information such as the stack trace of the error, and the characteristics of impacted users.
Get alerted on new errors
Seeing a new issue as soon as it happens gives you the chance to proactively identify and fix it before it becomes critical. Error Tracking generates a Datadog event whenever an issue is first seen in a given service and environment and, as a result, gives you the ability to be alerted in such cases by configuring Event Monitors.
Each event generated is tagged with the version, the service, and the environment so that you have a fine-grained control over issues you want to be alerted for. You can directly export your search query from the explorer to create an event monitor on the related scope:
Further Reading
Additional helpful documentation, links, and articles:
