- Esenciales
- Empezando
- Datadog
- Sitio web de Datadog
- DevSecOps
- Serverless para Lambda AWS
- Agent
- Integraciones
- Contenedores
- Dashboards
- Monitores
- Logs
- Rastreo de APM
- Generador de perfiles
- Etiquetas (tags)
- API
- Catálogo de servicios
- Session Replay
- Continuous Testing
- Monitorización Synthetic
- Gestión de incidencias
- Monitorización de bases de datos
- Cloud Security Management
- Cloud SIEM
- Application Security Management
- Workflow Automation
- CI Visibility
- Test Visibility
- Intelligent Test Runner
- Análisis de código
- Centro de aprendizaje
- Compatibilidad
- Glosario
- Atributos estándar
- Guías
- Agent
- Uso básico del Agent
- Arquitectura
- IoT
- Plataformas compatibles
- Recopilación de logs
- Configuración
- Configuración remota
- Automatización de flotas
- Actualizar el Agent
- Solucionar problemas
- Detección de nombres de host en contenedores
- Modo de depuración
- Flare del Agent
- Estado del check del Agent
- Problemas de NTP
- Problemas de permisos
- Problemas de integraciones
- Problemas del sitio
- Problemas de Autodiscovery
- Problemas de contenedores de Windows
- Configuración del tiempo de ejecución del Agent
- Consumo elevado de memoria o CPU
- Guías
- Seguridad de datos
- Integraciones
- OpenTelemetry
- Desarrolladores
- Autorización
- DogStatsD
- Checks personalizados
- Integraciones
- Crear una integración basada en el Agent
- Crear una integración API
- Crear un pipeline de logs
- Referencia de activos de integración
- Crear una oferta de mercado
- Crear un cuadro
- Crear un dashboard de integración
- Crear un monitor recomendado
- Crear una regla de detección Cloud SIEM
- OAuth para integraciones
- Instalar la herramienta de desarrollo de integraciones del Agente
- Checks de servicio
- Complementos de IDE
- Comunidad
- Guías
- API
- Aplicación móvil de Datadog
- CoScreen
- Cloudcraft
- En la aplicación
- Dashboards
- Notebooks
- Editor DDSQL
- Hojas
- Monitores y alertas
- Infraestructura
- Métricas
- Watchdog
- Bits AI
- Catálogo de servicios
- Catálogo de APIs
- Error Tracking
- Gestión de servicios
- Objetivos de nivel de servicio (SLOs)
- Gestión de incidentes
- De guardia
- Gestión de eventos
- Gestión de casos
- Workflow Automation
- App Builder
- Infraestructura
- Universal Service Monitoring
- Contenedores
- Serverless
- Monitorización de red
- Coste de la nube
- Rendimiento de las aplicaciones
- APM
- Términos y conceptos de APM
- Instrumentación de aplicación
- Recopilación de métricas de APM
- Configuración de pipelines de trazas
- Correlacionar trazas (traces) y otros datos de telemetría
- Trace Explorer
- Observabilidad del servicio
- Instrumentación dinámica
- Error Tracking
- Seguridad de los datos
- Guías
- Solucionar problemas
- Continuous Profiler
- Database Monitoring
- Gastos generales de integración del Agent
- Arquitecturas de configuración
- Configuración de Postgres
- Configuración de MySQL
- Configuración de SQL Server
- Configuración de Oracle
- Configuración de MongoDB
- Conexión de DBM y trazas
- Datos recopilados
- Explorar hosts de bases de datos
- Explorar métricas de consultas
- Explorar ejemplos de consulta
- Solucionar problemas
- Guías
- Data Streams Monitoring
- Data Jobs Monitoring
- Experiencia digital
- Real User Monitoring
- Monitorización del navegador
- Configuración
- Configuración avanzada
- Datos recopilados
- Monitorización del rendimiento de páginas
- Monitorización de signos vitales de rendimiento
- Monitorización del rendimiento de recursos
- Recopilación de errores del navegador
- Rastrear las acciones de los usuarios
- Señales de frustración
- Error Tracking
- Solucionar problemas
- Monitorización de móviles y TV
- Plataforma
- Session Replay
- Exploración de datos de RUM
- Feature Flag Tracking
- Error Tracking
- Guías
- Seguridad de los datos
- Monitorización del navegador
- Análisis de productos
- Pruebas y monitorización de Synthetics
- Continuous Testing
- Entrega de software
- CI Visibility
- CD Visibility
- Test Visibility
- Configuración
- Tests en contenedores
- Búsqueda y gestión
- Explorador
- Monitores
- Flujos de trabajo de desarrolladores
- Cobertura de código
- Instrumentar tests de navegador con RUM
- Instrumentar tests de Swift con RUM
- Detección temprana de defectos
- Reintentos automáticos de tests
- Correlacionar logs y tests
- Guías
- Solucionar problemas
- Intelligent Test Runner
- Code Analysis
- Quality Gates
- Métricas de DORA
- Seguridad
- Información general de seguridad
- Cloud SIEM
- Cloud Security Management
- Application Security Management
- Observabilidad de la IA
- Log Management
- Observability Pipelines
- Gestión de logs
- Administración
- Gestión de cuentas
- Seguridad de los datos
- Sensitive Data Scanner
- Ayuda
Profile Visualizations
This page is not yet available in Spanish. We are working on its translation.
If you have any questions or feedback about our current translation project, feel free to reach out to us!
If you have any questions or feedback about our current translation project, feel free to reach out to us!
Search profiles
Go to APM -> Profiles and select a service to view its profiles. Select a profile type to view different resources (for example, CPU, Memory, Exception, and I/O).
You can filter according to infrastructure tags or application tags set up from your environment tracing configuration. By default the following facets are available:
| Facet | Definition |
|---|---|
| Env | The environment your application is running on (production, staging). |
| Service | The name of the service your code is running. |
| Version | The version of your code. |
| Host | The hostname your profiled process is running on. |
| Runtime | The type of runtime the profiled process is running (JVM, CPython). |
The following measures are available:
| Measure | Definition |
|---|---|
| CPU | CPU usage, measured in cores. |
| Memory Allocation | Memory allocation rate over the course of the profile. This value can be above the amount of memory on your system because allocated memory can be garbage collected during the profile. |
| Wall time | The elapsed time used by the code. Elapsed time includes time when code is running on CPU, waiting for I/O, and anything else that happens while it is running. |
For each runtime, there is also a broader set of metrics available, which you can see listed by timeseries.
Profile types
In the Profiles tab, you can see all profile types available for a given language. Depending on the language, the information collected about your profile differs. See Profile types for a list of profile types available for each language.
Visualizations
Flame graph
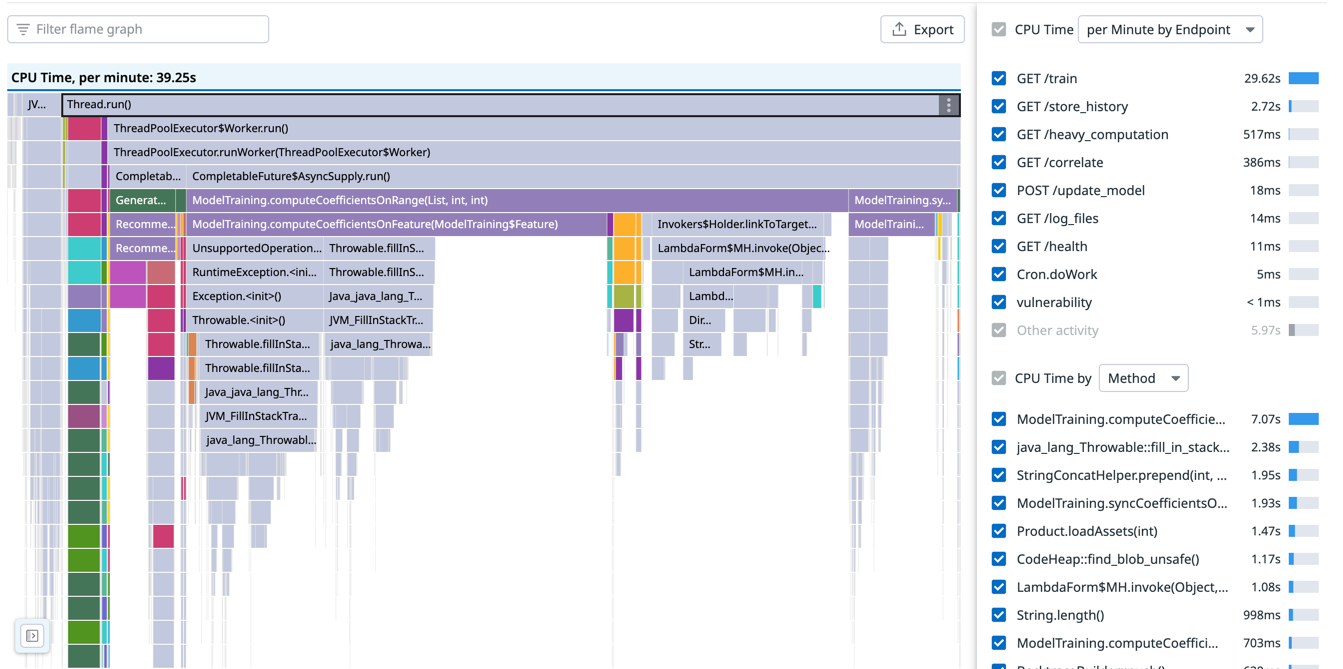
The flame graph is the default visualization for Continuous Profiler. It shows how much CPU each method used (since this is a CPU profile) and how each method was called.
For example, starting from the first row in the previous image, Thread.run() called ThreadPoolExecutor$Worker.run(), which called ThreadPoolExecutor.runWorker(ThreadPoolExecutor$Worker), and so on.
The width of a frame represents how much of the total CPU it consumed. On the right, you can see a CPU time by Method top list that only accounts for self time, which is the time a method spent on CPU without calling another method.
Flame graphs can be be included in Dashboards and Notebooks with the Profiling Flame Graph Widget.
Single profile
By default, profiles are uploaded once a minute. Depending on the language, these processes are profiled between 15s and 60s.
To view a specific profile, set the Visualize as option to Profile List and click an item in the list:
The header contains information associated with your profile, like the service that generated it, or the environment and code version associated to it.
Four tabs are below the profile header:
| Tab | Definition |
|---|---|
| Profiles | A flame graph and summary table of the profile you are looking at. You can switch between profile types (for example, CPU, Memory allocation). |
| Analysis | A set of heuristics that suggest potential issues or areas of improvement in your code. Only available for Java. |
| Metrics | Profiler metrics coming from all profiles of the same service. |
| Runtime Info | Runtime properties in supported languages, and profile tags. |
Note: In the upper right corner of each profile, there are options to:
- Compare this profile with others
- View repository commit
- View traces for the same process and time frame
- Download the profile
- Open the profile in full page
Timeline view
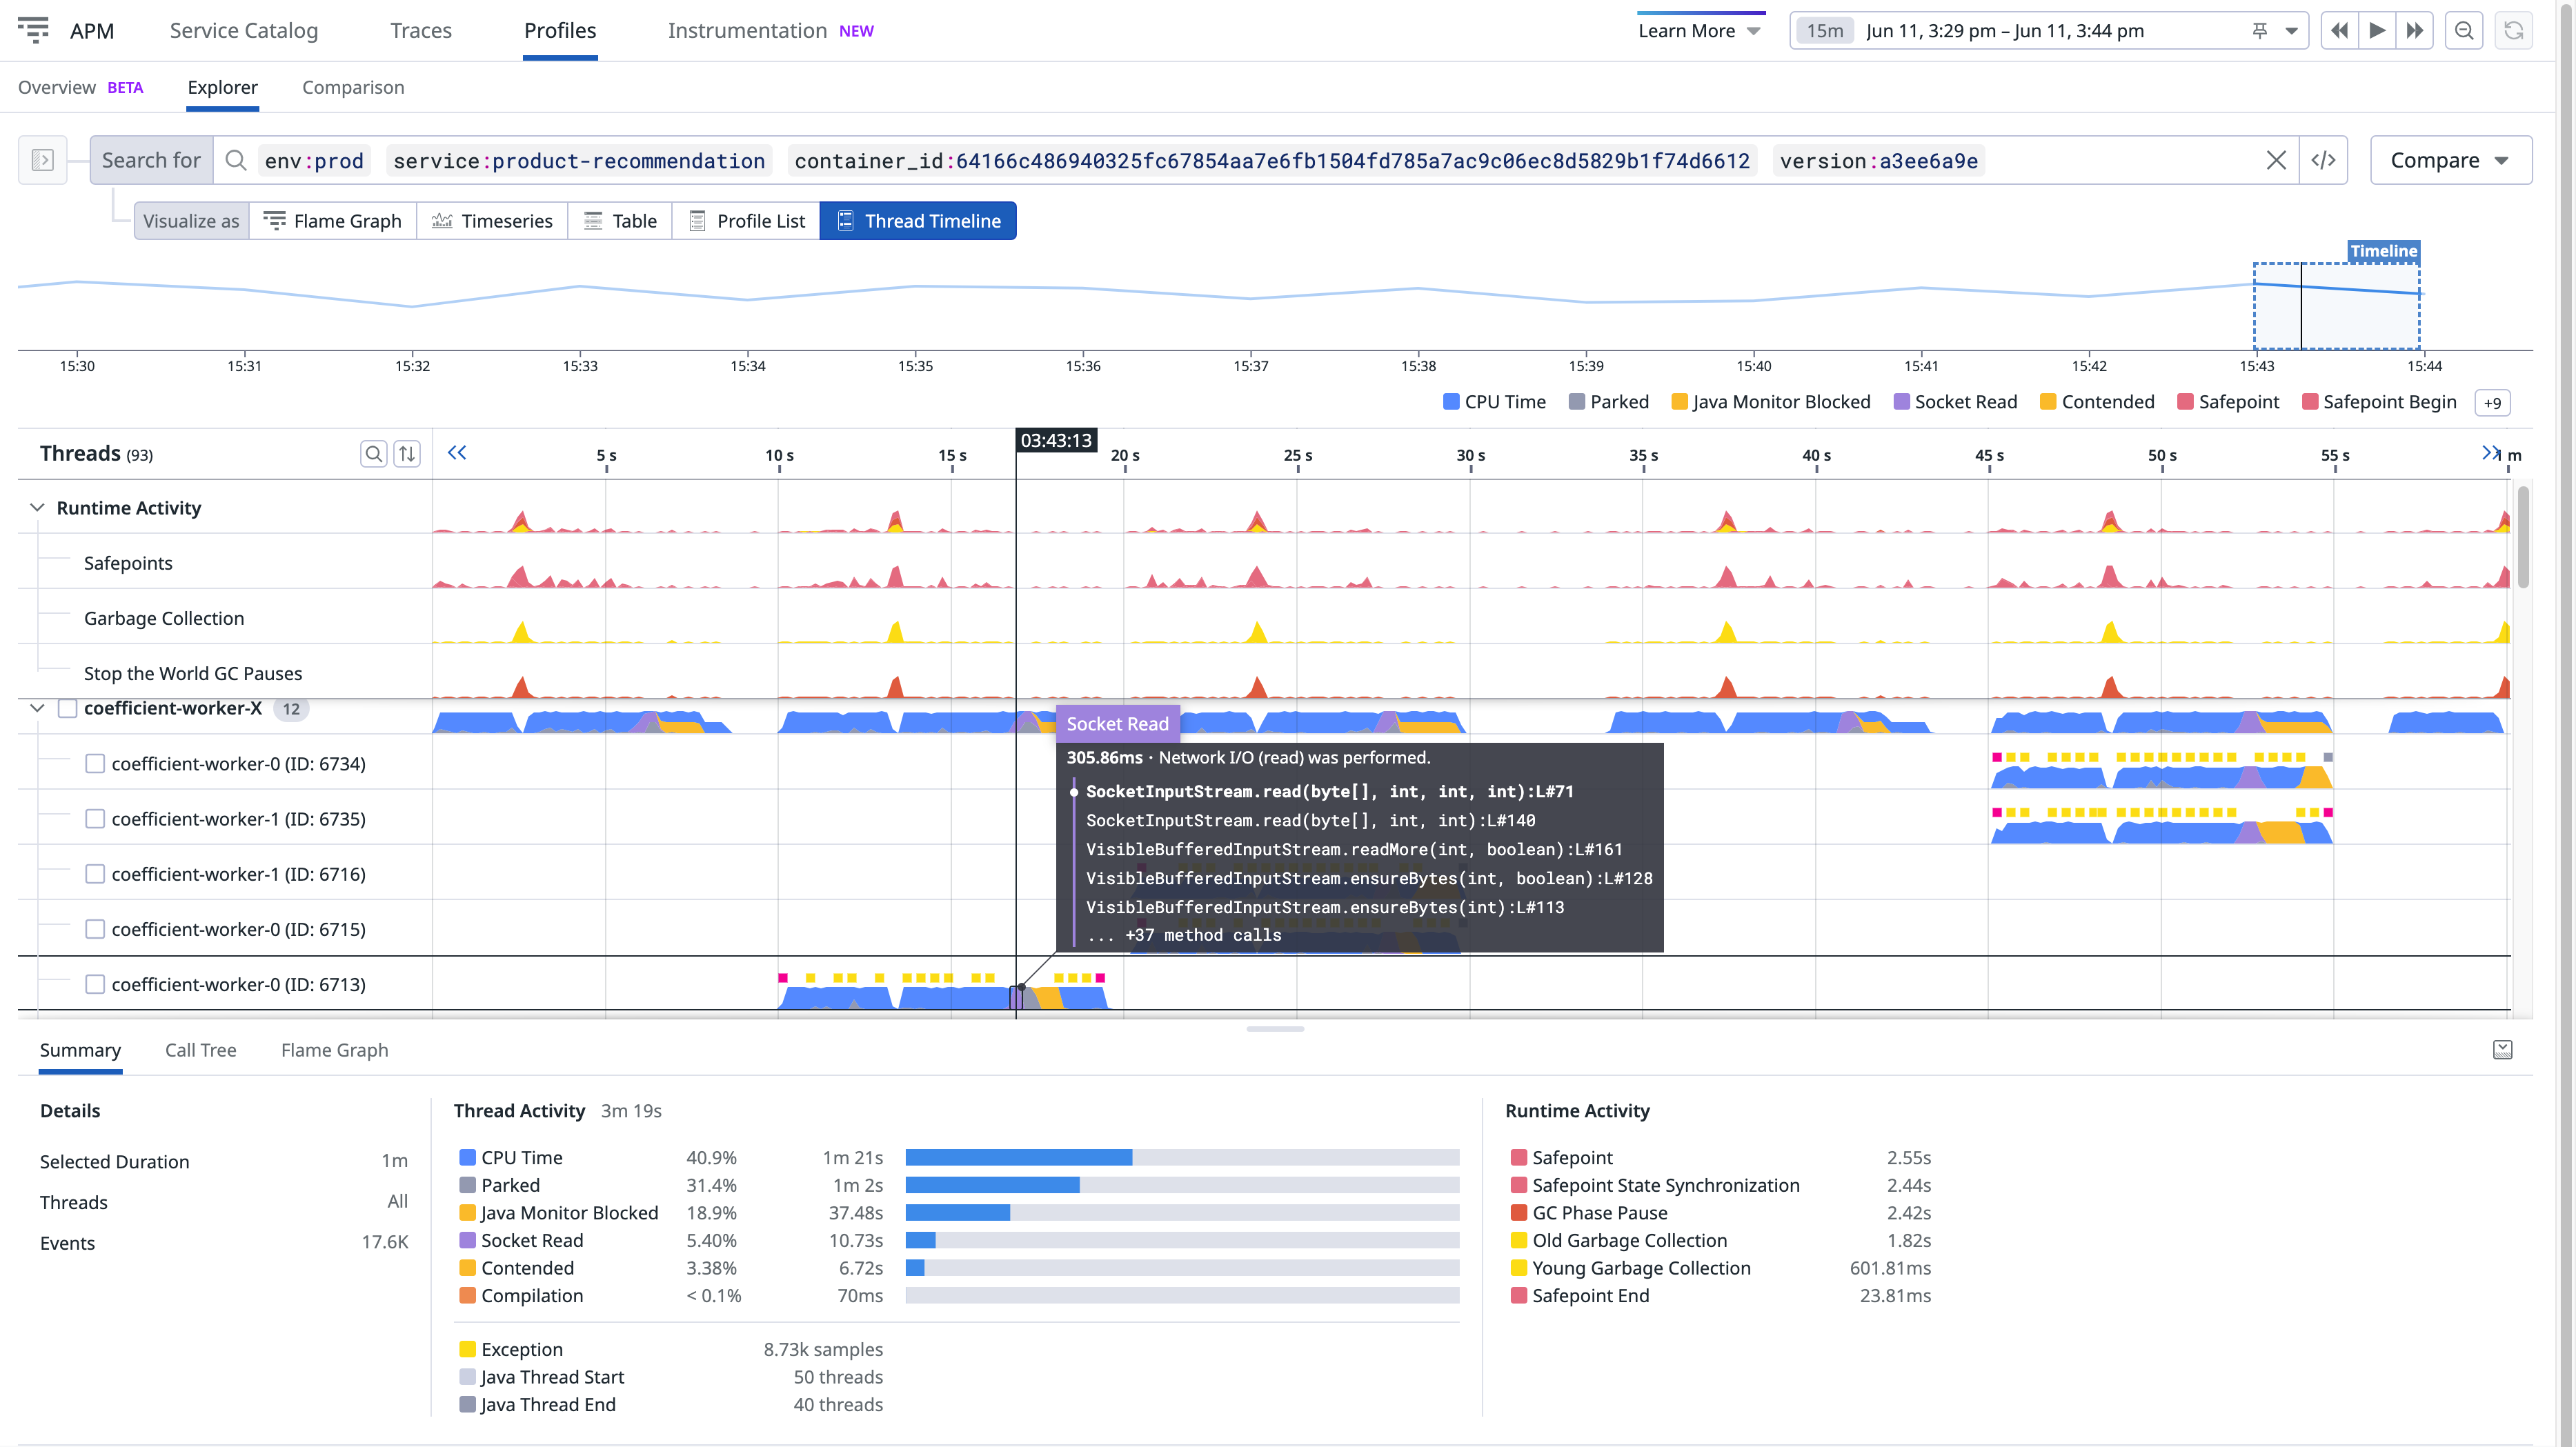
The timeline view is equivalent to the flame graph, with time-based patterns and work distribution over the period of a single profile, a single process in profiling explorer and a trace.
Compared to the flame graph, the timeline view can help you:
- Isolate spiky methods
- Sort out complex interactions between threads
- Surface runtime activity that impacted the process
To access the timeline view:
- Go to APM > Profiles > Explorer.
- Set the Visualize as option to Thread Timeline.
Depending on the runtime and language, the timeline lanes vary:
Each lane represents a thread. Threads from a common pool are grouped together. You can expand the pool to view details for each thread.
Lanes on top are runtime activities that may impact performance.
For additional information about debugging slow p95 requests or timeouts using the timeline, see the blog post Understanding Request Latency with Profiling.
See prerequisites to learn how to enable this feature for Python.
Each lane represents a thread. Threads from a common pool are grouped together. You can expand the pool to view details for each thread.
See prerequisites to learn how to enable this feature for Go.
Each lane represents a goroutine. Goroutines created by the same go statement are grouped together. You can expand the group to view details for each goroutine.
Lanes on top are runtime activities that may impact performance.
For additional information about debugging slow p95 requests or timeouts using the timeline, see the blog post Debug Go Request Latency with Datadog’s Profiling Timeline.
See prerequisites to learn how to enable this feature for Ruby.
Each lane represents a thread. Threads from a common pool are grouped together. You can expand the pool to view details for each thread.
The thread ID is shown as native-thread-id (ruby-object-id) where the native thread ID is Thread#native_thread_id (when available) and the Ruby object ID is Thread#object_id.
Note: The Ruby VM or your operating system might reuse native thread IDs.
See prerequisites to learn how to enable this feature for Node.js.
There is one lane for the JavaScript thread.
There can also be lanes visualizing various kinds of asynchronous activity consisting of DNS requests and TCP connect operations. The number of lanes matches the maximum concurrency of these activities so they can be visualized without overlaps.
Lanes on the top are garbage collector runtime activities that may add extra latency to your request.
Each lane represents a thread. Threads from a common pool are grouped together. You can expand the pool to view details for each thread.
Lanes on top are runtime activities that may impact performance.
The thread ID is shown as <unique-id> [#OS-thread-id].
Note: Your operating system might reuse thread IDs.
See prerequisites to learn how to enable this feature for PHP.
There is one lane for each PHP thread (in PHP NTS, this is only one lane as there is only one thread per process). Fibers that run in this thread are represented in the same lane.
Lanes on the top are runtime activities that may add extra latency to your request, due to file compilation and garbage collection.


