- Principales informations
- Getting Started
- Datadog
- Site Datadog
- DevSecOps
- Serverless for AWS Lambda
- Agent
- Intégrations
- Conteneurs
- Dashboards
- Monitors
- Logs
- Tracing
- Profileur
- Tags
- API
- Service Catalog
- Session Replay
- Continuous Testing
- Surveillance Synthetic
- Incident Management
- Database Monitoring
- Cloud Security Management
- Cloud SIEM
- Application Security Management
- Workflow Automation
- CI Visibility
- Test Visibility
- Intelligent Test Runner
- Code Analysis
- Learning Center
- Support
- Glossary
- Standard Attributes
- Guides
- Agent
- Intégrations
- OpenTelemetry
- Développeurs
- Authorization
- DogStatsD
- Checks custom
- Intégrations
- Create an Agent-based Integration
- Create an API Integration
- Create a Log Pipeline
- Integration Assets Reference
- Build a Marketplace Offering
- Create a Tile
- Create an Integration Dashboard
- Create a Recommended Monitor
- Create a Cloud SIEM Detection Rule
- OAuth for Integrations
- Install Agent Integration Developer Tool
- Checks de service
- IDE Plugins
- Communauté
- Guides
- API
- Application mobile
- CoScreen
- Cloudcraft
- In The App
- Dashboards
- Notebooks
- DDSQL Editor
- Alertes
- Infrastructure
- Métriques
- Watchdog
- Bits AI
- Service Catalog
- API Catalog
- Error Tracking
- Service Management
- Infrastructure
- Universal Service Monitoring
- Conteneurs
- Sans serveur
- Surveillance réseau
- Cloud Cost
- Application Performance
- APM
- Profileur en continu
- Database Monitoring
- Agent Integration Overhead
- Setup Architectures
- Configuration de Postgres
- Configuration de MySQL
- Configuration de SQL Server
- Setting Up Oracle
- Setting Up MongoDB
- Connecting DBM and Traces
- Données collectées
- Exploring Database Hosts
- Explorer les métriques de requête
- Explorer des échantillons de requêtes
- Dépannage
- Guides
- Data Streams Monitoring
- Data Jobs Monitoring
- Digital Experience
- RUM et Session Replay
- Product Analytics
- Surveillance Synthetic
- Continuous Testing
- Software Delivery
- CI Visibility
- CD Visibility
- Test Visibility
- Exécuteur de tests intelligent
- Code Analysis
- Quality Gates
- DORA Metrics
- Securité
- Security Overview
- Cloud SIEM
- Cloud Security Management
- Application Security Management
- AI Observability
- Log Management
- Pipelines d'observabilité
- Log Management
- Administration
Continuous Integration Visibility Explorer
Cette page n'est pas encore disponible en français, sa traduction est en cours.
Si vous avez des questions ou des retours sur notre projet de traduction actuel, n'hésitez pas à nous contacter.
Si vous avez des questions ou des retours sur notre projet de traduction actuel, n'hésitez pas à nous contacter.
Overview
The CI Visibility Explorer allows you to search and filter, visualize, and export pipeline executions at multiple levels using any tag.
Navigate to Software Delivery > CI Visibility > Executions to see your CI pipeline execution results across the following levels: Pipeline, Stage, Job, Step, and Command.
Default CI facets
The CI panel on the left lists default facets you can use to search for your pipeline executions.
| Facet | Description |
|---|---|
| CI Status | The status of the CI execution: Success , Failure, or Canceled. |
| CI Instance | The instance name of the CI provider. |
| Duration | Length of time for the pipeline to execute. |
| Pipeline ID | The ID of the pipeline. |
| CI Provider | The name of the CI provider. |
| Node Labels | The labels of the node. |
| Node Name | The name of the node. |
| Partial Pipeline | Refers to CI pipeline executions that include retries, manual approvals, or other incomplete sequences. |
| Partial Retry | Indicates whether the CI execution was a retry of a previous execution. |
| Manually Triggered | Indicates whether the CI execution was manually triggered. |
| Parameters | The user-defined parameters when a pipeline or job triggers. |
| Pipeline Number | The number of the pipeline. |
| Pipeline URL | The URL of the pipeline. |
| Queue Time | The total duration a job or task spent waiting in the CI queue before execution. |
| Deployment | The GitLab environment deployed with a CI pipeline. |
| Deployment Action | The action taken within GitLab’s deployed environment. |
| Command Name | The user-defined identifier for a specific command within the CI pipeline. |
| Command | The command line that was run to generate the custom pipeline span. |
| Downstream Pipeline | Indicates if this pipeline is downstream of another pipeline. |
| Upstream Pipeline ID | Identifier for the pipeline execution that precedes and triggers the current pipeline. |
| Step Name | The name assigned to a specific step within a CI pipeline. |
| Error Domain | The type of error for a CI execution such as a provider, user, or unknown. |
| Run time | The total duration spent executing the CI pipeline. |
| Wait time | The total time spent waiting for manual approval within a CI execution. |
| Is Deployment | Indicates whether a job within the pipeline initiated a deployment. |
| Contains Deployment | Indicates whether the pipeline includes any jobs that trigger a deployment. |
| On Critical Path | Indicates whether the job is on the critical path of the CI pipeline execution. |
For more information about common facets that you can use as part of your search query in the CI Visibility Explorer, see Pipeline Execution Facets.
Pipeline executions details and traces
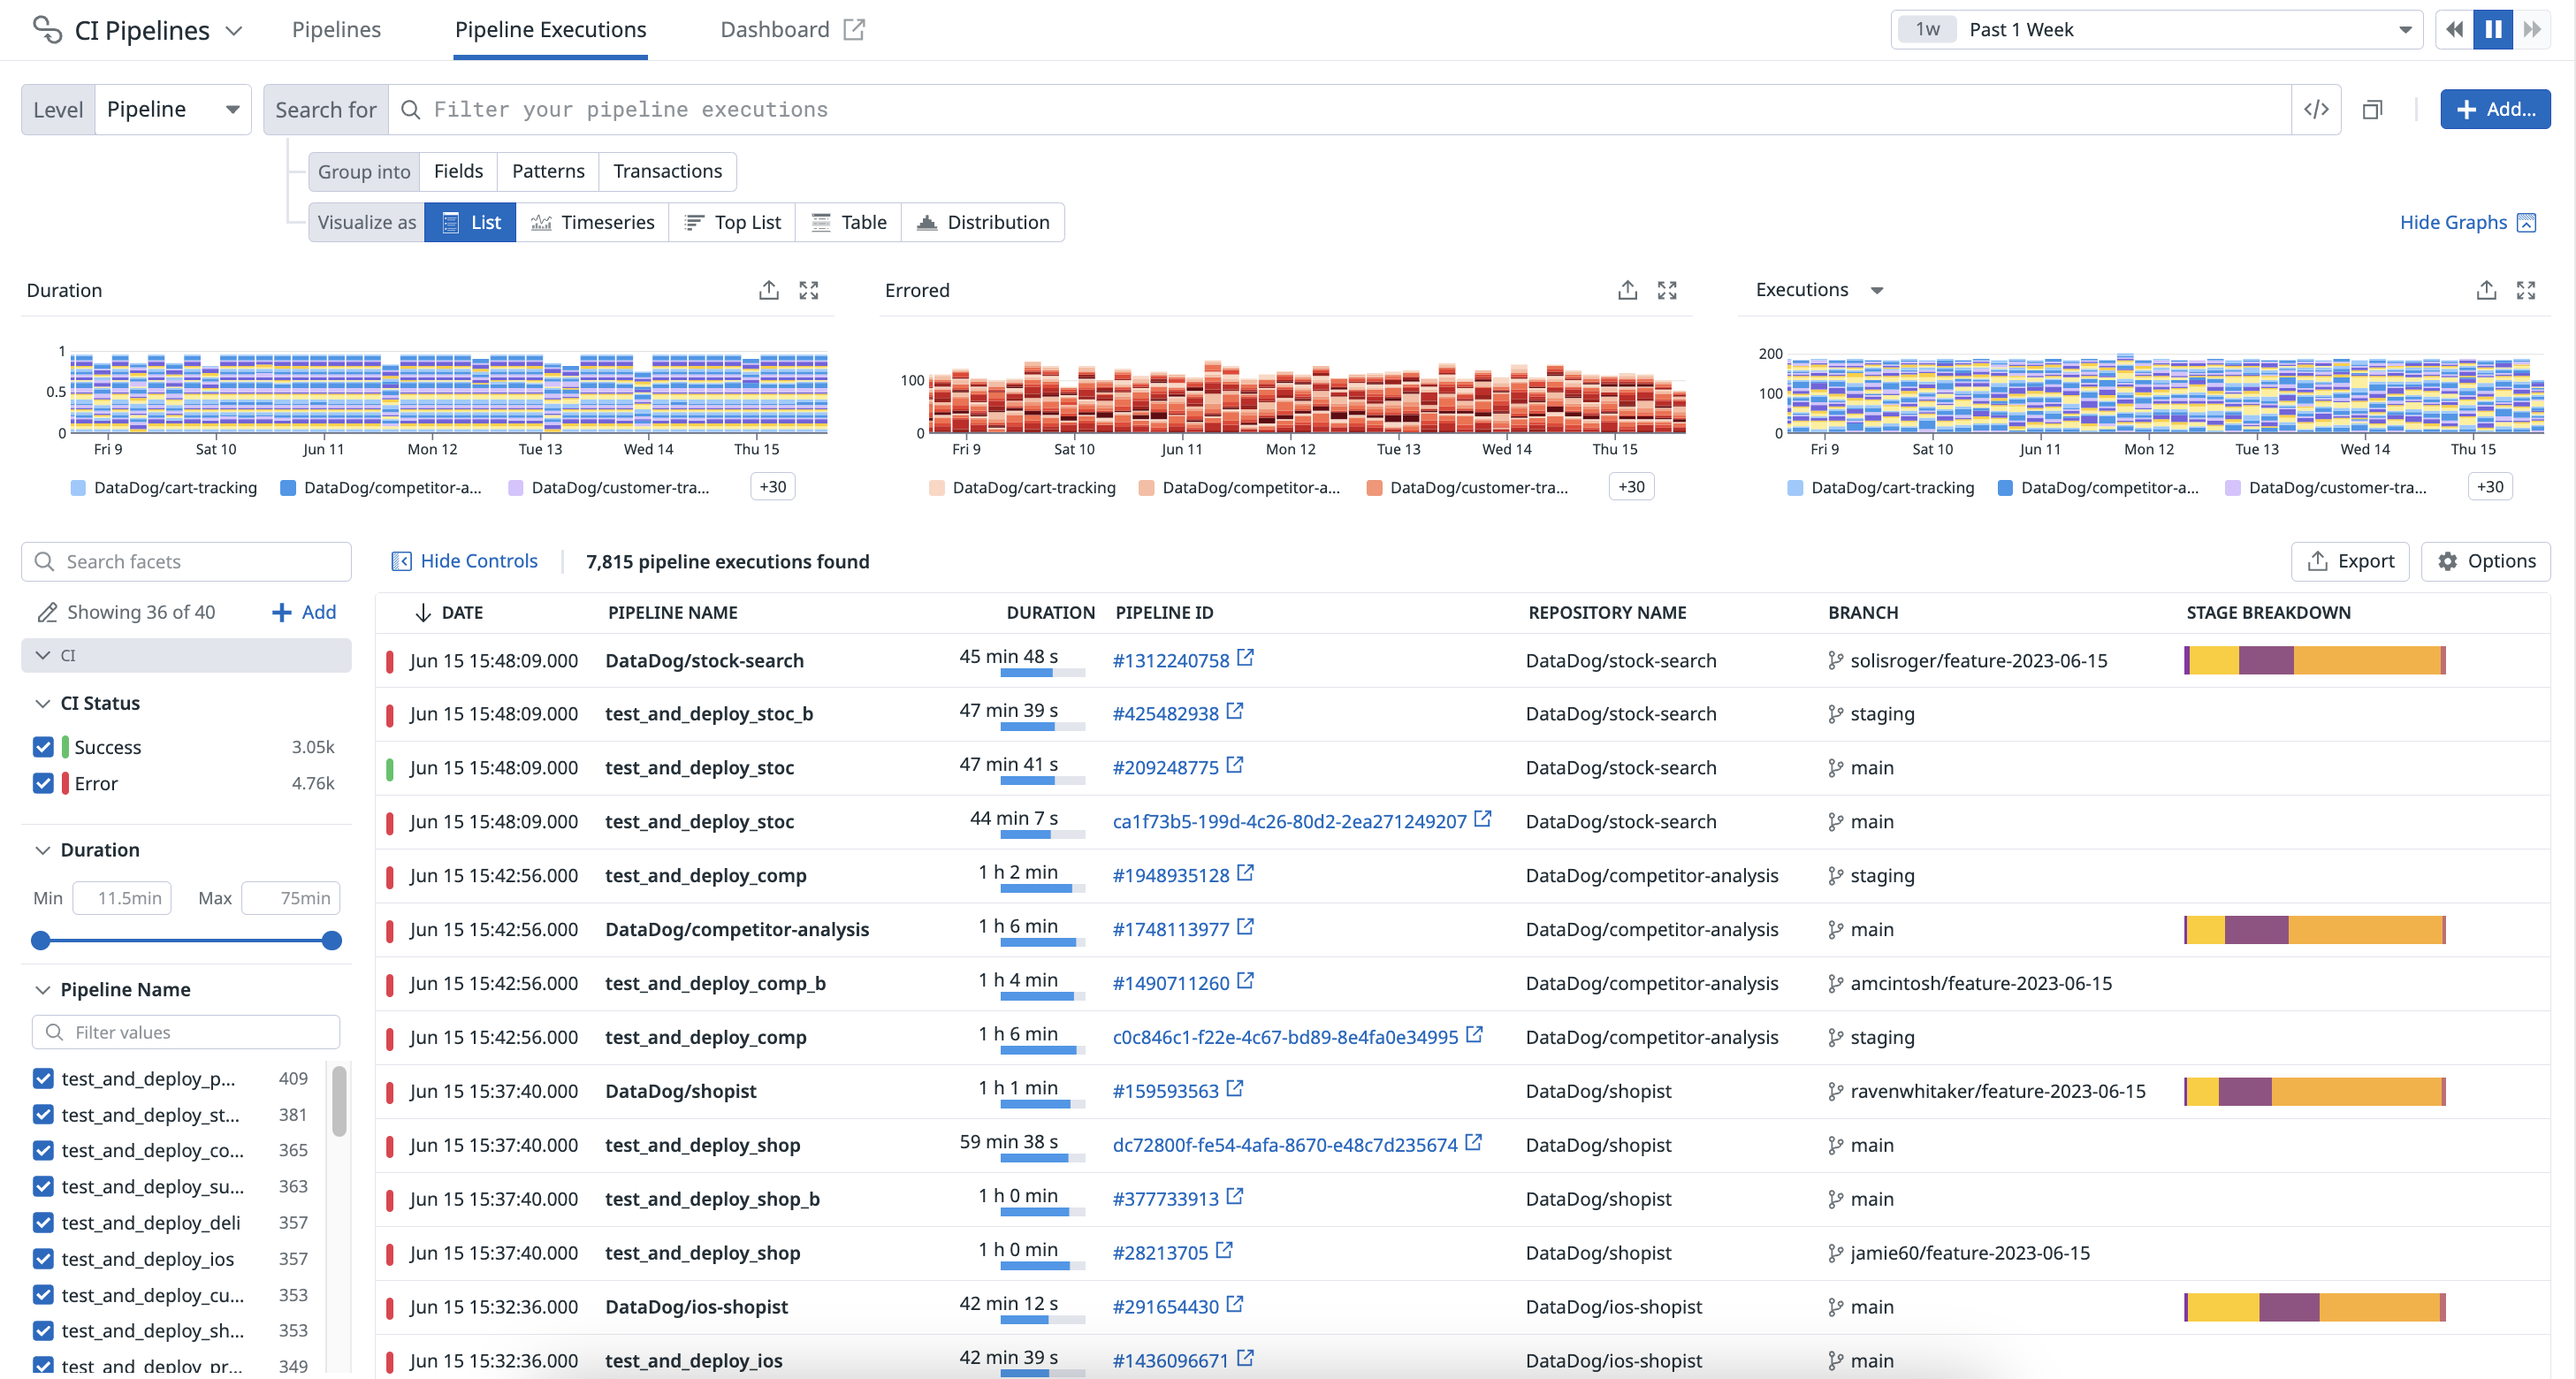
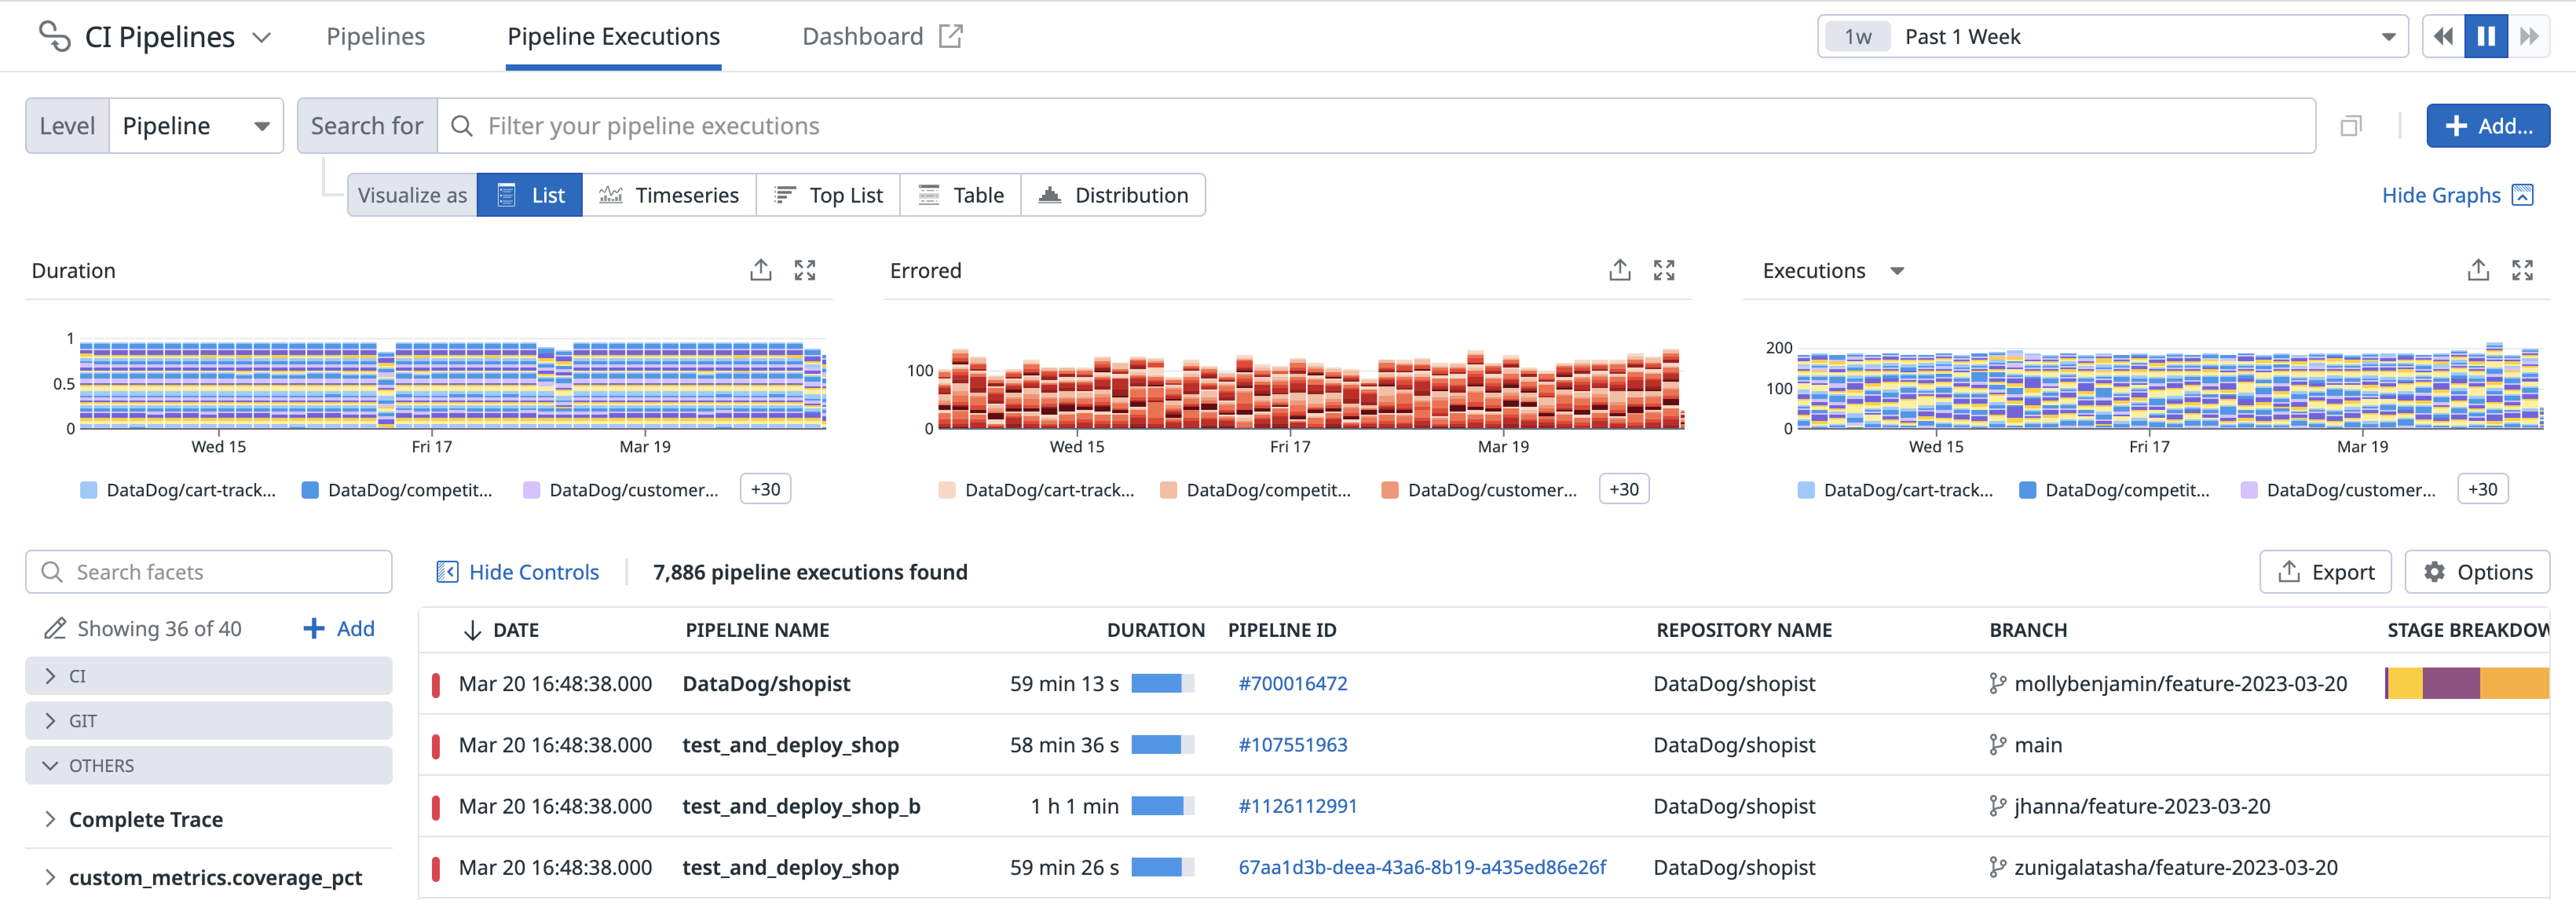
You can see aggregated data about pipeline executions over the selected time frame. Use the search field and facets to scope the list down to the executions you want to investigate. Change the list to show pipelines, stages, or jobs using the buttons at the top.
Below are three graphs that visualize the durations of your most active pipelines, your failed pipelines over time, and the executions of your pipelines with an option to toggle to accumulated duration, respectively. These graphs are scoped to the level chosen at the top left (Pipeline, Stage, Job, and more.)
Each pipeline execution is reported as a trace, which includes stage and job information. Access individual pipeline, stage, and job execution traces by clicking on an execution in the list (similar to clicking into a pipeline execution from the Pipeline Details view).
CI pipeline data is available in dashboards and notebooks, enabling build engineering teams to customize their communication about high-priority work and CI trends over time.
Search and filter
You can narrow down, broaden, or shift your focus on a subset of pipeline executions by clicking on the facets to the left or writing your own custom query in the search bar. When you select and deselect facets, the search bar automatically reflects your changes. Similarly, you can modify the search bar query or write a query from scratch in the search bar to select and deselect the facets on the left.
- To learn how to search for pipelines, see Search and Manage.
- To learn how to create queries, see Search Syntax.
Analyze
Group your queried pipeline executions into higher-level entities such as fields, patterns, and transactions in order to derive or consolidate information. By using facets, which you do not need to create to search for attributes, you can accomplish the following actions:
- Search and keep track of the progress of tests running in a CI/CD pipeline.
- Investigate every CI/CD job execution to identify and troubleshoot failing test runs.
Visualize
Select a visualization type to visualize the outcomes of your filters and aggregations and better understand your pipeline executions. For example, you can view your pipeline executions in a list to organize your pipeline data into columns, or in a timeseries graph to measure your pipeline data over time.
Export
Export your view in the CI Visibility Explorer to reuse it later or in different contexts.
Further reading
Documentation, liens et articles supplémentaires utiles:


