- Essentials
- Getting Started
- Datadog
- Datadog Site
- DevSecOps
- Serverless for AWS Lambda
- Agent
- Integrations
- Containers
- Dashboards
- Monitors
- Logs
- APM Tracing
- Profiler
- Tags
- API
- Service Catalog
- Session Replay
- Continuous Testing
- Synthetic Monitoring
- Incident Management
- Database Monitoring
- Cloud Security Management
- Cloud SIEM
- Application Security Management
- Workflow Automation
- CI Visibility
- Test Visibility
- Test Impact Analysis
- Code Analysis
- Learning Center
- Support
- Glossary
- Standard Attributes
- Guides
- Agent
- Integrations
- OpenTelemetry
- Developers
- Authorization
- DogStatsD
- Custom Checks
- Integrations
- Create an Agent-based Integration
- Create an API Integration
- Create a Log Pipeline
- Integration Assets Reference
- Build a Marketplace Offering
- Create a Tile
- Create an Integration Dashboard
- Create a Recommended Monitor
- Create a Cloud SIEM Detection Rule
- OAuth for Integrations
- Install Agent Integration Developer Tool
- Service Checks
- IDE Plugins
- Community
- Guides
- Administrator's Guide
- API
- Datadog Mobile App
- CoScreen
- Cloudcraft
- In The App
- Dashboards
- Notebooks
- DDSQL Editor
- Sheets
- Monitors and Alerting
- Infrastructure
- Metrics
- Watchdog
- Bits AI
- Service Catalog
- API Catalog
- Error Tracking
- Service Management
- Infrastructure
- Application Performance
- APM
- Continuous Profiler
- Database Monitoring
- Data Streams Monitoring
- Data Jobs Monitoring
- Digital Experience
- Real User Monitoring
- Product Analytics
- Synthetic Testing and Monitoring
- Continuous Testing
- Software Delivery
- CI Visibility
- CD Visibility
- Test Optimization
- Code Analysis
- Quality Gates
- DORA Metrics
- Security
- Security Overview
- Cloud SIEM
- Cloud Security Management
- Application Security Management
- AI Observability
- Log Management
- Observability Pipelines
- Log Management
- Administration
Heatmaps
All features in Product Analytics are in limited availability. To request access, complete the form.
Request AccessA heatmap (or heat map) is a visualization of your user’s interactions overlaid on Session Replay data. Product Analytics has three different types of heatmaps:
- Click maps: View user interactions (clicks) to understand how users engage with your page
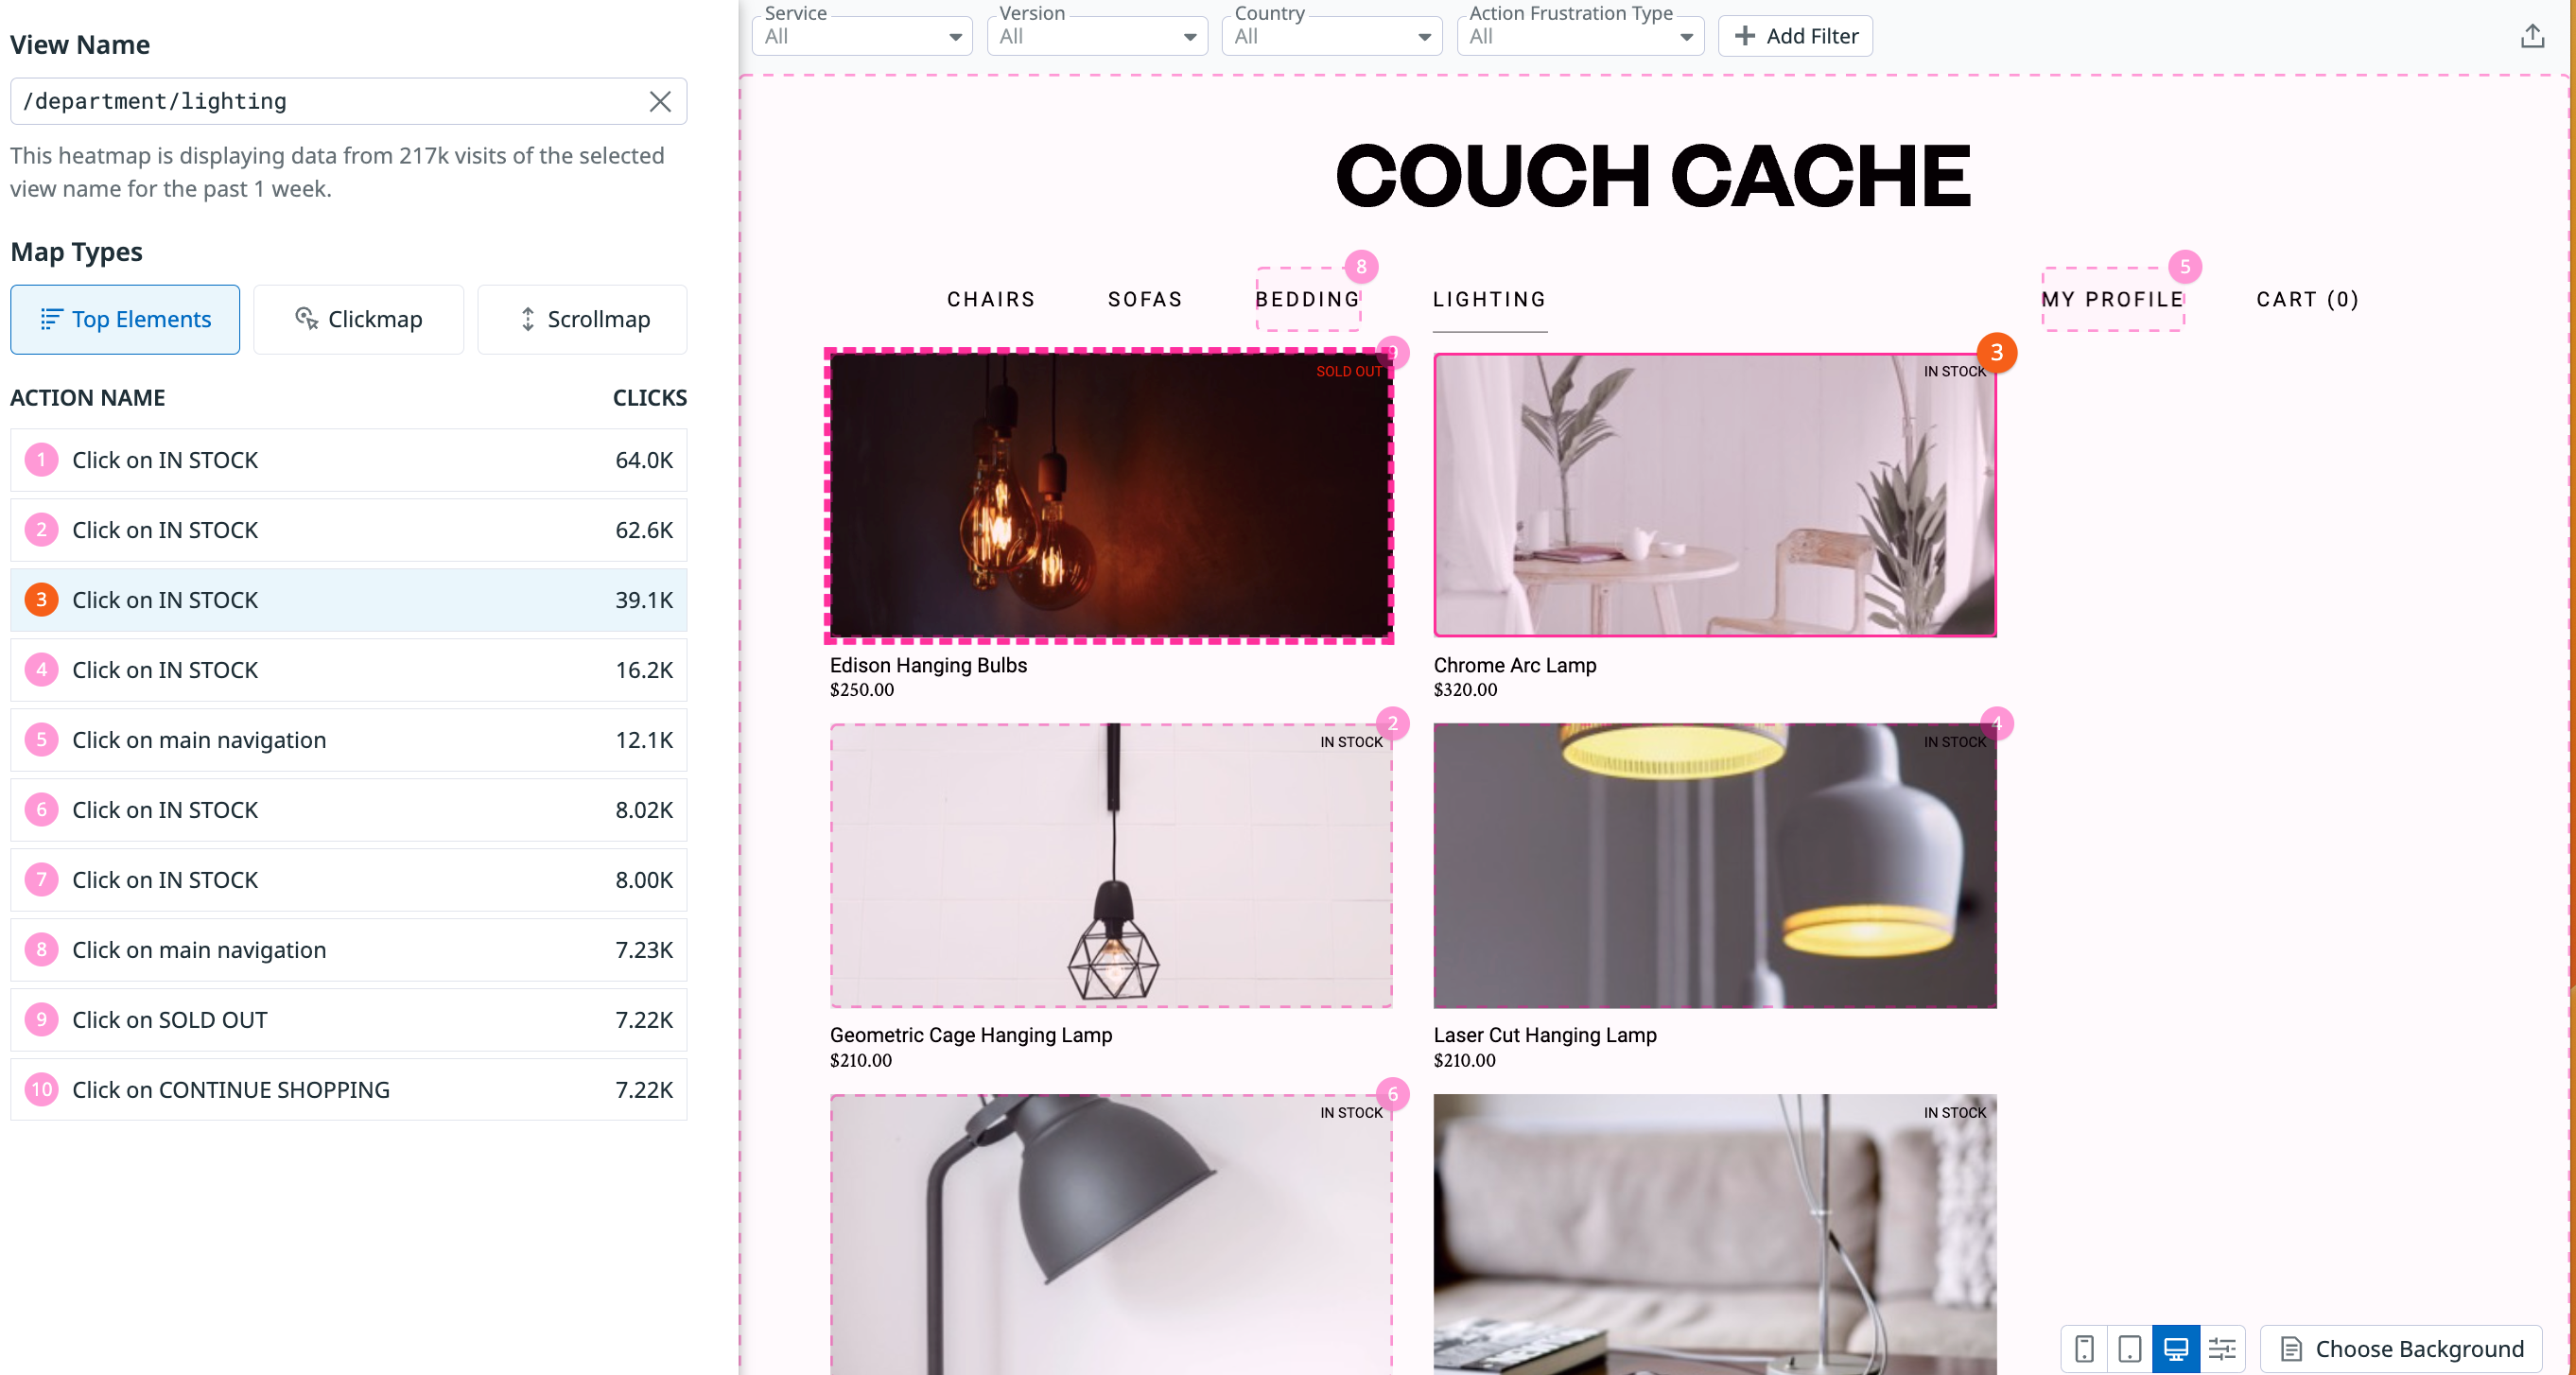
- Top Elements: View a ranking of up to the top 10 most interacted-with elements on a given page.
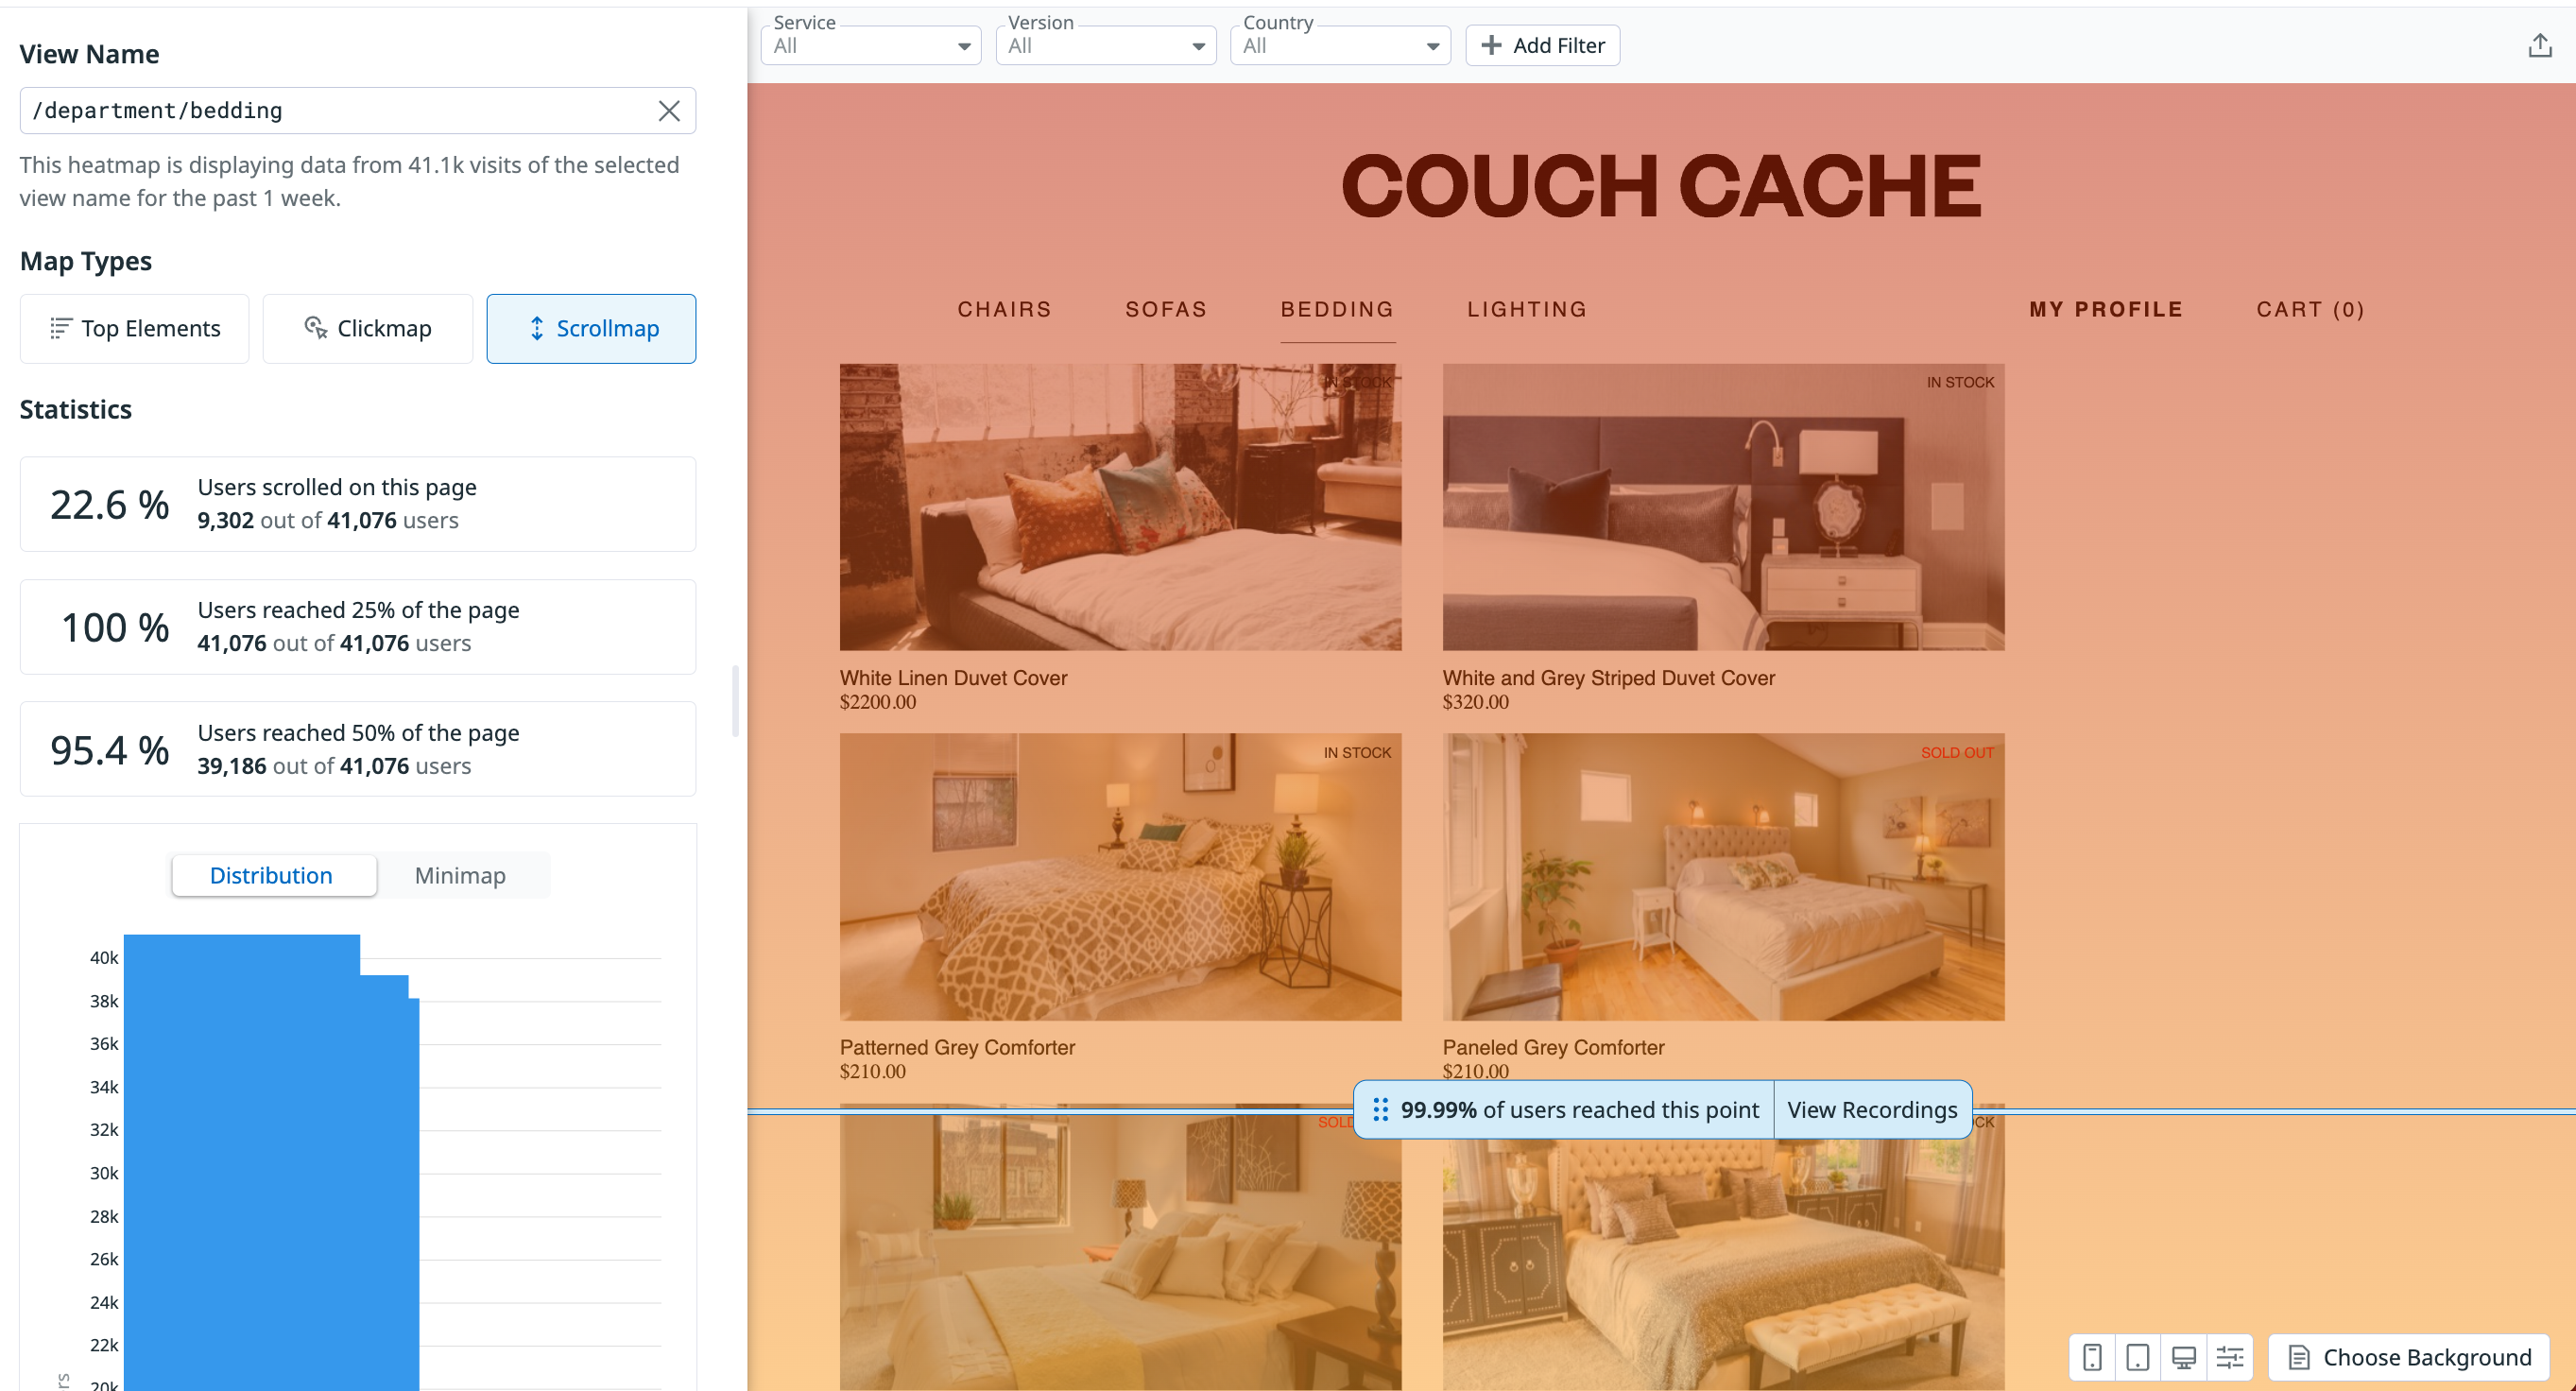
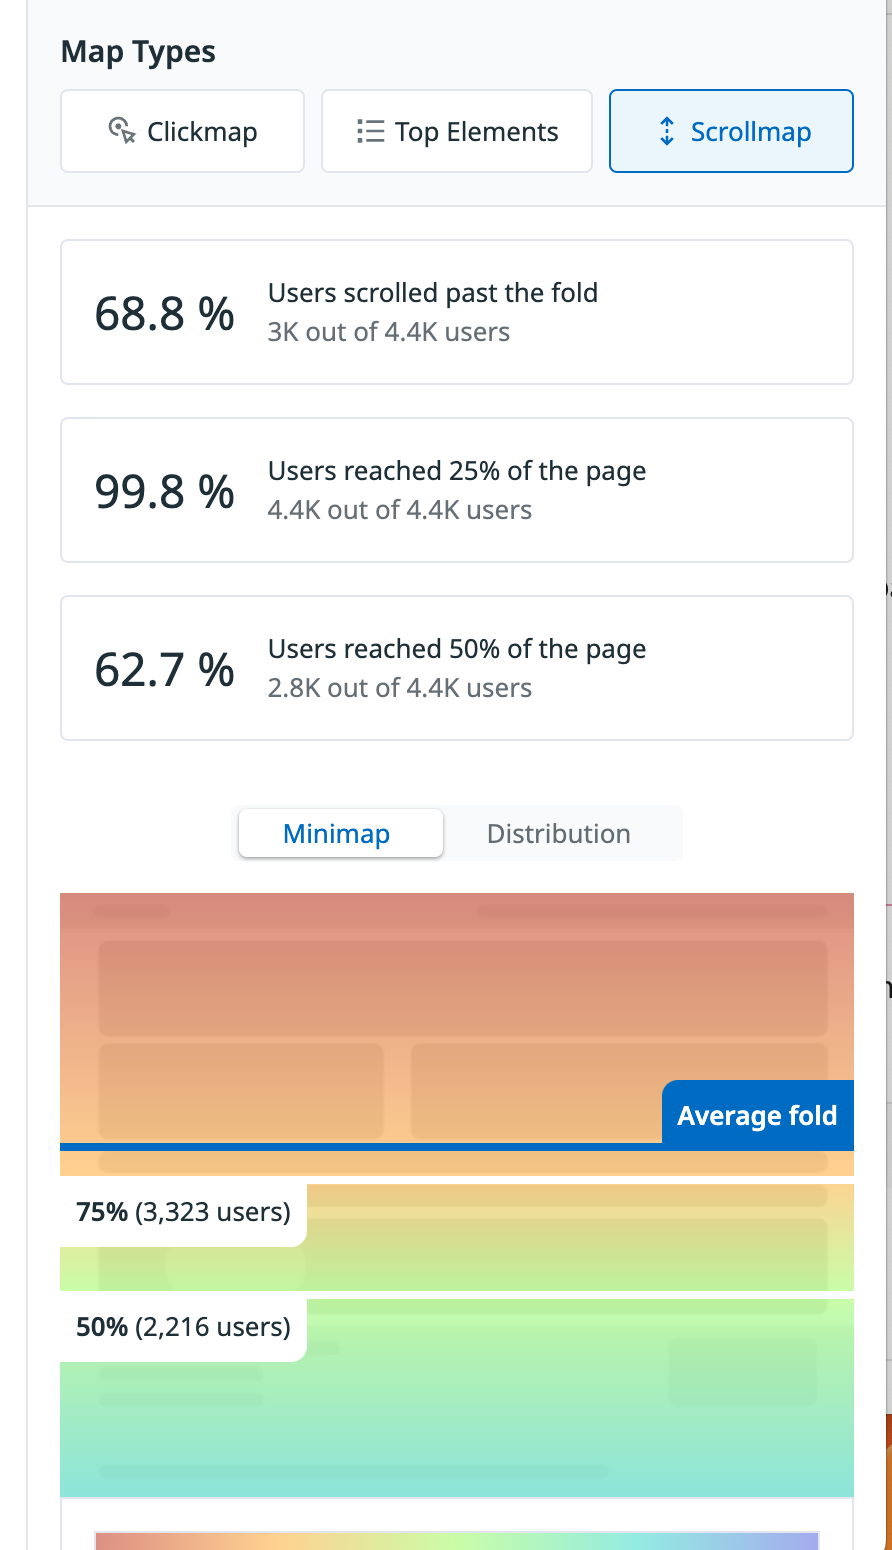
- Scroll maps: View how far users scroll down a page, including where the average fold of a page falls. The average fold is the lowest point on a page that a user can see on their device without scrolling.
Use heatmaps to review complex data at a glance, gaining insights around optimizing your user experience.
Prerequisites
To get started with heatmaps:
- Verify your SDK version:
- For Click maps, you must be on the latest version of the SDK (v4.40.0 or later).
- For Scroll maps, you must be on (v4.50.0 or later)
- Enable Session Replay.
- Set
trackUserInteractions: truein the SDK initialization to enable action tracking (required for Clickmaps).
Getting started
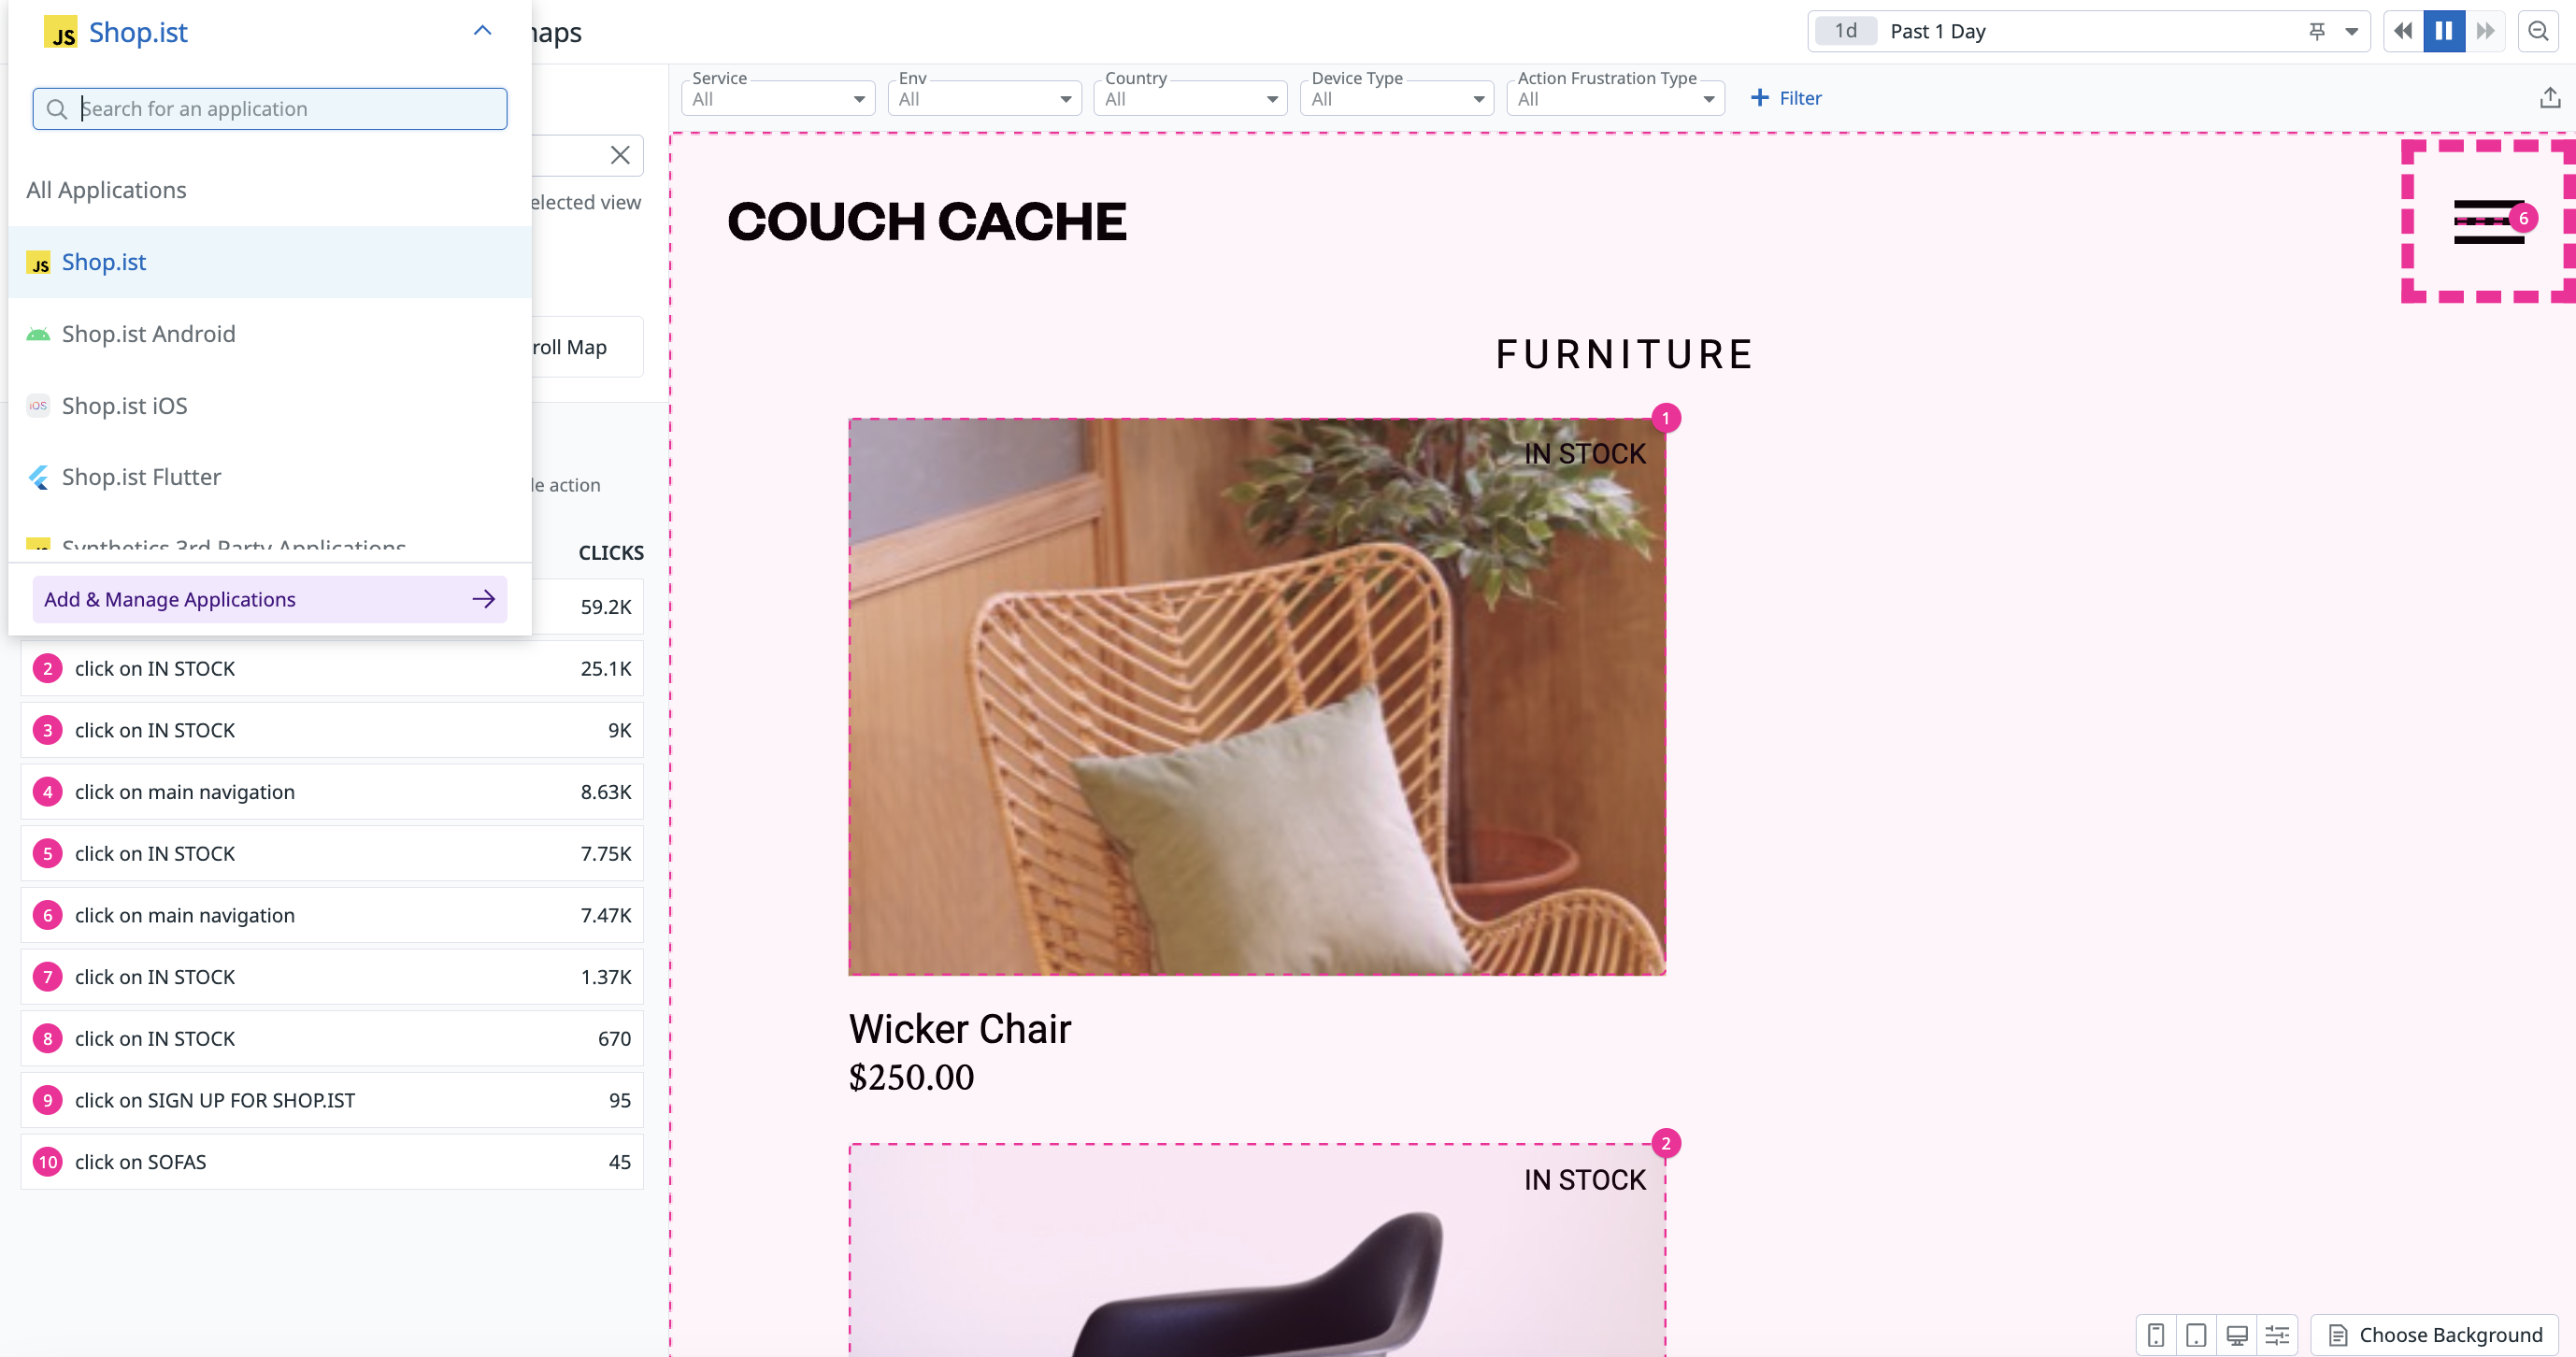
Navigate to Digital Experience > Product Analytics > Heatmaps. Select your application and view.
On the Product Analytics landing page, select your application and view. You can select the type of heatmap you would like to view as well (Top Elements, Click Map, Scroll Map).
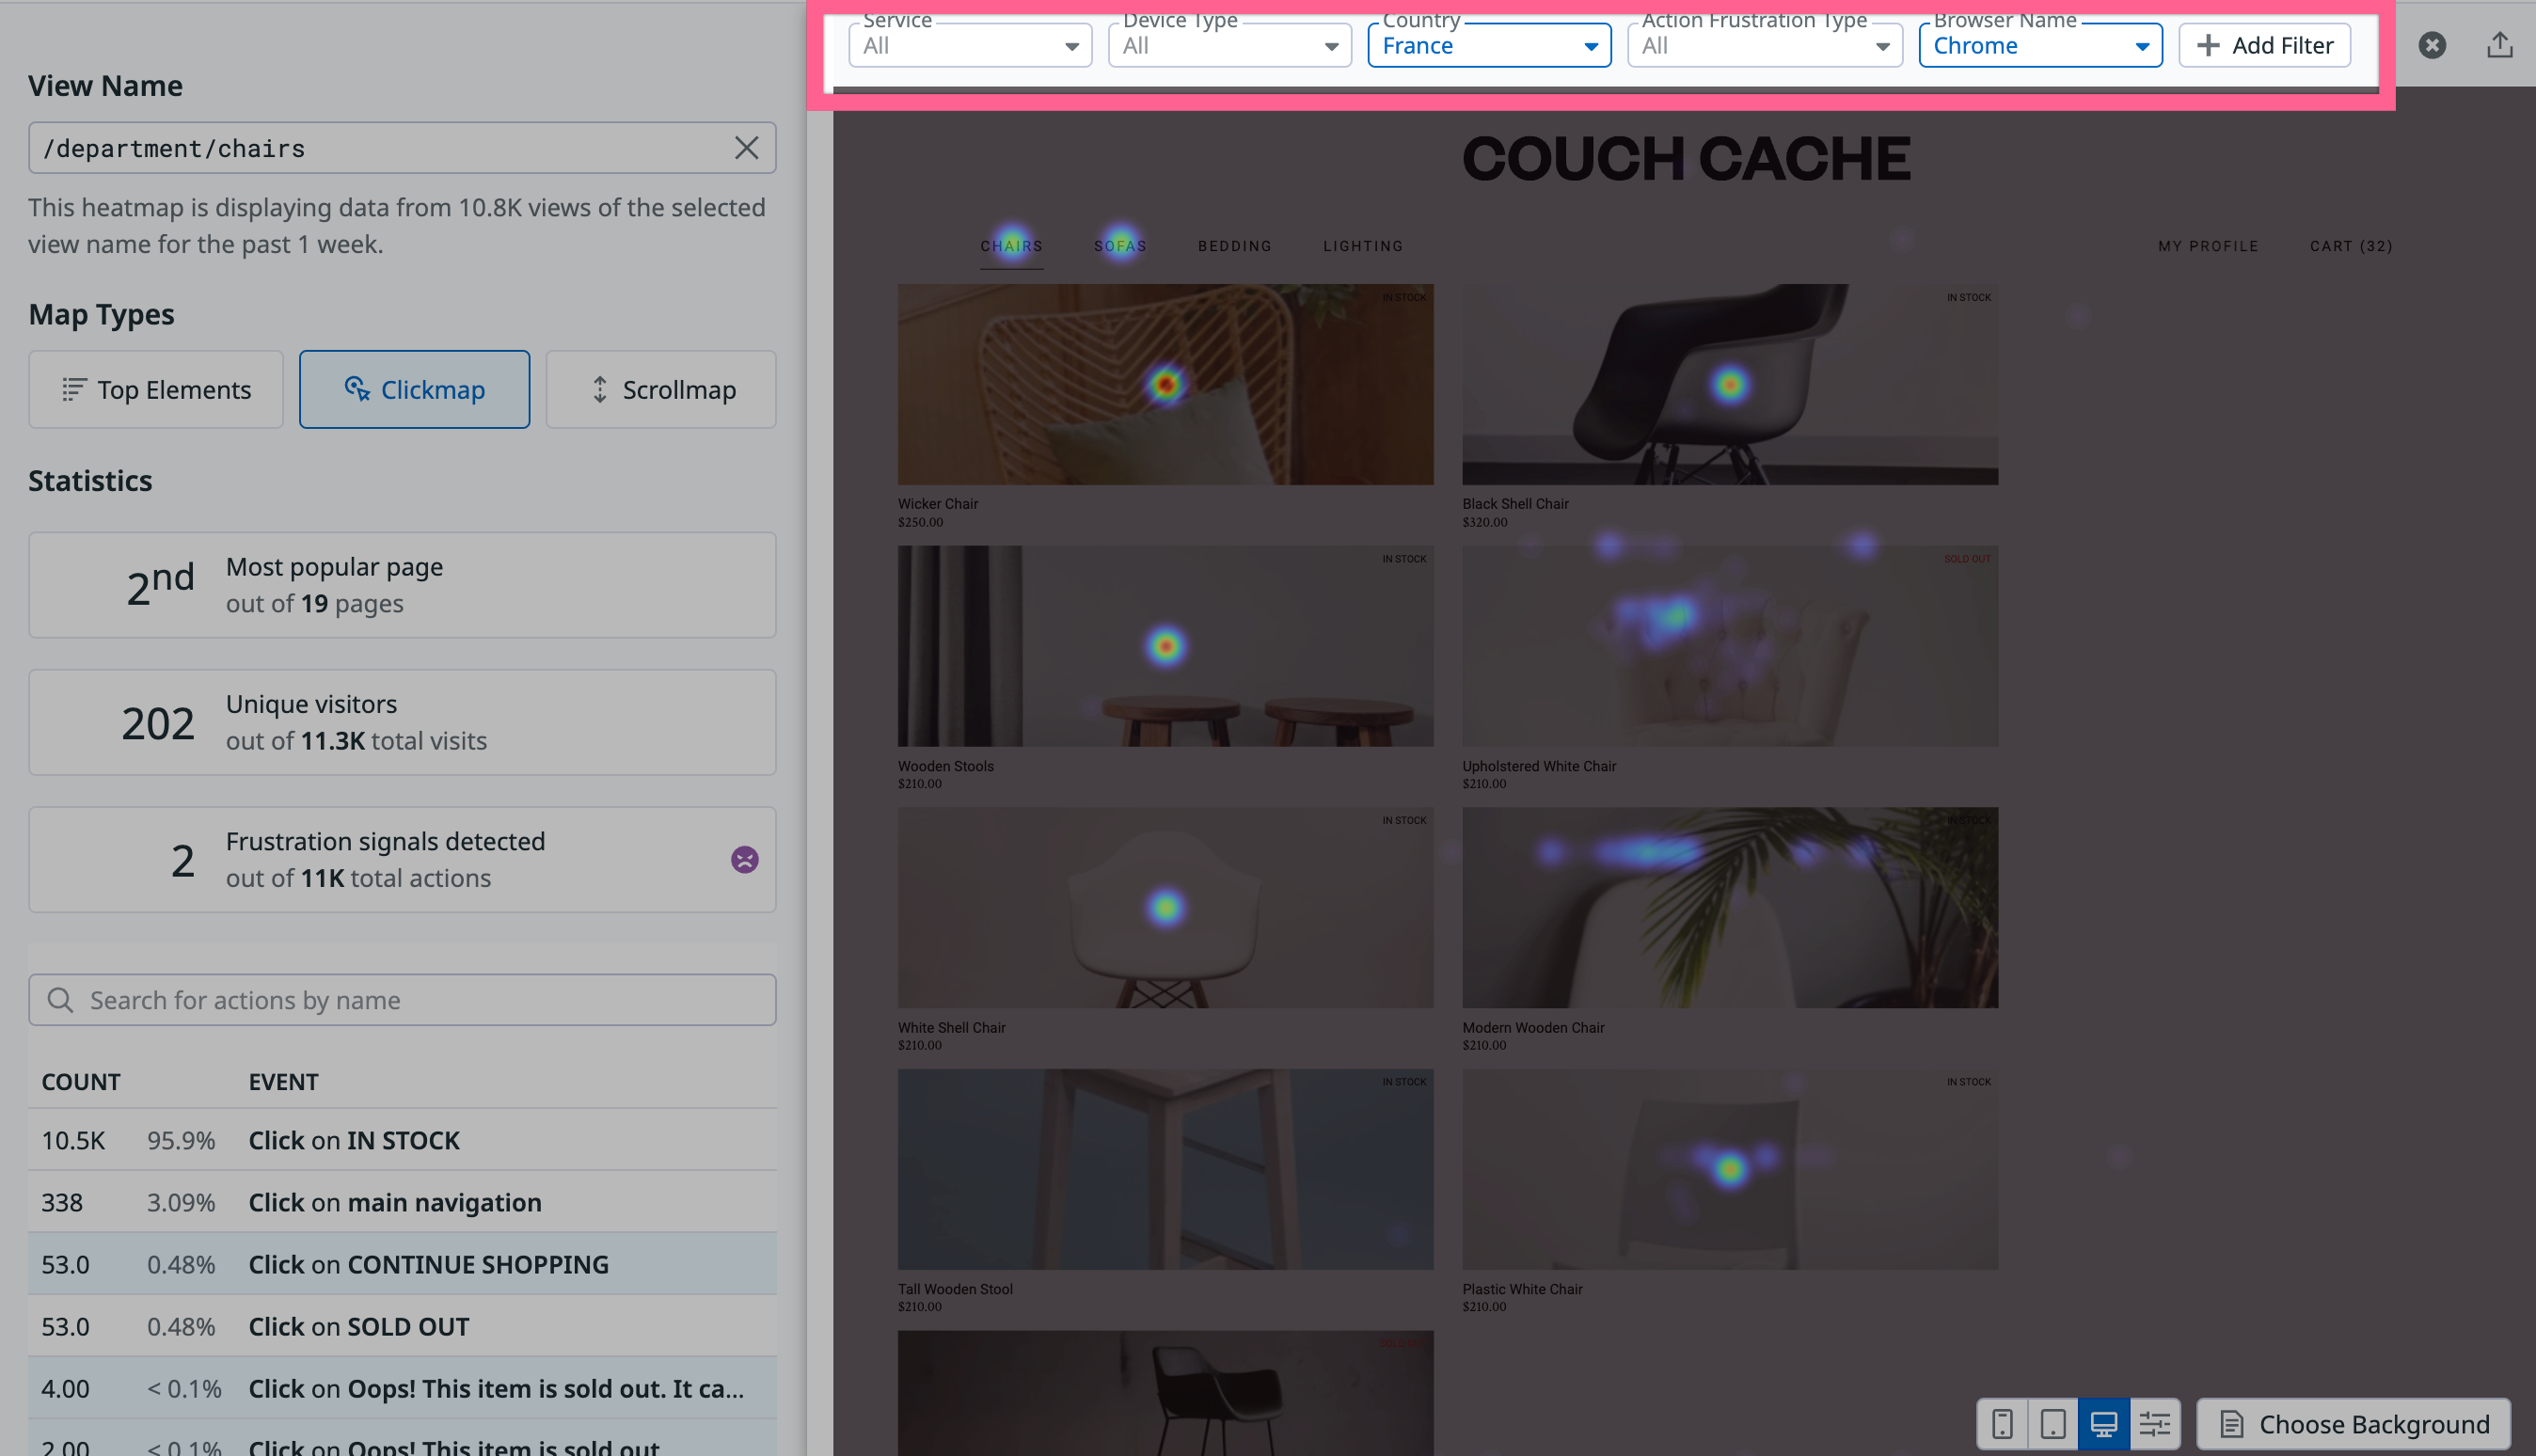
This takes you to the heatmap page for a particular view. You can switch the view being shown with the View Name and Application selectors at the top. To add more granular filters, like a specific geography for example, you can add a filter from the panel on the left side.
Click maps
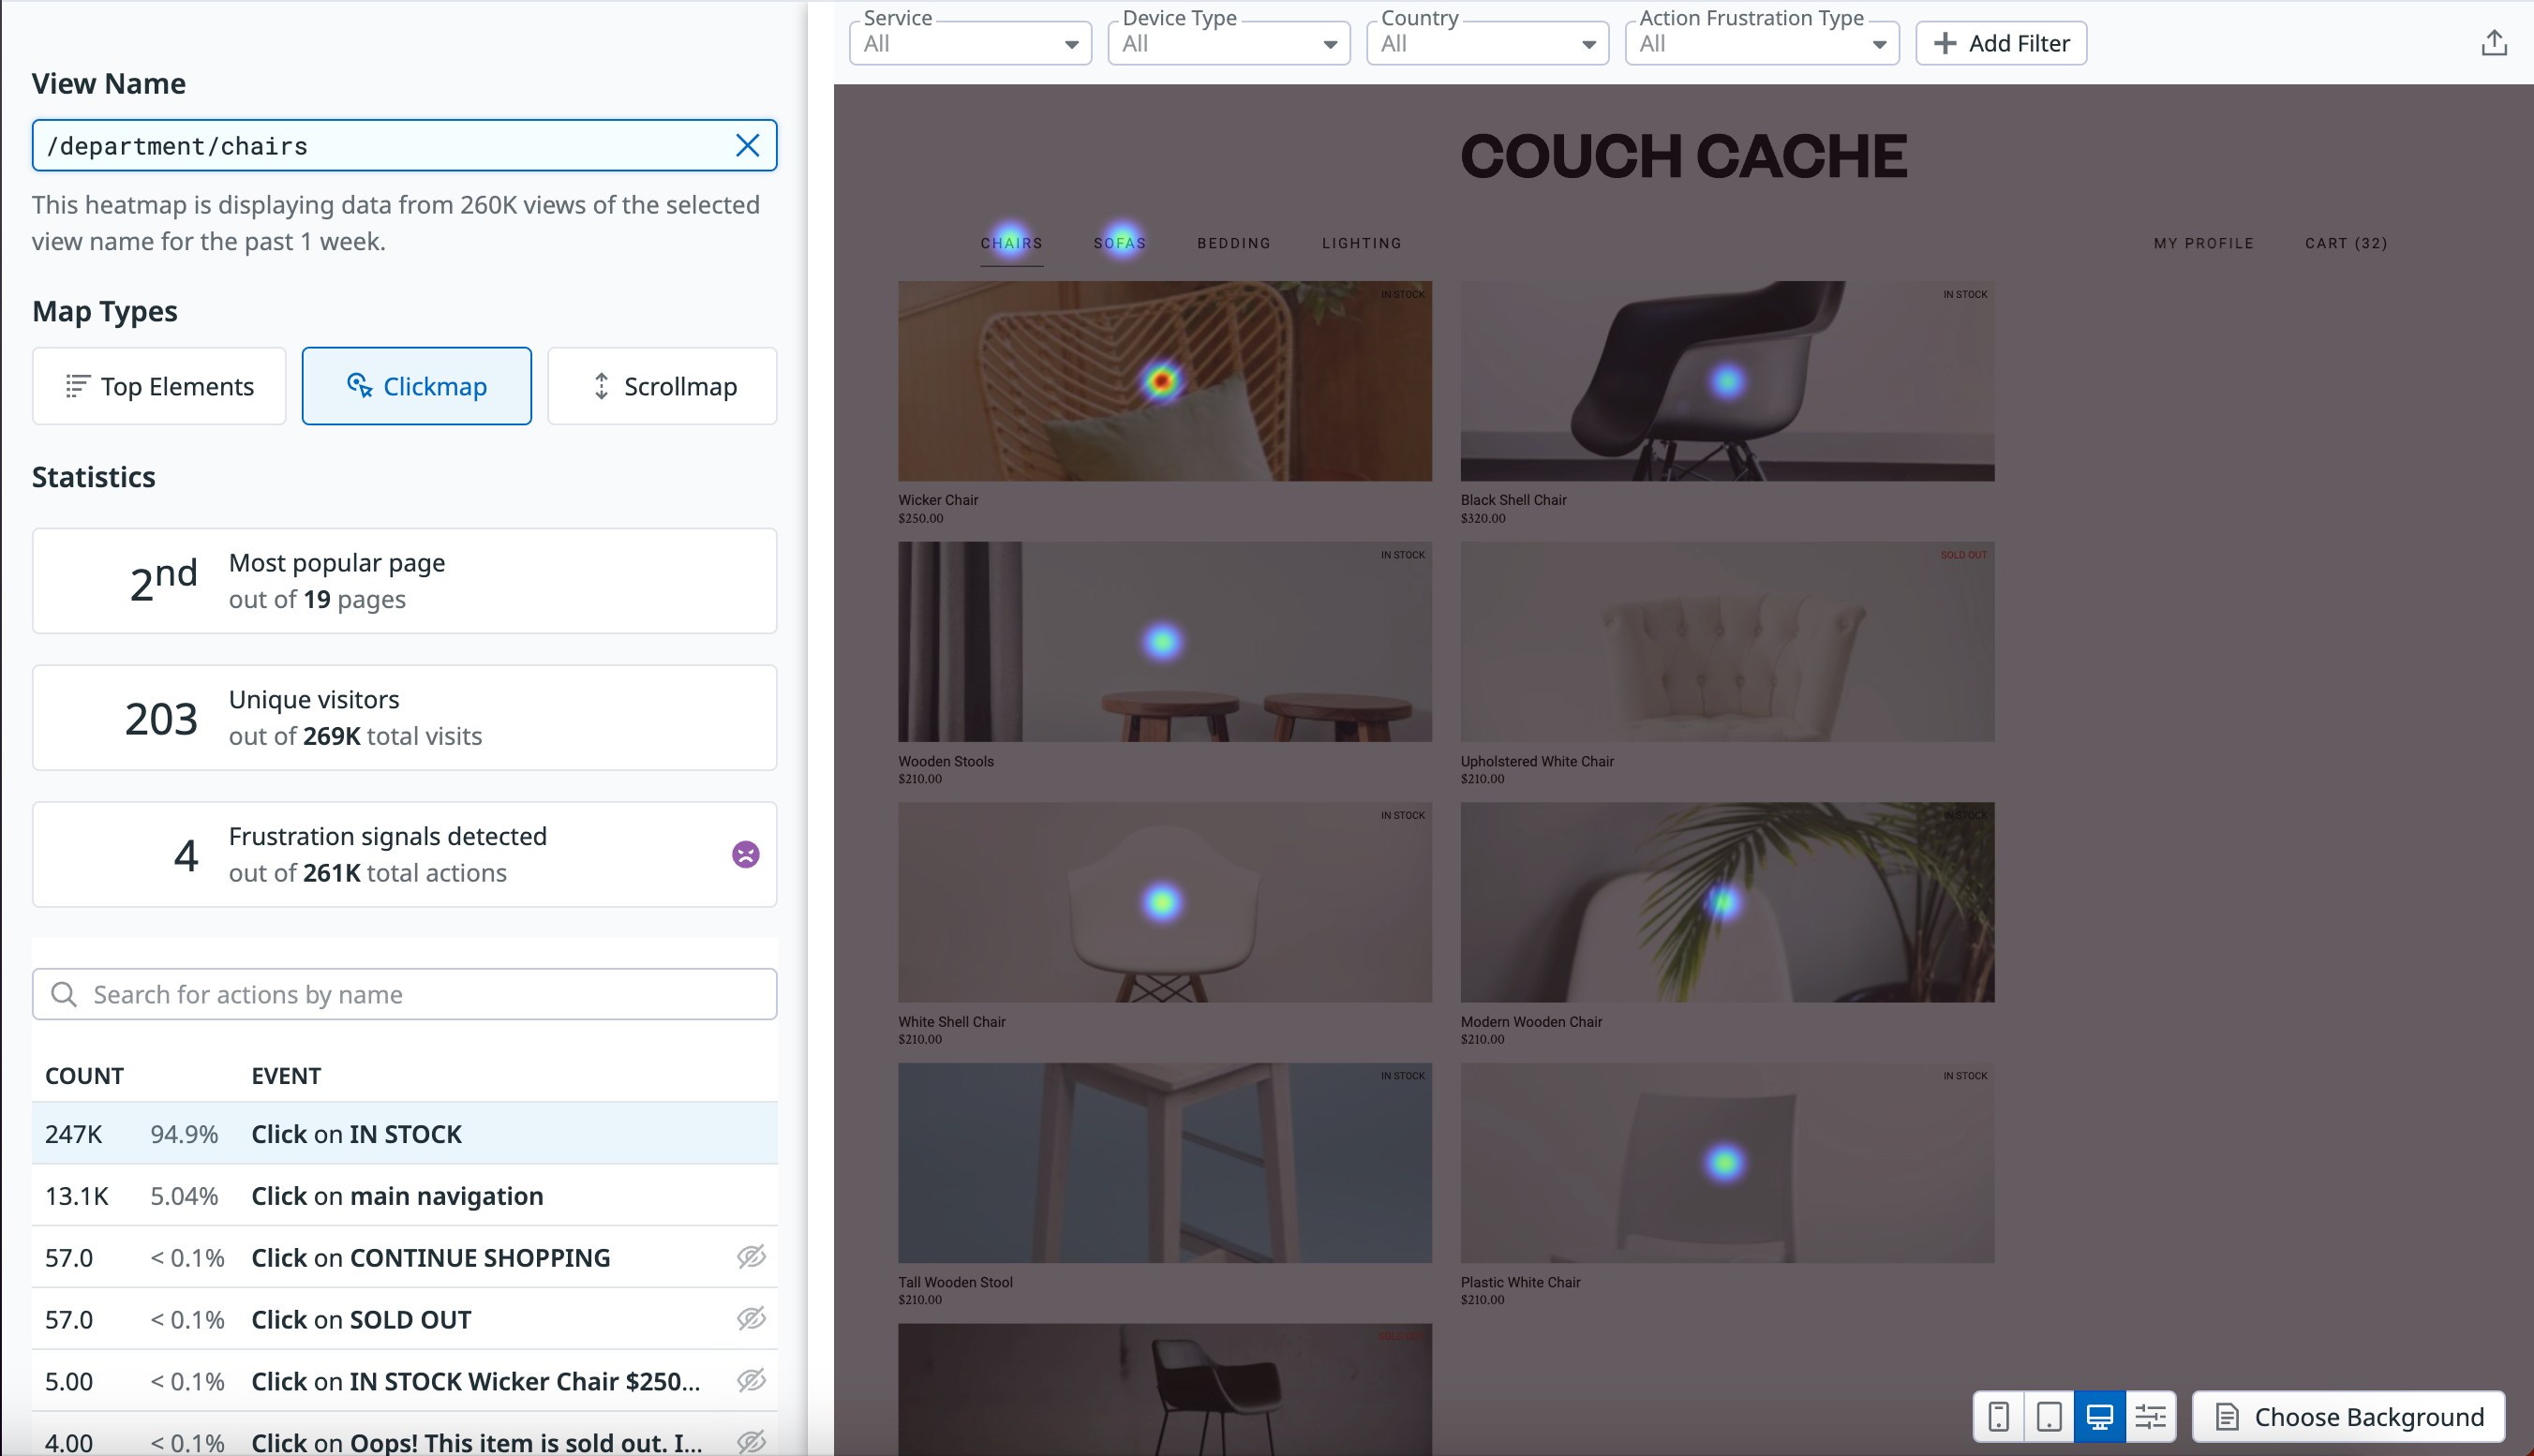
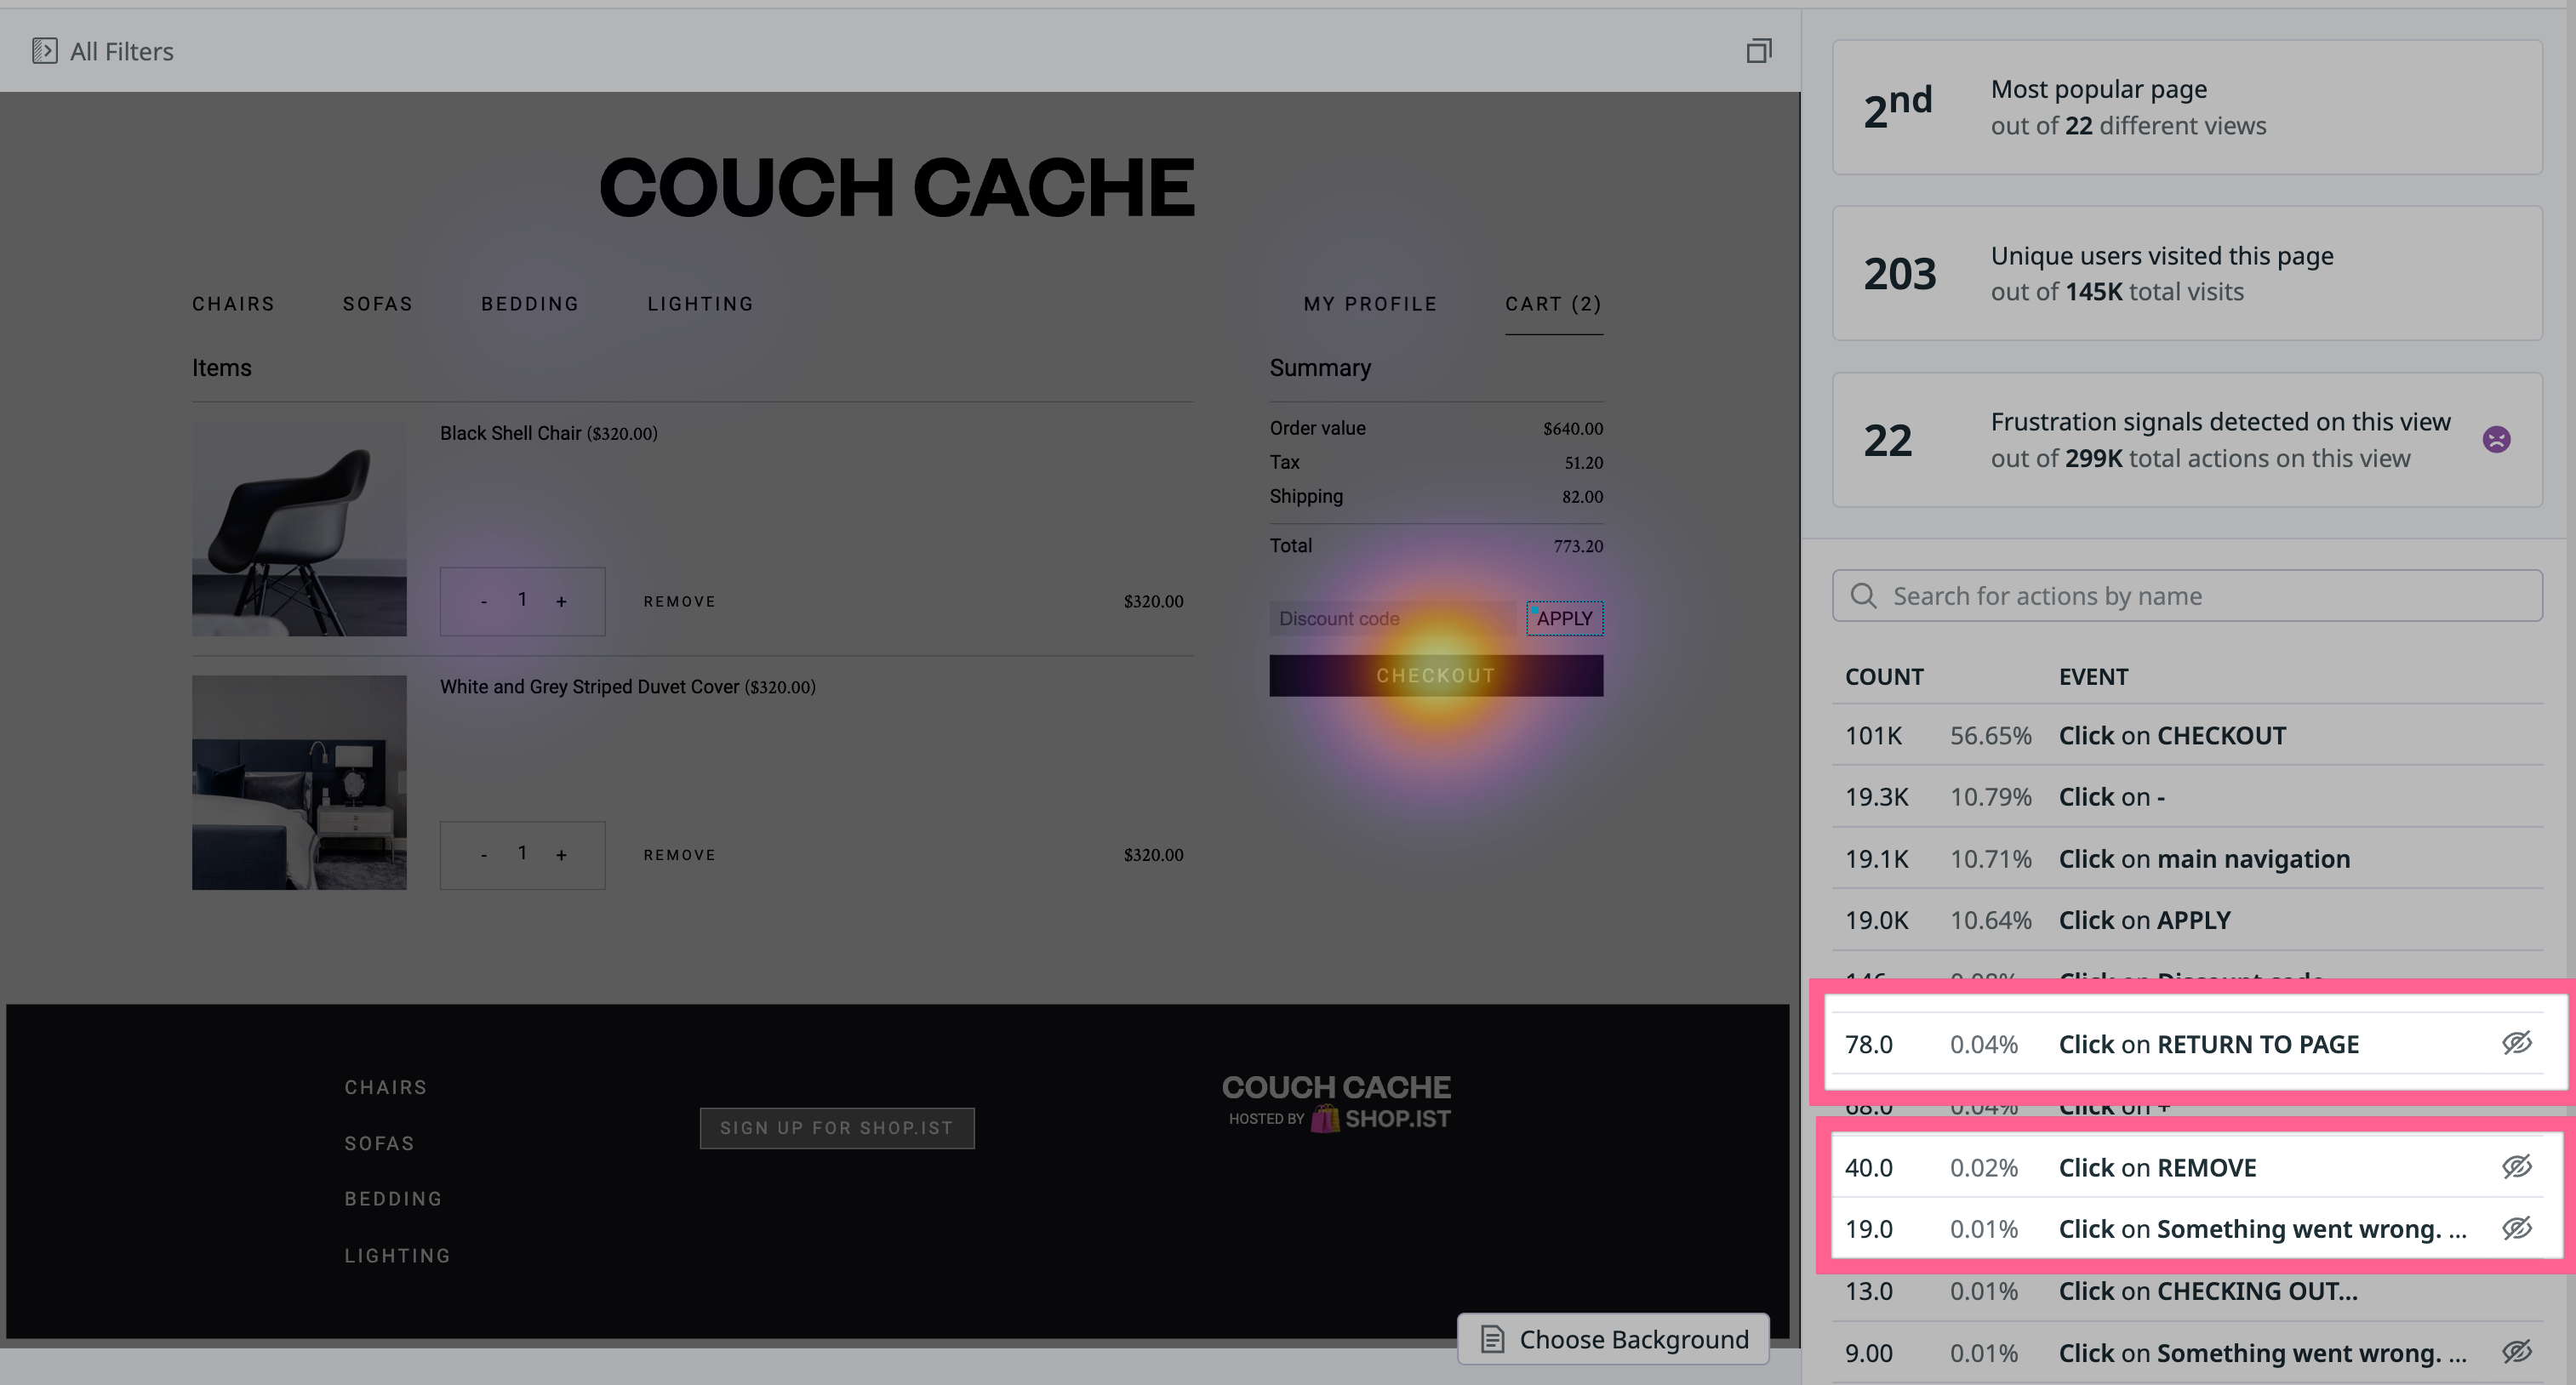
A Click map shows you the most interacted-with actions on a given view by aggregating user click actions from sessions and visualizing them as blobs on the map.
Each Click map also offers analytics such as:
- Where that page ranks out of all other visited pages
- Unique user counts to that page
- Any frustration signals on that page
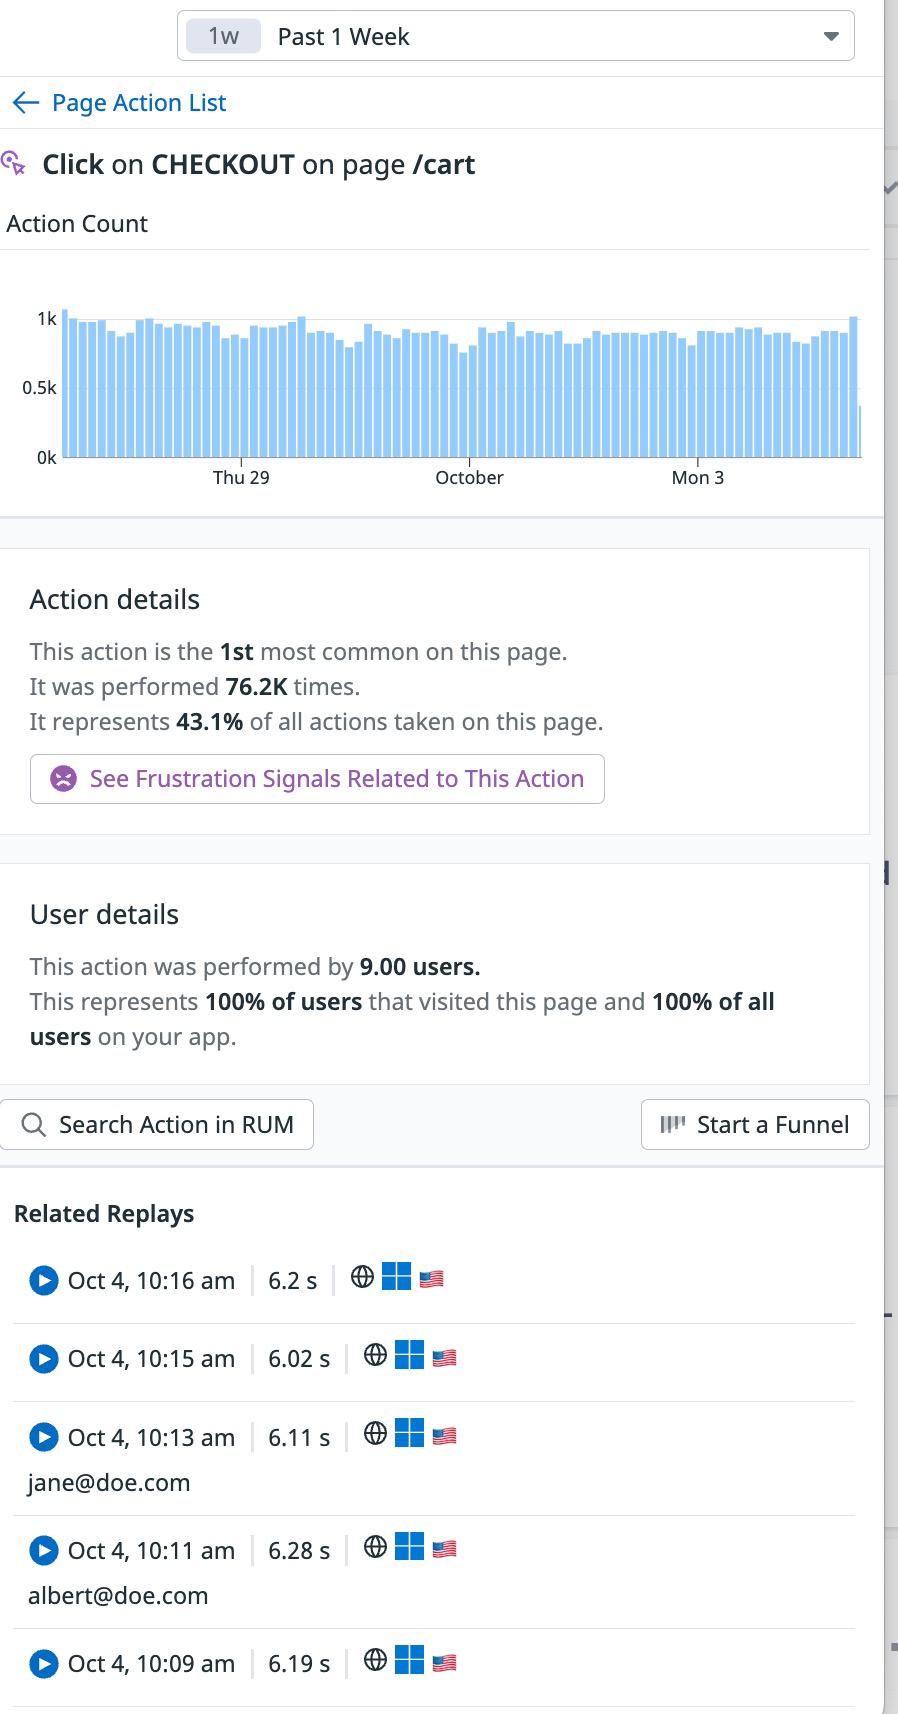
Below the panel are all actions that occurred on the page, listed by frequency. When you click into an action, you can understand more about that interaction, for example:
- The number of times the user performed the action and where it falls in overall analytics of top actions on a given page.
- If that action had a frustration signal occurring on it (for example, if a user rage clicked on that button), you can view the associated frustration signals as well.
Top Elements
Top Elements heatmaps aggregate click actions on a given view by displaying the most interacted-with elements and their rank. The ranking on the map itself corresponds to the action name on the side.
Click any action name in the panel to highlight the corresponding action on the map.
Scroll maps
Scroll maps show a visual of the aggregate scroll activity on a given page. Use Scroll maps to see where the average fold of the page falls, and how many users scroll to a given depth. You can drag the floating blue bar on a Scroll map to the depth you wish to assess.
The panel to the left of the Scroll map provides high-level insights with direct links to query results, such as a link to a list of views where the user scrolled past a given percentile. Below the insight panel is a minimap of the page and a distribution graph displaying granular scroll data, useful for identifying where the biggest drop-off occurs.
Backgrounds
A background is a snapshot of a Session Replay. Each heatmap fetches the 20 backgrounds that triggered the most actions during a given session. Changing the background shows different results depending on the background selected. You can use the Choose Background button to select a particular background for your heatmap.
A heatmap’s list of backgrounds cannot be modified.
Next steps
After understanding analytics, the next step is to understand the action in the context of other data outside of heatmaps. This might mean pivoting to the Analytics explorer. You can also watch associated session replays to visually see a user performing the action in the context of their overall session.
Troubleshooting
I am looking at a heatmap for a given view, but it’s showing me an unexpected page.
Heatmaps are based on Product Analytics view names. Depending on how your Product Analytics application is configured, many pages can start being grouped under the same view name, or you can start having specific view names.
The view that I selected is not showing the initial content.
Heatmaps are generated with Session Replay data. Datadog’s intelligent algorithm smartly picks a replay that is both recent and best matches the initial state of the page. In some cases, you might not be able to find the correct replay. To switch the background of your heatmap, you can use the Choose Background button to navigate through the different states of the page and find the one you are looking for.
On the action list on the side of my heatmap, I see an icon showing an element that is not visibile in the heatmap.
The tooltip on the icon says element is not visible. This means that the element is a common action on your page, but it’s not displayed on the background in the heatmap. To see that element, you can click Choose Background in the bottom right corner to switch the background of your heatmap to one where that element is present.
After attempting to create a heatmap, I see a “No Replay Data” state appear.
This means that Datadog could not find any Session Replays to use as a heatmap background that matches the current search filters. If you just started to record sessions with the Browser SDK, it may also take a few minutes for the Session Replay to be available for viewing.
After attempting to create a heatmap, I see a “Not enough data to generate a heatmap” state appear.
This means that Datadog was not able to match any user actions with the current selected replay. This happens for a variety of reasons, such as:
- Your application is not using the latest SDK version (>= 4.20.0).
- Your page has recently changed drastically.
All of the user information on the page is empty.
User information is not collected by default. Heatmaps use the user information available in your session data to display relevant insights on behavior.
Further reading
Additional helpful documentation, links, and articles:

