- Essentials
- Getting Started
- Agent
- API
- APM Tracing
- Containers
- Dashboards
- Database Monitoring
- Datadog
- Datadog Site
- DevSecOps
- Incident Management
- Integrations
- Logs
- Monitors
- OpenTelemetry
- Profiler
- Session Replay
- Security
- Serverless for AWS Lambda
- Software Catalog
- Software Delivery
- Synthetic Monitoring and Testing
- Tags
- Workflow Automation
- Learning Center
- Support
- Glossary
- Standard Attributes
- Guides
- Agent
- Integrations
- Developers
- Authorization
- DogStatsD
- Custom Checks
- Integrations
- Create an Agent-based Integration
- Create an API Integration
- Create a Log Pipeline
- Integration Assets Reference
- Build a Marketplace Offering
- Create a Tile
- Create an Integration Dashboard
- Create a Monitor Template
- Create a Cloud SIEM Detection Rule
- OAuth for Integrations
- Install Agent Integration Developer Tool
- Service Checks
- IDE Plugins
- Community
- Guides
- OpenTelemetry
- Administrator's Guide
- API
- Partners
- Datadog Mobile App
- DDSQL Reference
- CoScreen
- CoTerm
- Cloudcraft (Standalone)
- In The App
- Dashboards
- Notebooks
- DDSQL Editor
- Reference Tables
- Sheets
- Monitors and Alerting
- Metrics
- Watchdog
- Bits AI
- Internal Developer Portal
- Error Tracking
- Change Tracking
- Service Management
- Actions & Remediations
- Infrastructure
- Cloudcraft
- Resource Catalog
- Universal Service Monitoring
- Hosts
- Containers
- Processes
- Serverless
- Network Monitoring
- Cloud Cost
- Application Performance
- APM
- APM Terms and Concepts
- Application Instrumentation
- APM Metrics Collection
- Trace Pipeline Configuration
- Correlate Traces with Other Telemetry
- Trace Explorer
- Recommendations
- Code Origins for Spans
- Service Observability
- Endpoint Observability
- Dynamic Instrumentation
- Live Debugger
- Error Tracking
- Data Security
- Guides
- Troubleshooting
- Continuous Profiler
- Database Monitoring
- Agent Integration Overhead
- Setup Architectures
- Setting Up Postgres
- Setting Up MySQL
- Setting Up SQL Server
- Setting Up Oracle
- Setting Up Amazon DocumentDB
- Setting Up MongoDB
- Connecting DBM and Traces
- Data Collected
- Exploring Database Hosts
- Exploring Query Metrics
- Exploring Query Samples
- Exploring Database Schemas
- Exploring Recommendations
- Troubleshooting
- Guides
- Data Streams Monitoring
- Data Jobs Monitoring
- Digital Experience
- Real User Monitoring
- Synthetic Testing and Monitoring
- Continuous Testing
- Product Analytics
- Software Delivery
- CI Visibility
- CD Visibility
- Test Optimization
- Quality Gates
- DORA Metrics
- Security
- Security Overview
- Cloud SIEM
- Code Security
- Cloud Security
- App and API Protection
- Workload Protection
- Sensitive Data Scanner
- AI Observability
- Log Management
- Observability Pipelines
- Log Management
- Administration
Query Across Datadog and OpenTelemetry Metrics
Join the Preview!
Querying across Datadog and OpenTelemetry metrics is in Preview. To enable this feature, click Request Access and complete the form.
Request AccessMany organizations use OpenTelemetry (OTel) alongside Datadog, creating hybrid environments where some hosts emit OTel metrics and others emit Datadog metrics. Because OTel and Datadog metrics often use different naming conventions and semantic definitions, creating a unified view of your infrastructure in these environments can be challenging.
Datadog helps you bridge this gap by enabling you to:
- Query OTel and Datadog metrics together.
- Understand metric sources and mappings.
Unify OpenTelemetry and Datadog metrics in queries
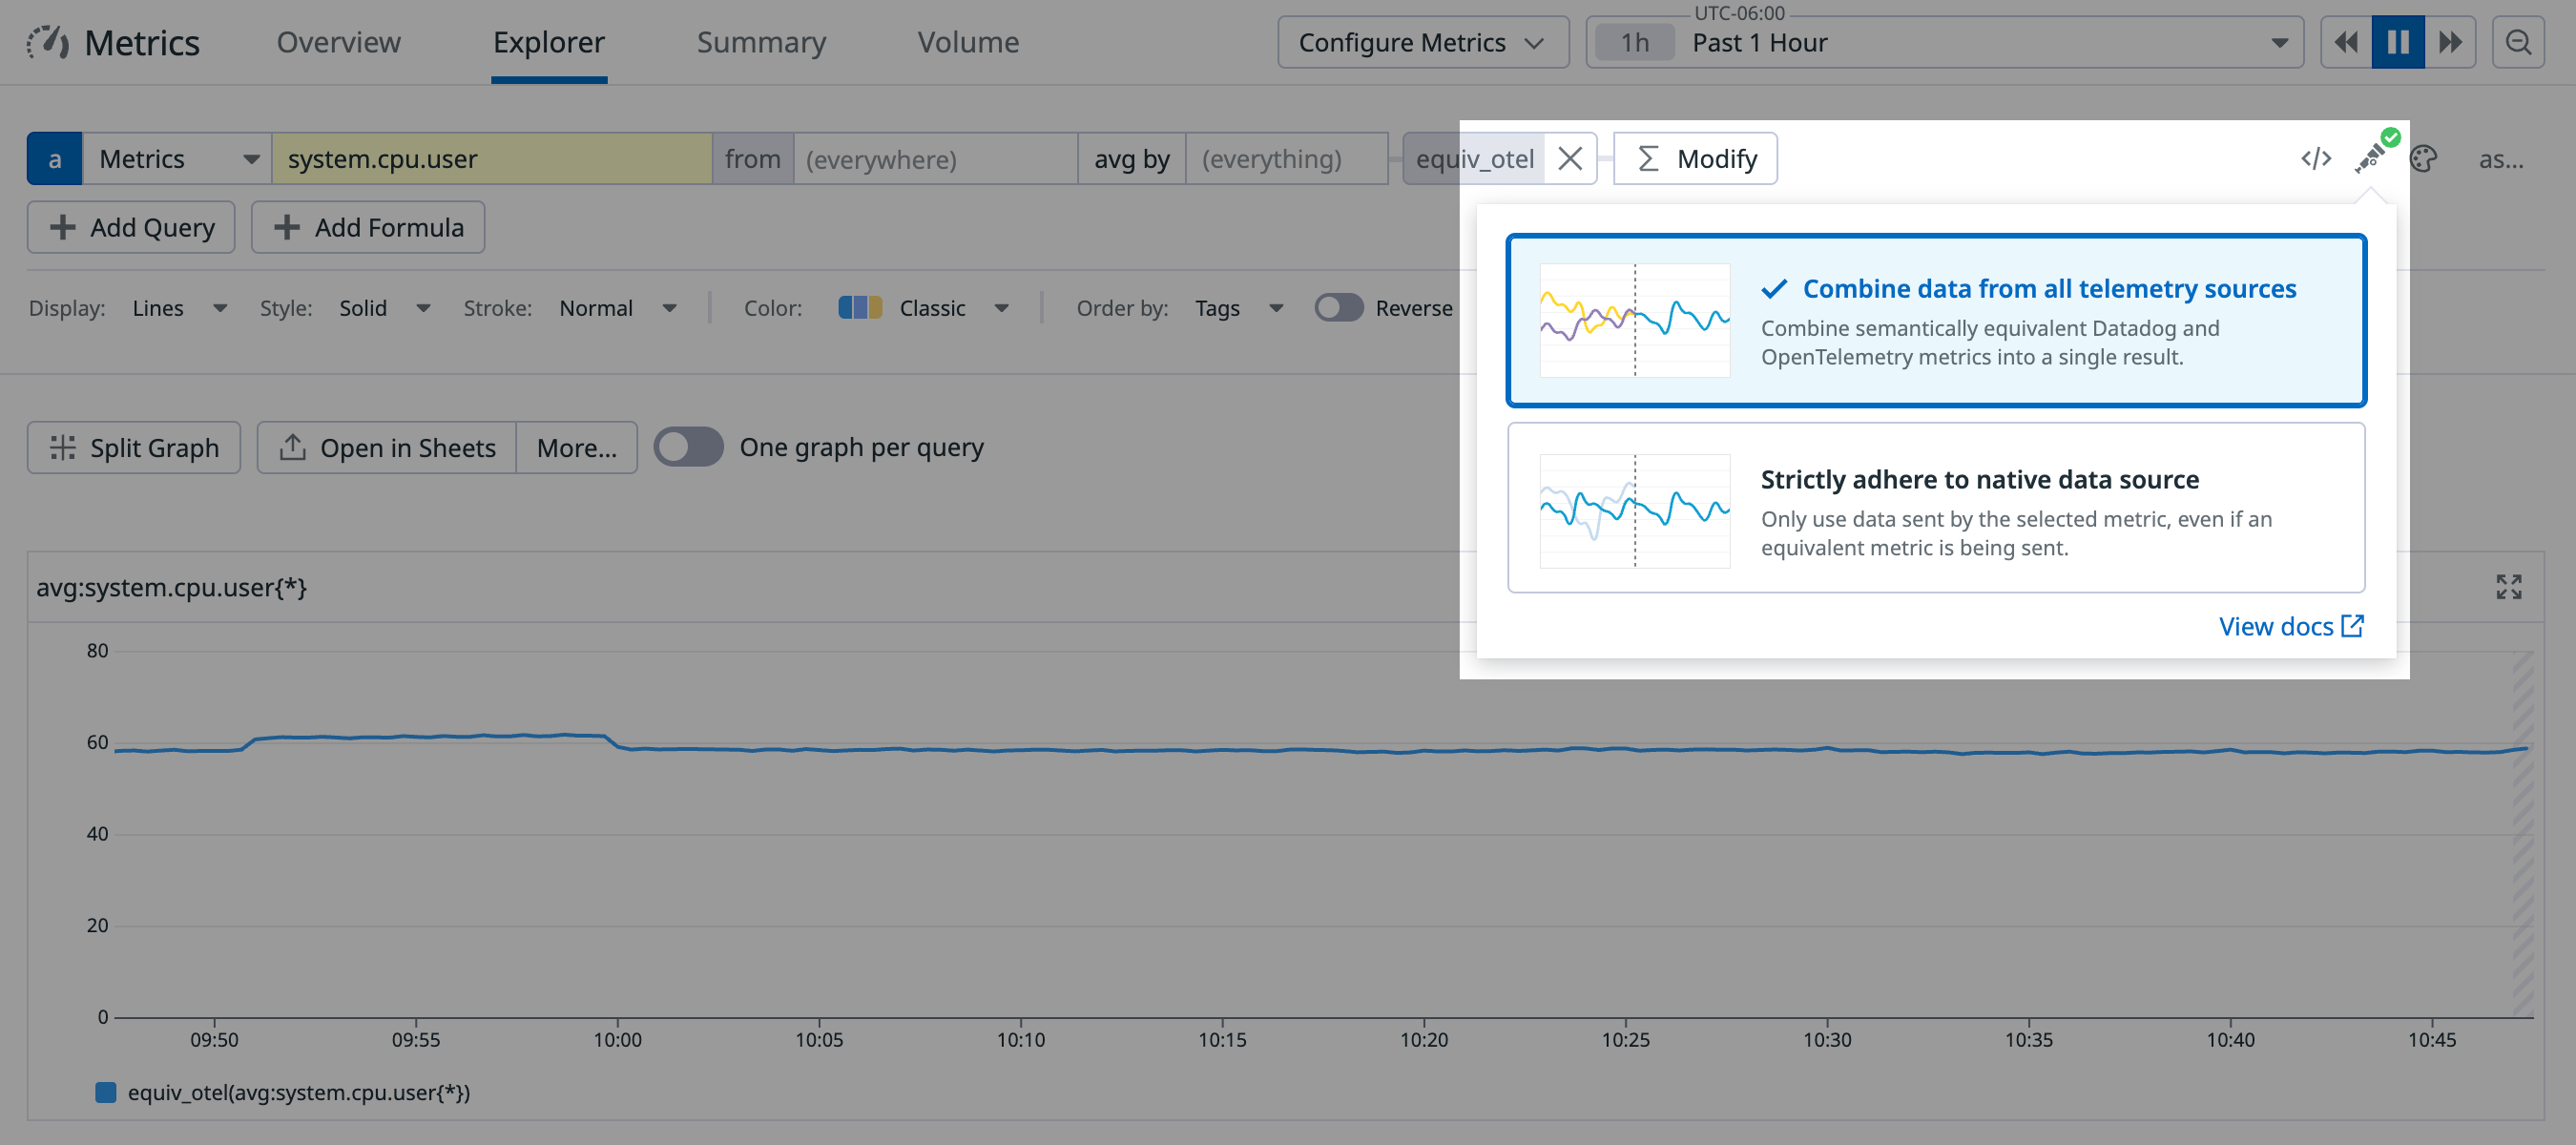
The Metrics Query Editor includes a Semantic Mode selector, allowing you to control how Datadog handles potentially equivalent metrics from OTel and Datadog sources.
Choose between two modes:
Strictly adhere to native data source (Default)
- This mode queries only the specific metric name you enter (whether it’s a Datadog or OTel metric).
- It does not include data from any equivalent metrics.
Combine data from all telemetry sources
- This mode automatically combines data from equivalent Datadog and OTel metrics into a single query, even if you only enter one of the metric names.
- It handles the mapping between equivalent metrics (including complex ones) and aggregates all related timeseries as a single metric.
- This works whether you start with a Datadog metric or an OTel metric.
Example
Imagine you’re monitoring system load using two different metrics:
- OTel native:
otel.system.cpu.load_average.15m - Datadog Agent:
system.load.15
If you query for otel.system.cpu.load_average.15m, apply a max space aggregation, and set the Semantic Mode to Combine data from all telemetry sources, Datadog automatically:
- Identifies the equivalent Datadog metric:
system.load.15. - Combines the timeseries from both
otel.system.cpu.load_average.15mandsystem.load.15. - Applies the max aggregation across all datapoints from both sources.
This uses the equiv_otel function to merge the data.
Understand metric sources and mappings
To provide clarity when querying, the metric source and equivalent metrics are displayed:
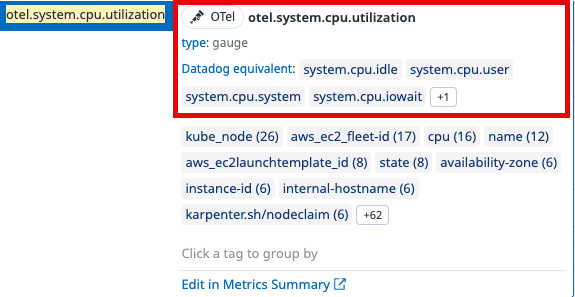
Source pill: In the query editor, a Datadog or OTel pill appears next to the metric name, indicating its origin.
Equivalent metrics list: The editor also shows a list of metrics considered equivalent to the one you’ve queried. This includes complex one-to-many mappings. For example,
otel.system.cpu.utilizationmaps to multiple Datadog CPU state metrics (system.cpu.idle,system.cpu.iowait, etc.).
View detailed mappings
For a comprehensive view of how specific OTel and Datadog metrics relate, check the Metrics Summary page:
- Navigate to Metrics > Summary.
- Search for a known Datadog or OTel metric.
- Open the Metric Details side panel.
Alternatively, click Edit in Metrics Summary when inputting a metric in the query editor.
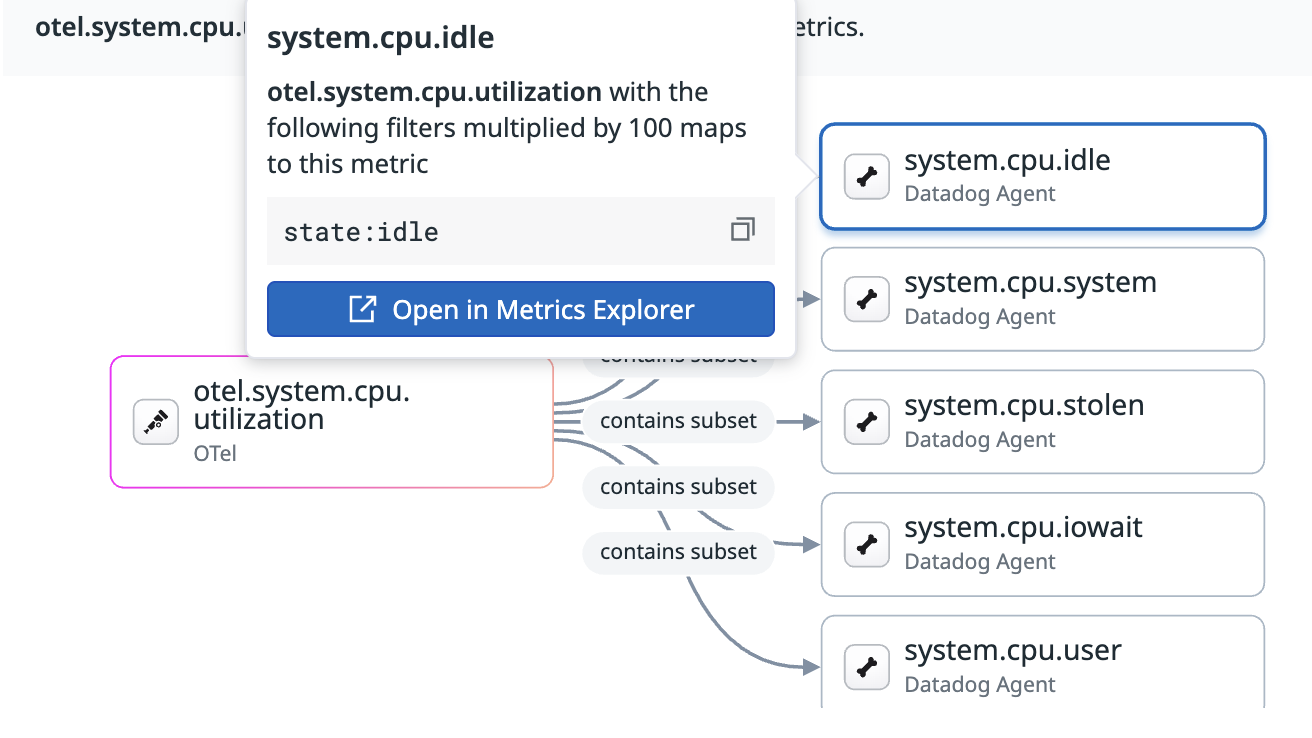
This panel displays metric mappings, including complex relationships. For example, it shows how otel.system.cpu.utilization maps to multiple Datadog metrics like system.cpu.idle, system.cpu.user, and others.
You can also see the tag-based logic used for these mappings. Hover over an equivalent metric to see the specific conditions. For example, hovering over system.cpu.idle shows that it maps to otel.system.cpu.utilization when state=idle, and the value is multiplied by 100.
Further Reading
Additional helpful documentation, links, and articles:


