To monitor a Db2 instance, create a Db2 user with either the EXECUTE permission on the above five table functions, or grant the Db2 user one of the following roles:
DATAACCESS authority
DBADM authority
SQLADM authority
To monitor the health of an instance, its associated databases, and database objects, enable the database system monitor switches for each of the objects you want to monitor:
Statement
Lock
Tables
Buffer pool
Switch to the instance master user and run these commands at the db2 prompt:
update dbm cfg using HEALTH_MON on
update dbm cfg using DFT_MON_STMT on
update dbm cfg using DFT_MON_LOCK on
update dbm cfg using DFT_MON_TABLE on
update dbm cfg using DFT_MON_BUFPOOL on
Next, run get dbm cfg and you should see the following:
 Default database monitor switches
   Buffer pool                         (DFT_MON_BUFPOOL) = ON
   Lock                                   (DFT_MON_LOCK) = ON
   Sort                                   (DFT_MON_SORT) = OFF
   Statement                              (DFT_MON_STMT) = ON
   Table                                 (DFT_MON_TABLE) = ON
   Timestamp                         (DFT_MON_TIMESTAMP) = ON
   Unit of work                            (DFT_MON_UOW) = OFF
 Monitor health of instance and databases   (HEALTH_MON) = ON
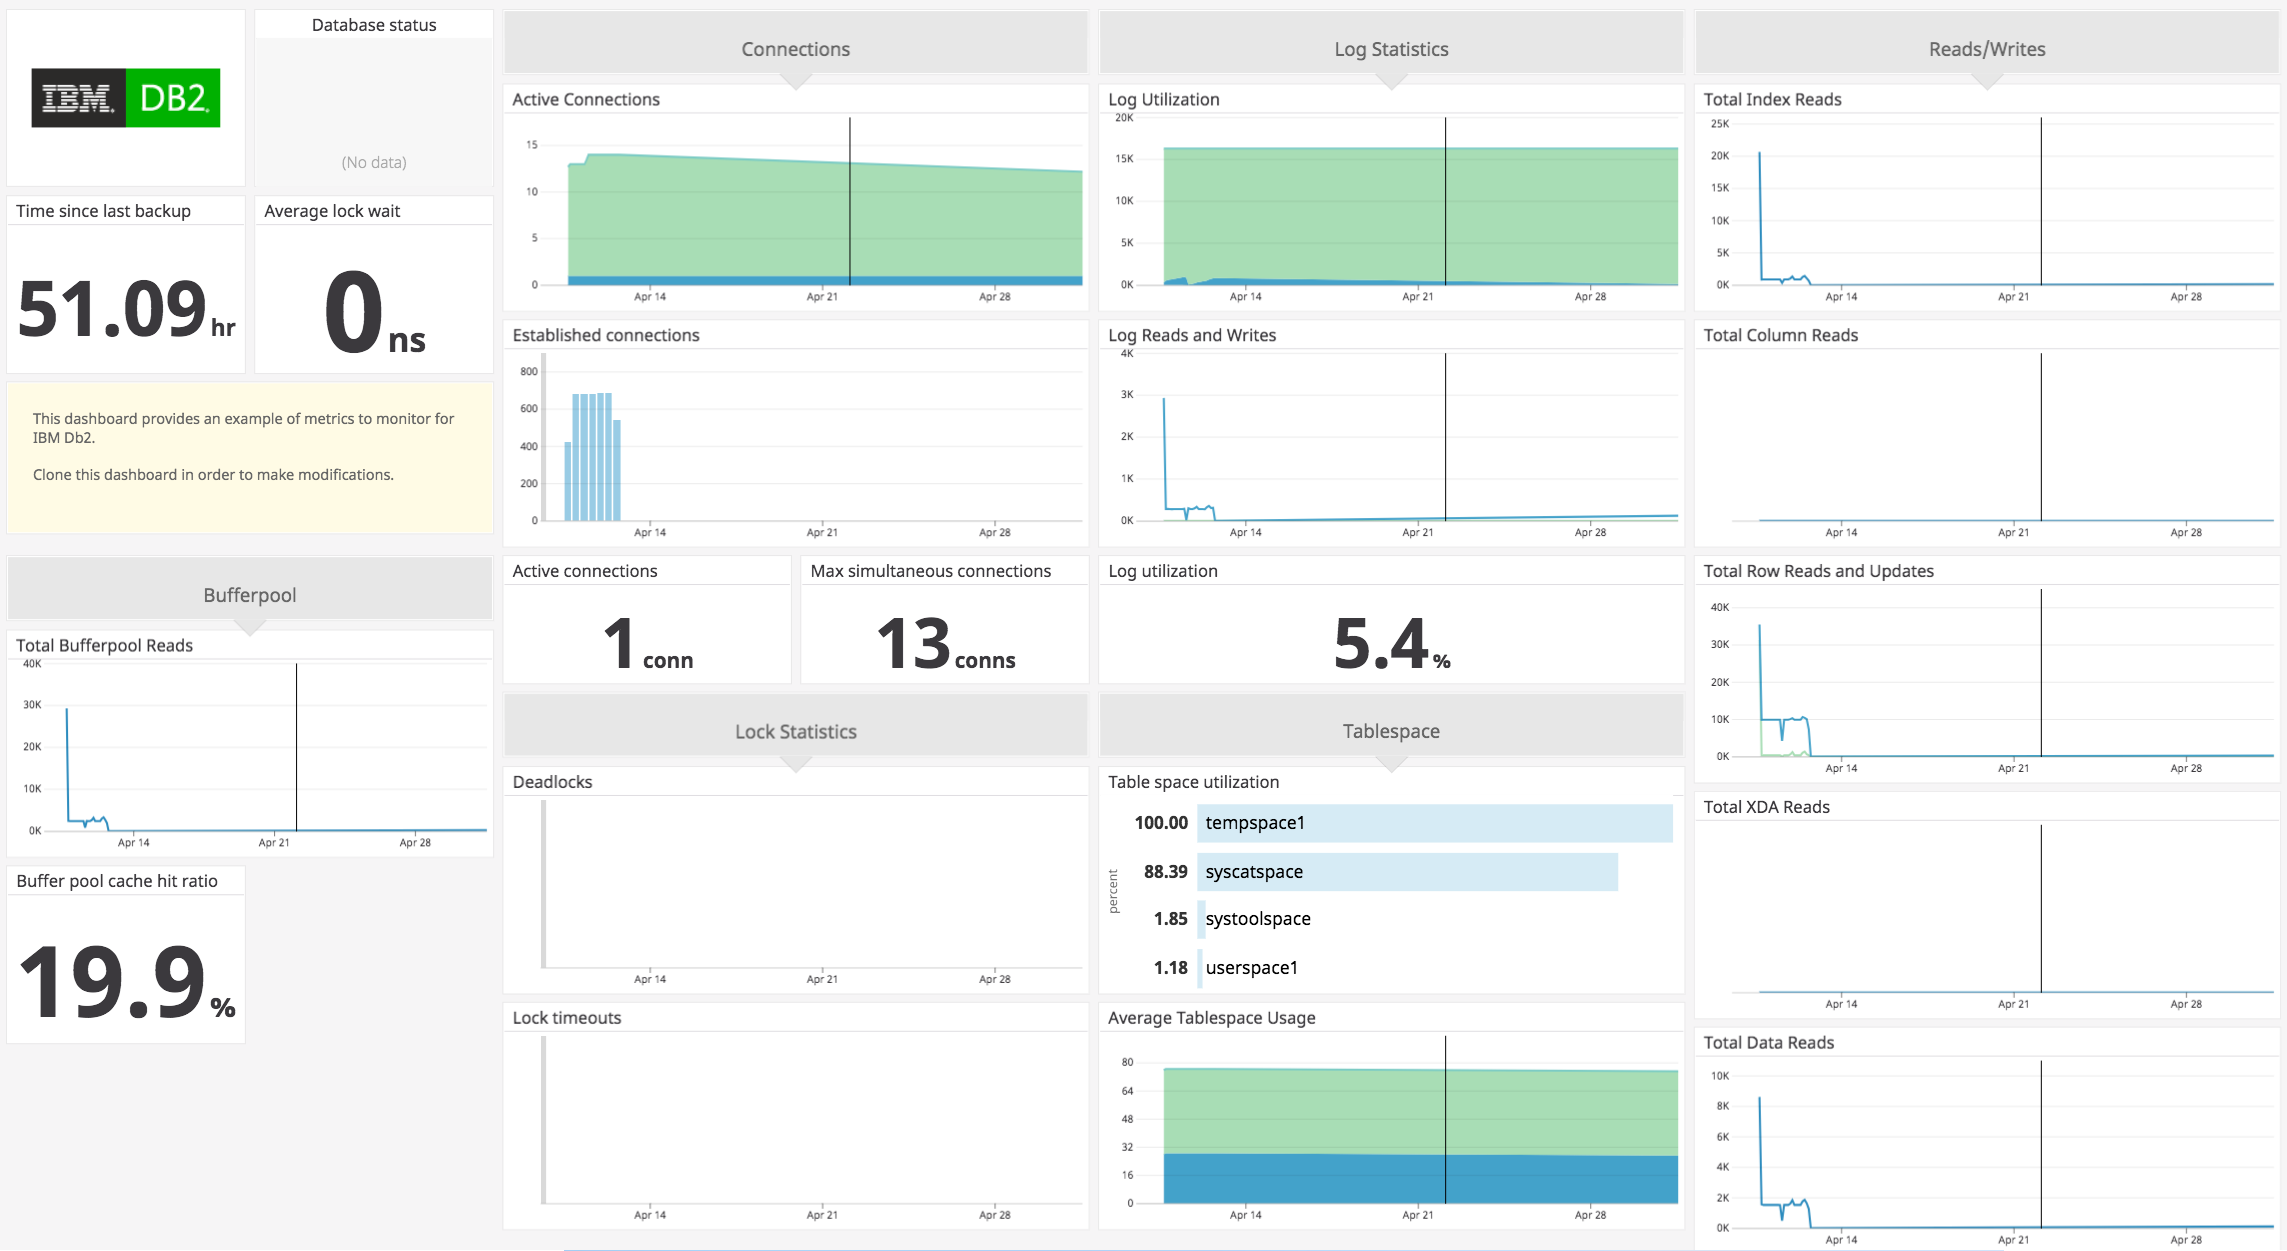
Edit the ibm_db2.d/conf.yaml file, in the conf.d/ folder at the root of your Agent’s configuration directory to start collecting your ibm_db2 performance data. See the sample ibm_db2.d/conf.yaml for all available configuration options.
The number of applications that are currently connected to the database. Shown as connection
ibm_db2.application.executing (gauge)
The number of applications for which the database manager is currently processing a request. Shown as connection
ibm_db2.backup.latest (gauge)
The time elapsed since the latest database backup was completed. Shown as second
ibm_db2.bufferpool.column.hit_percent (gauge)
The percentage of time that the database manager did not need to load a page from disk to service a column-organized table data page request. Shown as percent
ibm_db2.bufferpool.column.reads.logical (count)
The number of column-organized table data pages read from the logical table space containers for temporary, regular, and large table spaces. Shown as get
ibm_db2.bufferpool.column.reads.physical (count)
The number of column-organized table data pages read from the physical table space containers for temporary, regular, and large table spaces. Shown as get
ibm_db2.bufferpool.column.reads.total (count)
The total number of column-organized table data pages read from the table space containers for temporary, regular, and large table spaces. Shown as get
ibm_db2.bufferpool.data.hit_percent (gauge)
The percentage of time that the database manager did not need to load a page from disk to service a data page request. Shown as percent
ibm_db2.bufferpool.data.reads.logical (count)
The number of data pages read from the logical table space containers for temporary, regular and large table spaces. Shown as get
ibm_db2.bufferpool.data.reads.physical (count)
The number of data pages read from the physical table space containers for temporary, regular and large table spaces. Shown as get
ibm_db2.bufferpool.data.reads.total (count)
The total number of data pages read from the table space containers for temporary, regular and large table spaces. Shown as get
The percentage of time that the group database manager did not need to load a page from disk to service a column-organized table data page request. Shown as percent
ibm_db2.bufferpool.group.data.hit_percent (gauge)
The percentage of time that the group database manager did not need to load a page from disk to service a data page request. Shown as percent
ibm_db2.bufferpool.group.hit_percent (gauge)
The percentage of time that the group database manager did not need to load a page from disk to service a page request. Shown as percent
The percentage of time that the group database manager did not need to load a page from disk to service an index page request. Shown as percent
ibm_db2.bufferpool.group.xda.hit_percent (gauge)
The percentage of time that the group database manager did not need to load a page from disk to service an index page request. Shown as percent
ibm_db2.bufferpool.hit_percent (gauge)
The percentage of time that the database manager did not need to load a page from disk to service a page request. Shown as percent
ibm_db2.bufferpool.index.hit_percent (gauge)
The percentage of time that the database manager did not need to load a page from disk to service an index page request. Shown as percent
ibm_db2.bufferpool.index.reads.logical (count)
The number of index pages read from the logical table space containers for temporary, regular and large table spaces. Shown as get
ibm_db2.bufferpool.index.reads.physical (count)
The number of index pages read from the physical table space containers for temporary, regular and large table spaces. Shown as get
ibm_db2.bufferpool.index.reads.total (count)
The total number of index pages read from the table space containers for temporary, regular and large table spaces. Shown as get
ibm_db2.bufferpool.reads.logical (count)
The number of pages read from the logical table space containers for temporary, regular and large table spaces. Shown as get
ibm_db2.bufferpool.reads.physical (count)
The number of pages read from the physical table space containers for temporary, regular and large table spaces. Shown as get
ibm_db2.bufferpool.reads.total (count)
The total number of pages read from the table space containers for temporary, regular and large table spaces. Shown as get
ibm_db2.bufferpool.xda.hit_percent (gauge)
The percentage of time that the database manager did not need to load a page from disk to service an index page request. Shown as percent
ibm_db2.bufferpool.xda.reads.logical (count)
The number of data pages for XML storage objects (XDAs) read from the logical table space containers for temporary, regular and large table spaces. Shown as get
ibm_db2.bufferpool.xda.reads.physical (count)
The number of data pages for XML storage objects (XDAs) read from the physical table space containers for temporary, regular and large table spaces. Shown as get
ibm_db2.bufferpool.xda.reads.total (count)
The total number of data pages for XML storage objects (XDAs) read from the table space containers for temporary, regular and large table spaces. Shown as get
ibm_db2.connection.active (gauge)
The current number of connections. Shown as connection
ibm_db2.connection.max (gauge)
The highest number of simultaneous connections to the database since the database was activated. Shown as connection
ibm_db2.connection.total (count)
The total number of connections to the database since the first connect, activate, or last reset (coordinator agents). Shown as connection
ibm_db2.lock.active (gauge)
The number of locks currently held. Shown as lock
ibm_db2.lock.dead (count)
The total number of deadlocks that have occurred. Shown as lock
ibm_db2.lock.pages (gauge)
The memory pages (4 KiB each) currently in use by the lock list. Shown as page
ibm_db2.lock.timeouts (count)
The number of times that a request to lock an object timed out instead of being granted. Shown as lock
ibm_db2.lock.wait (gauge)
The average wait time for a lock. Shown as millisecond
ibm_db2.lock.waiting (gauge)
The number of agents waiting on a lock. Shown as lock
ibm_db2.log.available (gauge)
The disk blocks (4 KiB each) of active log space in the database that is not being used by uncommitted transactions. Shown as block
ibm_db2.log.reads (count)
The number of log pages read from disk by the logger. Shown as read
ibm_db2.log.used (gauge)
The disk blocks (4 KiB each) of active log space currently used in the database. Shown as block
ibm_db2.log.utilized (gauge)
The utilization of active log space as a percentage. Shown as percent
ibm_db2.log.writes (count)
The number of log pages written to disk by the logger. Shown as write
ibm_db2.row.modified.total (count)
The total number of rows inserted, updated, or deleted. Shown as row
ibm_db2.row.reads.total (count)
The total number of rows that had to be read in order to return result sets. Shown as row
ibm_db2.row.returned.total (count)
The total number of rows that have been selected by and returned to applications. Shown as row
ibm_db2.tablespace.size (gauge)
The total size of the table space in bytes. Shown as byte
ibm_db2.tablespace.usable (gauge)
The total usable size of the table space in bytes. Shown as byte
ibm_db2.tablespace.used (gauge)
The total used size of the table space in bytes. Shown as byte
ibm_db2.tablespace.utilized (gauge)
The utilization of the table space as a percentage. Shown as percent
ibm_db2.can_connect Returns CRITICAL if the Agent is unable to connect to the monitored IBM Db2 database, or OK otherwise. Statuses: ok, critical
ibm_db2.status Returns CRITICAL if the monitored IBM Db2 database is quiesced, WARNING for quiesce-pending or rollforwards, or OK otherwise. Statuses: ok, warning, critical, unknown
Then it’s most likely caused by one of the following scenarios:
The configuration (conf.yaml) is missing a host and port configuration
The CLI Driver isn’t able to locate the database due to the absence of db2cli.ini and db2dsdriver.cfg
The Agent requires the information in both of the above scenarios to determine where to properly connect to the database. To solve this issue, you can either include a host and port parameter for every instance of the ibm_db2 check experiencing this issue. Alternatively, if you want to use the DSNs defined in either the db2cli.ini or db2dsdriver.cfg files, you can copy those files over to the clidriver directory that the Agent uses. Under normal circumstances, that directory is located at /opt/datadog-agent/embedded/lib/python3.9/site-packages/clidriver/cfg for Linux.
If you’re in an air gapped environment, or on a restricted network where it’s not possible to run pip install ibm_db==x.y.z where x.y.z is the version number, you can install ibm_db using the following method:
On a machine with network access, download the source tarballs for the ibm_db library and the ODBC and CLI. The ODBC and CLI are required to be downloaded separately because the ibm_db library requires them, but it cannot download them via pip. The following script installs the archive file for ibm_db==x.y.z on a Linux machine, where x.y.z is the version number:
Transport the two files over to the restricted host, and then extract the archive.
tar -xvf ibm_db.tar.gz

tar -xvf linuxx64_odbc_cli.tar.gz
Set the IBM_DB_HOME environment variable to the location of where /clidriver was extracted from linuxx64_odbc_cli.tar.gz. This will prevent the ibm_db library from installing a new version of the ODBC and CLI since that would fail.
exportIBM_DB_HOME=/path/to/clidriver
Using the embedded pip on the Agent, install the ibm_db library locally. This library’s files are contained within the extracted python-ibmdb-x.y.z from ibm_db.tar.gz.