Send Signal Sciences metrics and events to Datadog to monitor real-time attacks and abuse against your applications, APIs, and microservices, and to ensure Signal Sciences is functioning and inspecting traffic as expected.
Get metrics and events from Signal Sciences in real-time to:
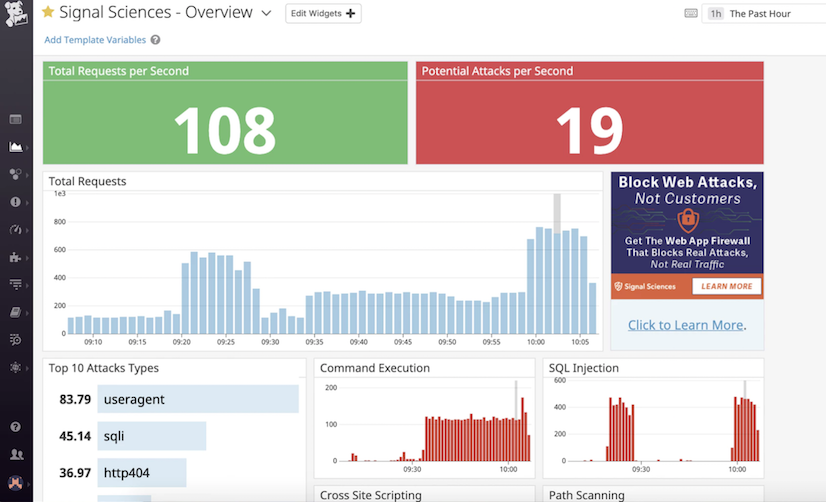
See metrics from the WAF related to:
Total Requests
Top Types of Potential Attacks
Command Execution
SQL Injection
Cross Site Scripting
Path Scanning
Anomalous Traffic
Unknown Sources
Server 400/500s
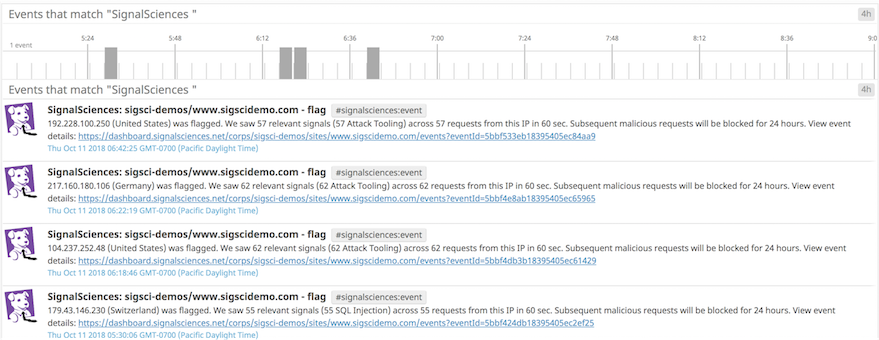
See IPs that Signal Sciences has blocked and/or flagged as malicious from any of the following activities:
To use the Signal Sciences-Datadog integration, you must be a customer of Signal Sciences. For more information about Signal Sciences, see https://www.signalsciences.com.
Configure the Signal Sciences agent to use DogStatsD:
Add the following line to each agent’s agent.config file:
statsd-type ="dogstatsd"
When this is done the agent’s StatsD client has tagging enabled and metrics such as sigsci.agent.signal.<SIGNAL_TYPE> are sent as sigsci.agent.signal and tagged with signal_type:<SIGNAL_TYPE>.
Example:sigsci.agent.signal.http404 => sigsci.agent.signal with tag signal_type:http404
If using Kubernetes to run the Datadog Agent, make sure to enable DogStatsD non local traffic as described in the Kubernetes DogStatsD documentation.
Configure the SigSci agent to send metrics to the Datadog Agent:
Add the following line to each agent’s agent.config file: