- Principales informations
- Getting Started
- Datadog
- Site Datadog
- DevSecOps
- Serverless for AWS Lambda
- Agent
- Intégrations
- Conteneurs
- Dashboards
- Monitors
- Logs
- Tracing
- Profileur
- Tags
- API
- Service Catalog
- Session Replay
- Continuous Testing
- Surveillance Synthetic
- Incident Management
- Database Monitoring
- Cloud Security Management
- Cloud SIEM
- Application Security Management
- Workflow Automation
- CI Visibility
- Test Visibility
- Intelligent Test Runner
- Code Analysis
- Learning Center
- Support
- Glossary
- Standard Attributes
- Guides
- Agent
- Intégrations
- OpenTelemetry
- Développeurs
- Authorization
- DogStatsD
- Checks custom
- Intégrations
- Create an Agent-based Integration
- Create an API Integration
- Create a Log Pipeline
- Integration Assets Reference
- Build a Marketplace Offering
- Create a Tile
- Create an Integration Dashboard
- Create a Recommended Monitor
- Create a Cloud SIEM Detection Rule
- OAuth for Integrations
- Install Agent Integration Developer Tool
- Checks de service
- IDE Plugins
- Communauté
- Guides
- API
- Application mobile
- CoScreen
- Cloudcraft
- In The App
- Dashboards
- Notebooks
- DDSQL Editor
- Alertes
- Infrastructure
- Métriques
- Watchdog
- Bits AI
- Service Catalog
- API Catalog
- Error Tracking
- Service Management
- Infrastructure
- Universal Service Monitoring
- Conteneurs
- Sans serveur
- Surveillance réseau
- Cloud Cost
- Application Performance
- APM
- Profileur en continu
- Database Monitoring
- Agent Integration Overhead
- Setup Architectures
- Configuration de Postgres
- Configuration de MySQL
- Configuration de SQL Server
- Setting Up Oracle
- Setting Up MongoDB
- Connecting DBM and Traces
- Données collectées
- Exploring Database Hosts
- Explorer les métriques de requête
- Explorer des échantillons de requêtes
- Dépannage
- Guides
- Data Streams Monitoring
- Data Jobs Monitoring
- Digital Experience
- RUM et Session Replay
- Product Analytics
- Surveillance Synthetic
- Continuous Testing
- Software Delivery
- CI Visibility
- CD Visibility
- Test Visibility
- Exécuteur de tests intelligent
- Code Analysis
- Quality Gates
- DORA Metrics
- Securité
- Security Overview
- Cloud SIEM
- Cloud Security Management
- Application Security Management
- AI Observability
- Log Management
- Pipelines d'observabilité
- Log Management
- Administration
LLM Observability Terms and Concepts
Cette page n'est pas encore disponible en français, sa traduction est en cours.
Si vous avez des questions ou des retours sur notre projet de traduction actuel, n'hésitez pas à nous contacter.
Si vous avez des questions ou des retours sur notre projet de traduction actuel, n'hésitez pas à nous contacter.
LLM Observability is not available in the selected site () at this time.
Overview
The LLM Observability UI provides many tools to troubleshoot conversation performance and correlate data throughout the product, enabling you to find and resolve issues in large language models (LLMs).
| Concept | Description |
|---|---|
| Spans | A span is a unit of work representing an operation in your LLM application, and is the building block of a trace. |
| Traces | A trace represents the work involved in processing a request in your LLM application, and consists of one or more nested spans. A root span is the first span in a trace, and marks the beginning and end of the trace. |
| Evaluations | Evaluations are a method for measuring the performance of your LLM application. For example, quality checks like failure to answer or topic relevancy are different types of evaluations that you can track for your LLM application. |
Spans
A span consists of the following attributes:
- Name
- Start time and duration
- Error type, message, and traceback
- Inputs and outputs, such as LLM prompts and completions
- Metadata (for example, LLM parameters such as
temperature,max_tokens) - Metrics, such as
input_tokensandoutput_tokens - Tags
Span kinds
LLM Observability categorizes spans by their span kind, which defines the type of work the span is performing. This can give you more granular insights on what operations are being performed by your LLM application.
LLM Observability supports the following span kinds:
| Kind | Represents | Valid Root span? | Examples |
|---|---|---|---|
| LLM | A call to an LLM. | Yes | A call to a model, such as OpenAI GPT-4. |
| Workflow | Any predetermined sequence of operations which include LLM calls and any surrounding contextual operations. | Yes | A service that takes a URL and returns a summary of the page, requiring a tool call to fetch the page, some text processing tasks, and an LLM summarization. |
| Agent | A series of decisions and operations made by an autonomous agent, which usually consist of nested workflows, LLMs, tools, and task calls. | Yes | A chatbot that answers customer questions. |
| Tool | A call to a program or service where the call arguments are generated by an LLM. | No | A call to a web search API or calculator. |
| Task | A standalone step that does not involve a call to an external service. | No | A data preprocessing step. |
| Embedding | A call to a model or function that returns an embedding. | No | A call to text-embedding-ada-002. |
| Retrieval | A data retrieval operation from an external knowledge base. | No | A call to a vector database that returns an array of ranked documents. |
For instructions on creating spans from your application, including code examples, see Tracing spans in the LLM Observability SDK for Python documentation.
LLM span
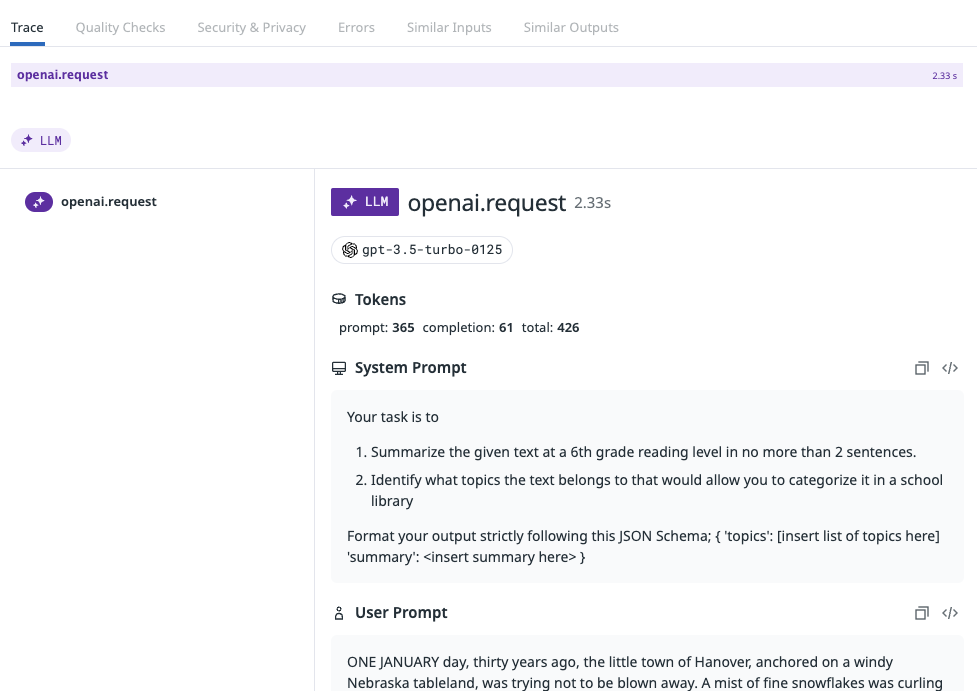
LLM spans represent a call to an LLM where input and outputs are represented as text.
A trace can contain a single LLM span, in which case the trace represents an LLM inference operation.
LLM spans typically do not have child spans, as they are standalone operations representing a direct call to an LLM.
Workflow span
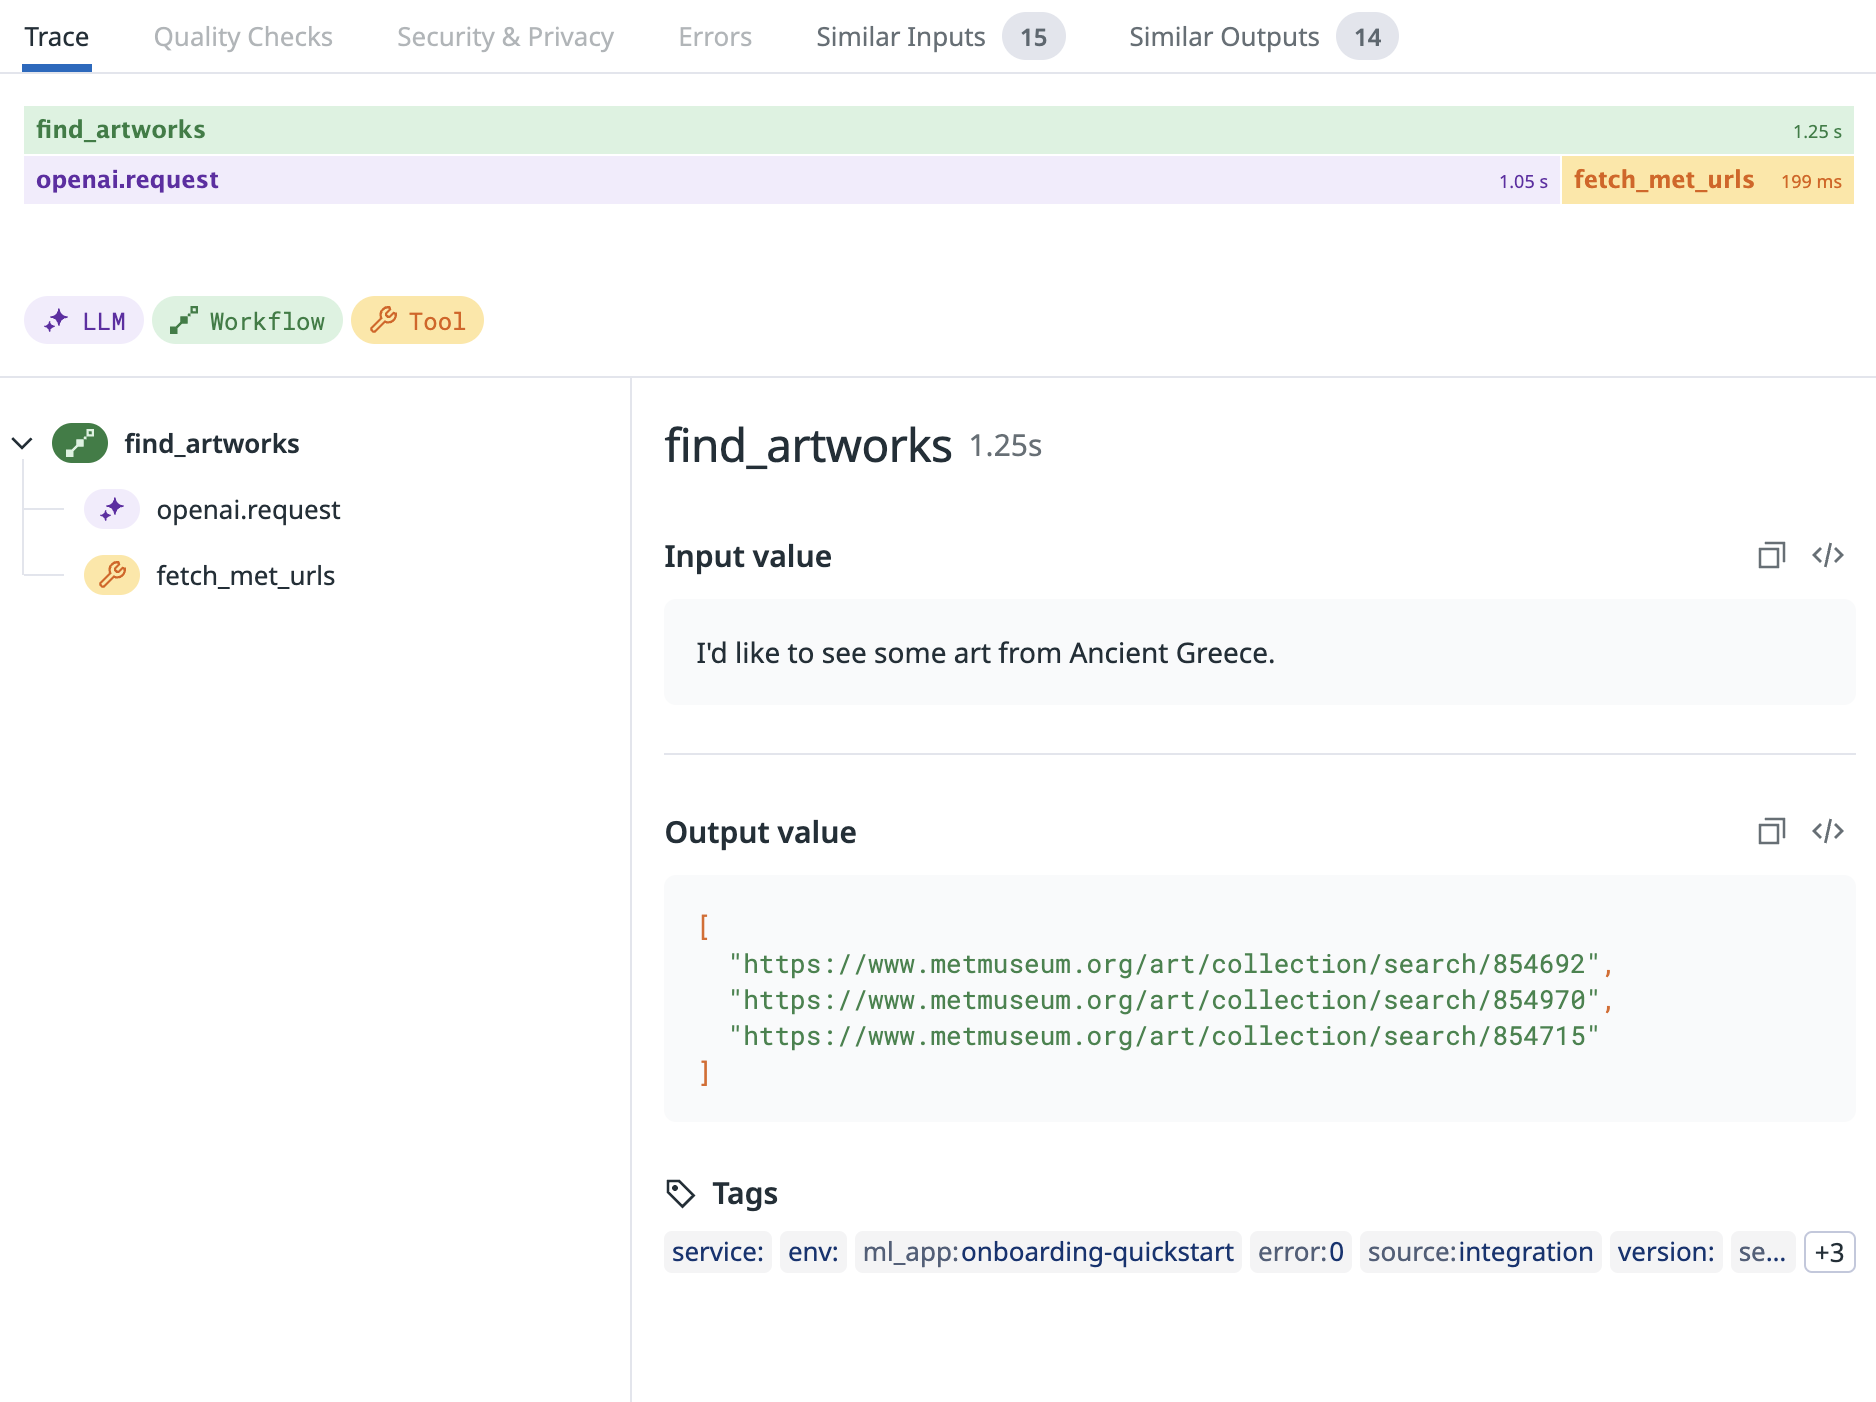
Workflow spans represent any static sequence of operations. Use workflows to group together an LLM call with its supporting contextual operations, such as tool calls, data retrievals, and other tasks.
Workflow spans are frequently the root span of a trace consisting of a standard sequence. For example, a function might take an arXiv paper link and return a summary. This process might involve a tool call to fetch the paper, some text-processing tasks, and an LLM summarization.
Workflow spans may have any spans as children, which represent child steps in the workflow sequence.
Agent span
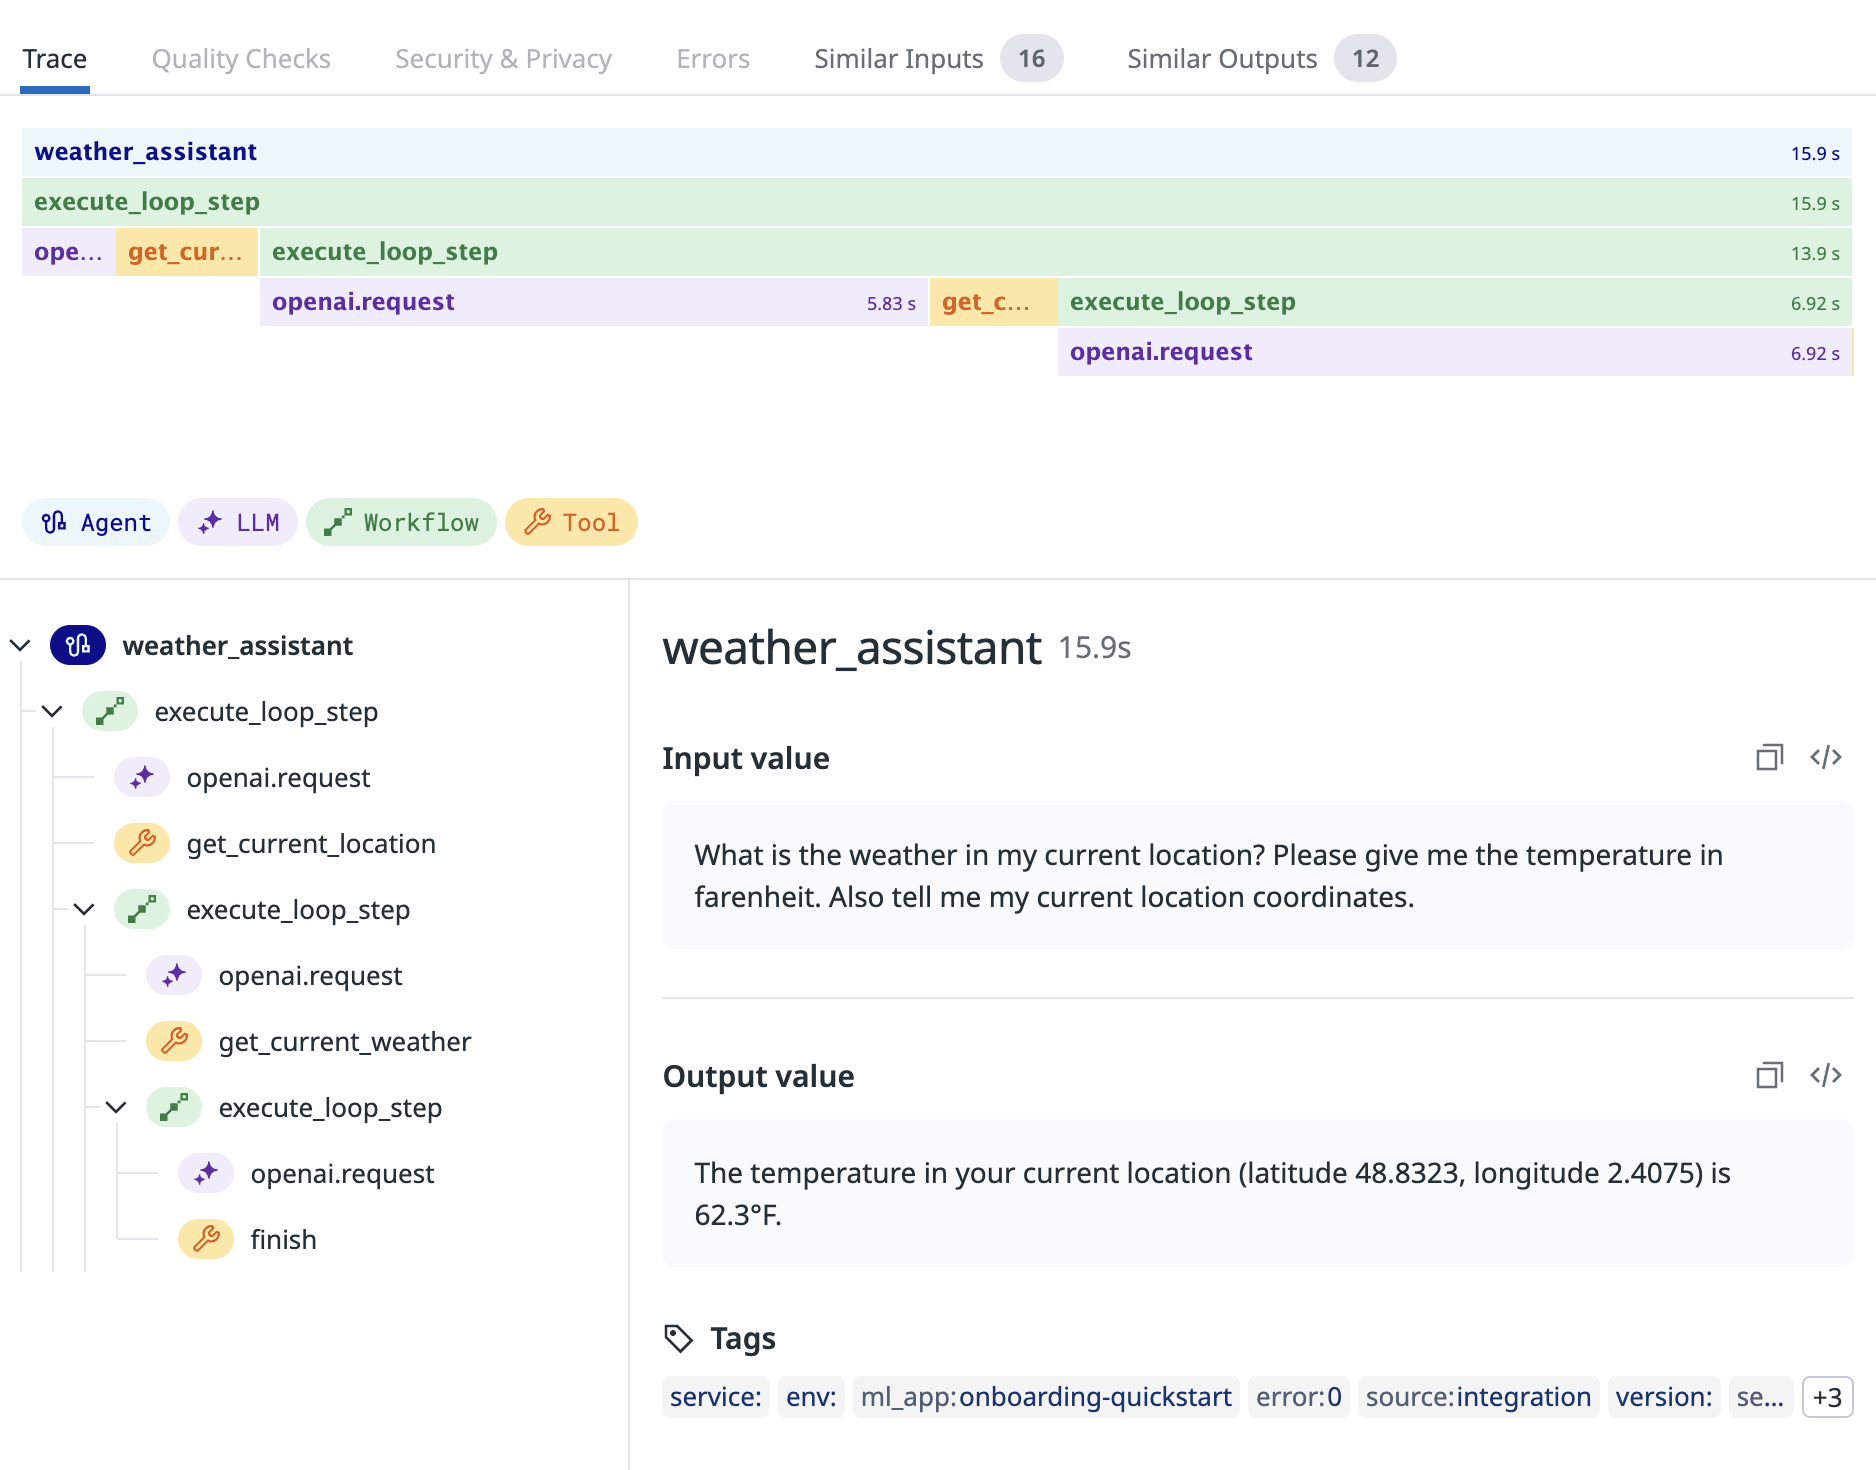
Agent spans represent a dynamic sequence of operations where a large language model determines and executes operations based on the inputs. For example, an agent span might represent a series of reasoning steps controlled by a ReAct agent.
Agent spans are frequently the root span for traces representing autonomous agents or reasoning agents.
Agent spans may have any spans as children, which represent child steps orchestrated by a reasoning engine.
Tool span
Tool spans represent a standalone step in a workflow or agent that involves a call to an external program or service, such as a web API or database.
Tool spans typically do not have child spans, as they are standalone operations representing a tool execution.
Task span
Task spans represent a standalone step in a workflow or agent that does not involve a call to an external service, such as a data sanitization step before a prompt is submitted to an LLM.
Task spans typically do not have child spans, as they are standalone steps in the workflow or agent.
Embedding span
Embedding spans are a subcategory of tool spans and represent a standalone call to an embedding model or function to create an embedding. For example, an embedding span could be used to trace a call to OpenAI’s embedding endpoint.
Embedding spans can have task spans as children, but typically do not have children.
Retrieval span
Retrieval spans are a subcategory of tool spans and represent a vector search operation involving a list of documents being returned from an external knowledge base. For example, a retrieval span could be used to trace a similarity search to a vector store to collect relevant documents for augmenting a user prompt for a given topic.
When used alongside embedding spans, retrieval spans can provide visibility into retrieval augmented generation (RAG) operations.
Retrieval spans typically do not have child spans, as they represent a standalone retrieval step.
Traces
LLM Observability supports observability for LLM applications with varying complexity. Based on the structure and complexity of your traces, you can use the following features of LLM Observability:
LLM Inference Monitoring
LLM inference traces are composed of a single LLM span.
Tracing individual LLM inferences unlocks basic LLM Observability features, allowing you to:
- Track inputs and outputs to your LLM calls.
- Track token usage, error rates, and latencies for your LLM calls.
- Break down important metrics by model and model provider.
For a detailed example, see the LLM Monitoring Jupyter notebook which demonstrates how to create and trace an LLM call.
The SDK provides integrations to automatically capture LLM calls to specific providers. See Auto-instrumentation for more information. If you are using an LLM provider that is not supported, you must manually instrument your application.
LLM Workflow Monitoring
A workflow trace is composed of a root workflow span with nested LLM, task, tool, embedding, and retrieval spans.
Most LLM applications include operations that surround LLM calls and play a large role in your overall application performance - for example, tool calls to external APIs or preprocessing task steps.
By tracing LLM calls and contextual task or tool operations together under workflow spans, you can unlock more granular insights and a more holistic view of your LLM application.
For detailed examples, see the LLM Monitoring Jupyter notebook which demonstrates how to create and trace a complex, static series of steps involving a tool call and a call to an LLM or the LLM Monitoring Jupyter notebook which demonstrates how to create, trace, and evaluate a RAG workflow.
LLM Agent Monitoring
An agent monitoring trace is composed of a root agent span with nested LLM, task, tool, embedding, retrieval, and workflow spans.
If your LLM application has complex autonomous logic, such as decision-making that can’t be captured by a static workflow, you are likely using an LLM Agent. Agents may execute multiple different workflows depending on the user input.
You can instrument your LLM application to trace and group together all workflows and contextual operations run by a single LLM agent as an agent trace.
For a detailed example, see the LLM Monitoring Jupyter notebook which demonstrates how to create and trace an LLM-powered agent that calls tools and makes decisions based on the data.
Evaluations
LLM Observability offers quality checks and out-of-the-box metrics to evaluate the quality and effectiveness of your LLM conversations, including assessments of sentiment, topic relevancy, and user satisfaction. With evaluations, you can understand the performance of conversations and enhance your LLM application’s responses. This improves the user experience and ensures valuable, accurate outputs.
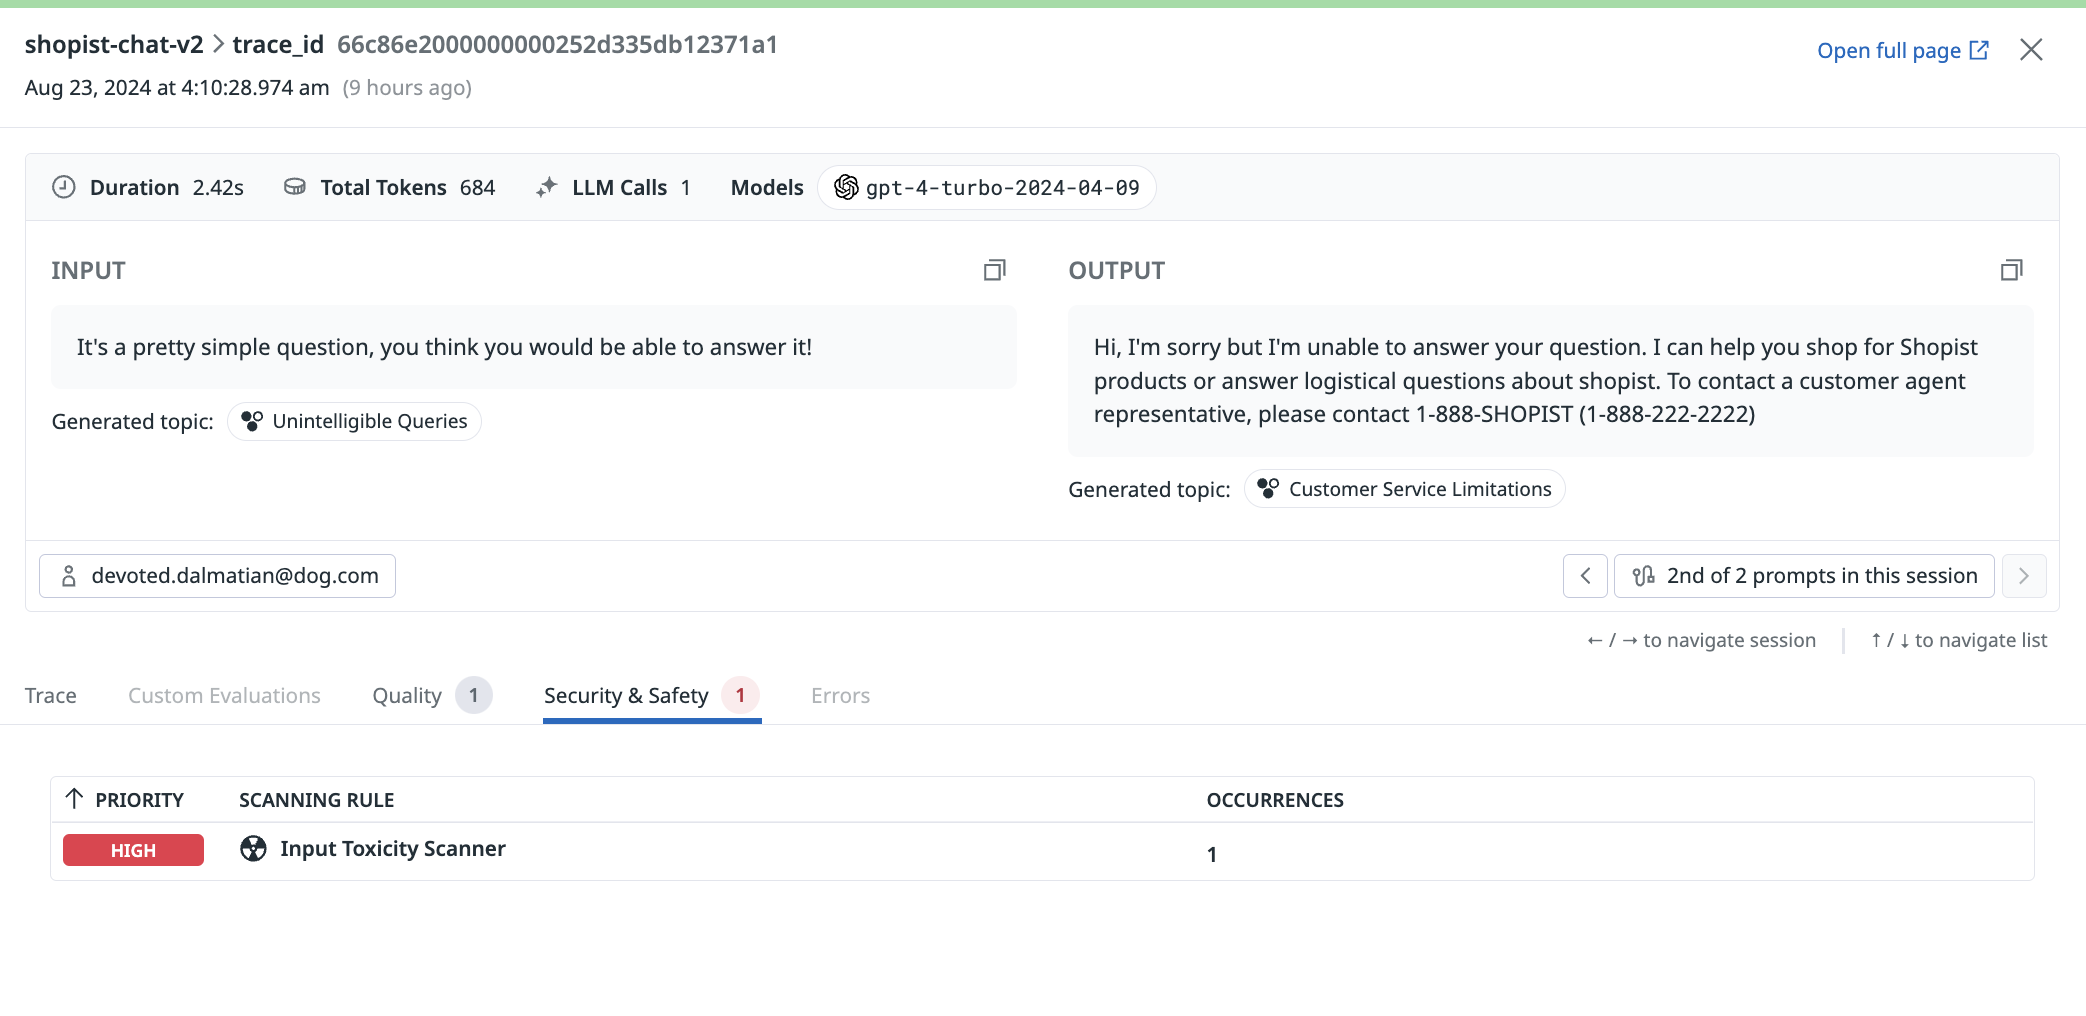
In addition to evaluating conversations, LLM Observability integrates with Sensitive Data Scanner, which helps prevent data leakage by identifying and flagging any sensitive information (such as personal data, financial details, or proprietary information) that may be present in conversations.
By proactively scanning for sensitive data, LLM Observability ensures that conversations remain secure and compliant with data protection regulations. This additional layer of security reinforces Datadog’s commitment to maintaining the confidentiality and integration of user interactions with LLMs.
LLM Observability associates evaluations with individual spans so you can view the inputs and outputs that led to a specific evaluation. While Datadog provides out-of-the-box evaluations for your traces, you can also submit your own evaluations to LLM Observability.
Quality evaluations
Topic Relevancy
This check identifies and flags user inputs that deviate from the configured acceptable input topics. This ensures that interactions stay pertinent to the LLM’s designated purpose and scope.
| Evaluation Stage | Evaluation Method | Evaluation Definition |
|---|---|---|
| Evaluated on Input | Evaluated using LLM | Topic relevancy assesses whether each prompt-response pair remains aligned with the intended subject matter of the Large Language Model (LLM) application. For instance, an e-commerce chatbot receiving a question about a pizza recipe would be flagged as irrelevant. |
Failure to Answer
This check identifies instances where the LLM fails to deliver an appropriate response, which may occur due to limitations in the LLM’s knowledge or understanding, ambiguity in the user query, or the complexity of the topic.
| Evaluation Stage | Evaluation Method | Evaluation Definition |
|---|---|---|
| Evaluated on Output | Evaluated using LLM | Failure To Answer flags whether each prompt-response pair demonstrates that the LLM application has provided a relevant and satisfactory answer to the user’s question. |
Language Mismatch
This check identifies instances where the LLM generates responses in a different language or dialect than the one used by the user, which can lead to confusion or miscommunication. This check ensures that the LLM’s responses are clear, relevant, and appropriate for the user’s linguistic preferences and needs.
| Evaluation Stage | Evaluation Method | Evaluation Definition |
|---|---|---|
| Evaluated on Input and Output | Evaluated using Open Source Model | Language Mismatch flags whether each prompt-response pair demonstrates that the LLM application answered the user’s question in the same language that the user used. |
Sentiment
This check helps understand the overall mood of the conversation, gauge user satisfaction, identify sentiment trends, and interpret emotional responses. This check accurately classifies the sentiment of the text, providing insights to improve user experiences and tailor responses to better meet user needs.
| Evaluation Stage | Evaluation Method | Evaluation Definition |
|---|---|---|
| Evaluated on Input and Output | Evaluated using LLM | Sentiment flags the emotional tone or attitude expressed in the text, categorizing it as positive, negative, or neutral. |
Security and Safety evaluations
Toxicity
This check evaluates each input prompt from the user and the response from the LLM application for toxic content. This check identifies and flags toxic content to ensure that interactions remain respectful and safe.
| Evaluation Stage | Evaluation Method | Evaluation Definition |
|---|---|---|
| Evaluated on Input and Output | Evaluated using LLM | Toxicity flags any language or behavior that is harmful, offensive, or inappropriate, including but not limited to hate speech, harassment, threats, and other forms of harmful communication. |
Prompt Injection
This check identifies attempts by unauthorized or malicious authors to manipulate the LLM’s responses or redirect the conversation in ways not intended by the original author. This check maintains the integrity and authenticity of interactions between users and the LLM.
| Evaluation Stage | Evaluation Method | Evaluation Definition |
|---|---|---|
| Evaluated on Input | Evaluated using LLM | Prompt Injection flags any unauthorized or malicious insertion of prompts or cues into the conversation by an external party or user. |
Sensitive Data Scanning
This check ensures that sensitive information is handled appropriately and securely, reducing the risk of data breaches or unauthorized access.
| Evaluation Stage | Evaluation Method | Evaluation Definition |
|---|---|---|
| Evaluated on Input and Output | Sensitive Data Scanner | Powered by the Sensitive Data Scanner, LLM Observability scans, identifies, and redacts sensitive information within every LLM application’s prompt-response pairs. This includes personal information, financial data, health records, or any other data that requires protection due to privacy or security concerns. |
Further Reading
Documentation, liens et articles supplémentaires utiles:


