- Principales informations
- Getting Started
- Datadog
- Site Datadog
- DevSecOps
- Serverless for AWS Lambda
- Agent
- Intégrations
- Conteneurs
- Dashboards
- Monitors
- Logs
- Tracing
- Profileur
- Tags
- API
- Service Catalog
- Session Replay
- Continuous Testing
- Surveillance Synthetic
- Incident Management
- Database Monitoring
- Cloud Security Management
- Cloud SIEM
- Application Security Management
- Workflow Automation
- CI Visibility
- Test Visibility
- Intelligent Test Runner
- Code Analysis
- Learning Center
- Support
- Glossary
- Standard Attributes
- Guides
- Agent
- Intégrations
- OpenTelemetry
- Développeurs
- Authorization
- DogStatsD
- Checks custom
- Intégrations
- Create an Agent-based Integration
- Create an API Integration
- Create a Log Pipeline
- Integration Assets Reference
- Build a Marketplace Offering
- Create a Tile
- Create an Integration Dashboard
- Create a Recommended Monitor
- Create a Cloud SIEM Detection Rule
- OAuth for Integrations
- Install Agent Integration Developer Tool
- Checks de service
- IDE Plugins
- Communauté
- Guides
- API
- Application mobile
- CoScreen
- Cloudcraft
- In The App
- Dashboards
- Notebooks
- DDSQL Editor
- Alertes
- Infrastructure
- Métriques
- Watchdog
- Bits AI
- Service Catalog
- API Catalog
- Error Tracking
- Service Management
- Infrastructure
- Universal Service Monitoring
- Conteneurs
- Sans serveur
- Surveillance réseau
- Cloud Cost
- Application Performance
- APM
- Profileur en continu
- Database Monitoring
- Agent Integration Overhead
- Setup Architectures
- Configuration de Postgres
- Configuration de MySQL
- Configuration de SQL Server
- Setting Up Oracle
- Setting Up MongoDB
- Connecting DBM and Traces
- Données collectées
- Exploring Database Hosts
- Explorer les métriques de requête
- Explorer des échantillons de requêtes
- Dépannage
- Guides
- Data Streams Monitoring
- Data Jobs Monitoring
- Digital Experience
- RUM et Session Replay
- Product Analytics
- Surveillance Synthetic
- Continuous Testing
- Software Delivery
- CI Visibility
- CD Visibility
- Test Visibility
- Exécuteur de tests intelligent
- Code Analysis
- Quality Gates
- DORA Metrics
- Securité
- Security Overview
- Cloud SIEM
- Cloud Security Management
- Application Security Management
- AI Observability
- Log Management
- Pipelines d'observabilité
- Log Management
- Administration
Monitoring Performance Vitals
Cette page n'est pas encore disponible en français, sa traduction est en cours.
Si vous avez des questions ou des retours sur notre projet de traduction actuel, n'hésitez pas à nous contacter.
Si vous avez des questions ou des retours sur notre projet de traduction actuel, n'hésitez pas à nous contacter.
Overview
RUM Vitals helps you find the true root cause of browser performance issues based on real user traffic. You can troubleshoot browser metrics, including the Core Web Vitals (CWV), Loading Time (Datadog’s custom metric that evaluates how long it takes for a page to fully load from the user’s perspective), and more. Determine what caused a slow page, with all the relevant information in one place.
Prerequisites
To get the most out of this feature, Datadog recommends that you use:
- RUM Browser SDK version 5.4.0 or newer
- Session Replay for at least some sessions
Select a vital
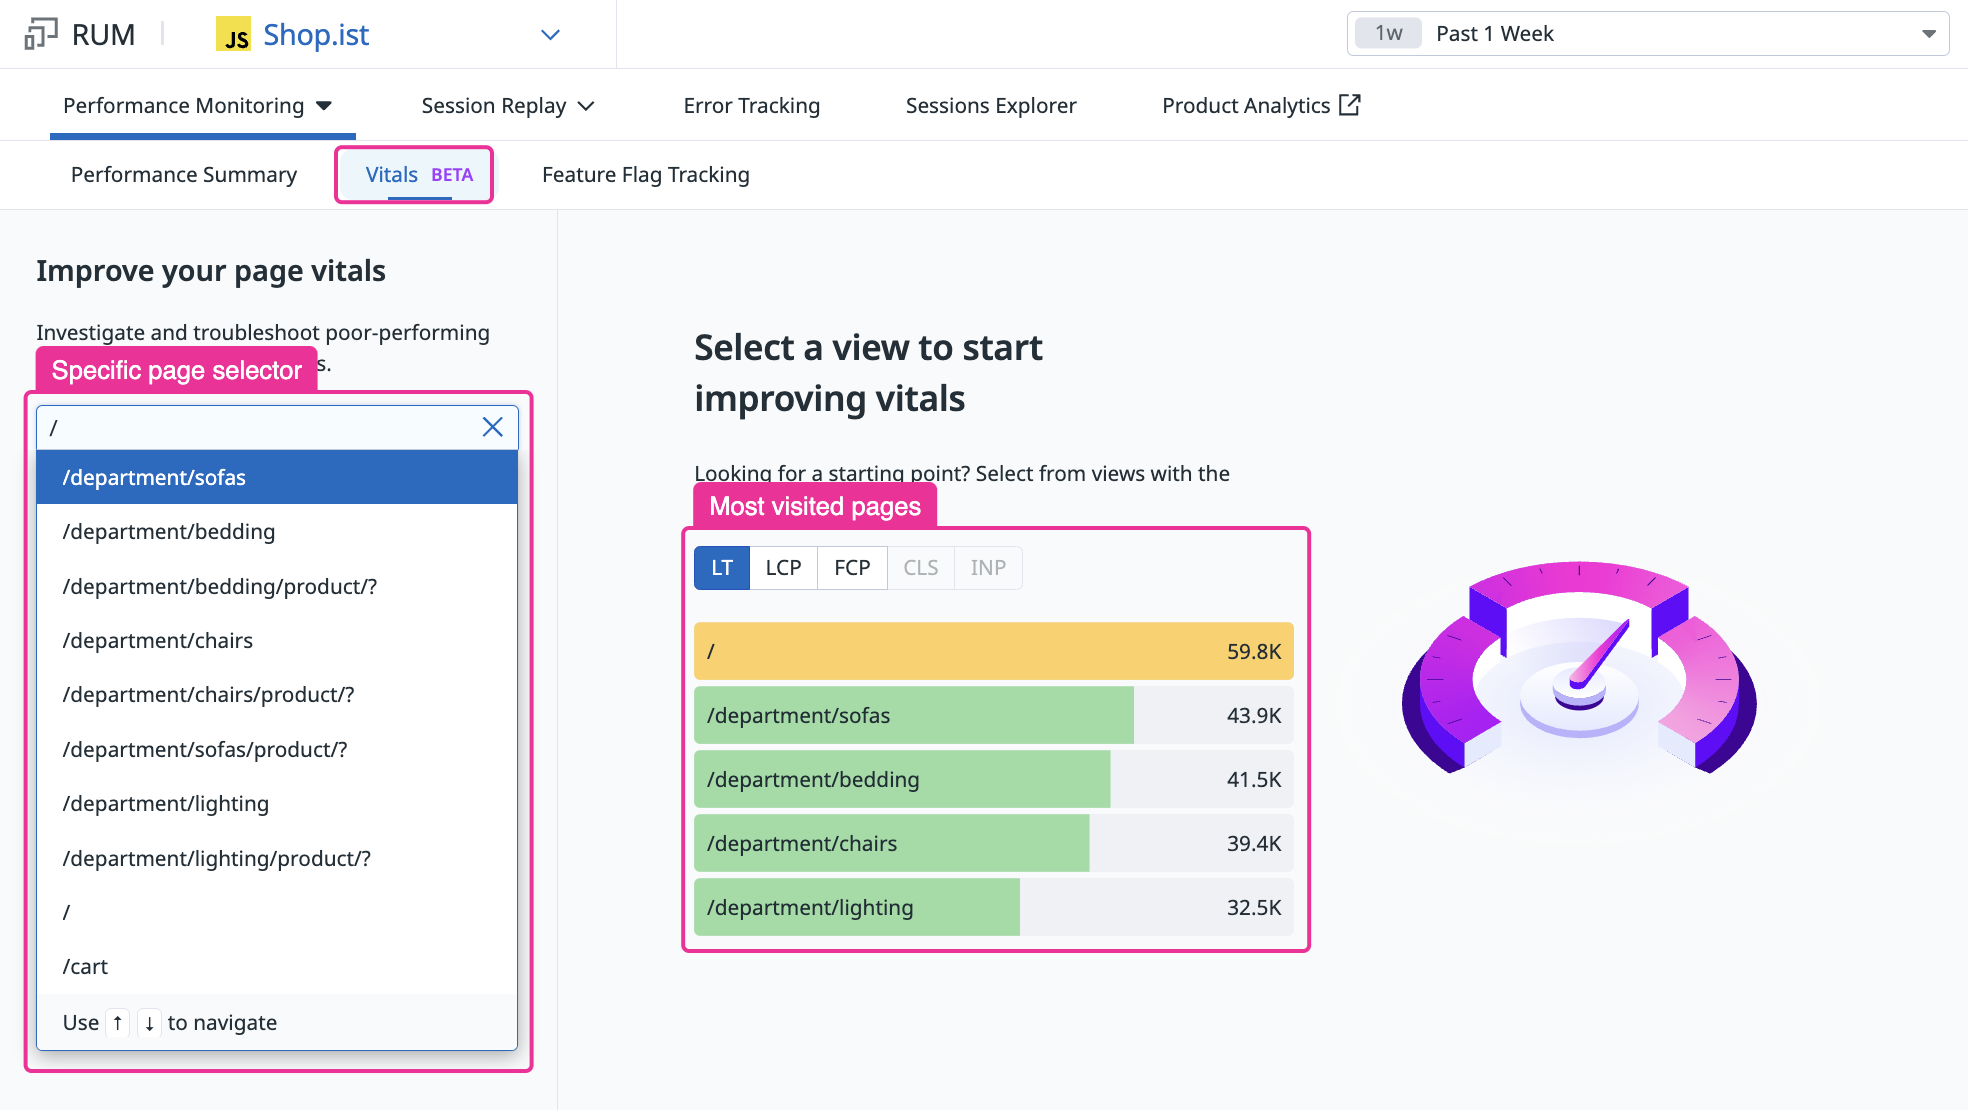
Navigate to the Vitals page, or click the “Vitals” tab under the Digital Experience > Performance Monitoring page.
From this view, you have two ways of selecting the page and vital to review and optimize:
- Select from a list of the most visited pages
- Enter a view name on the left and select the page
Filter and evaluate
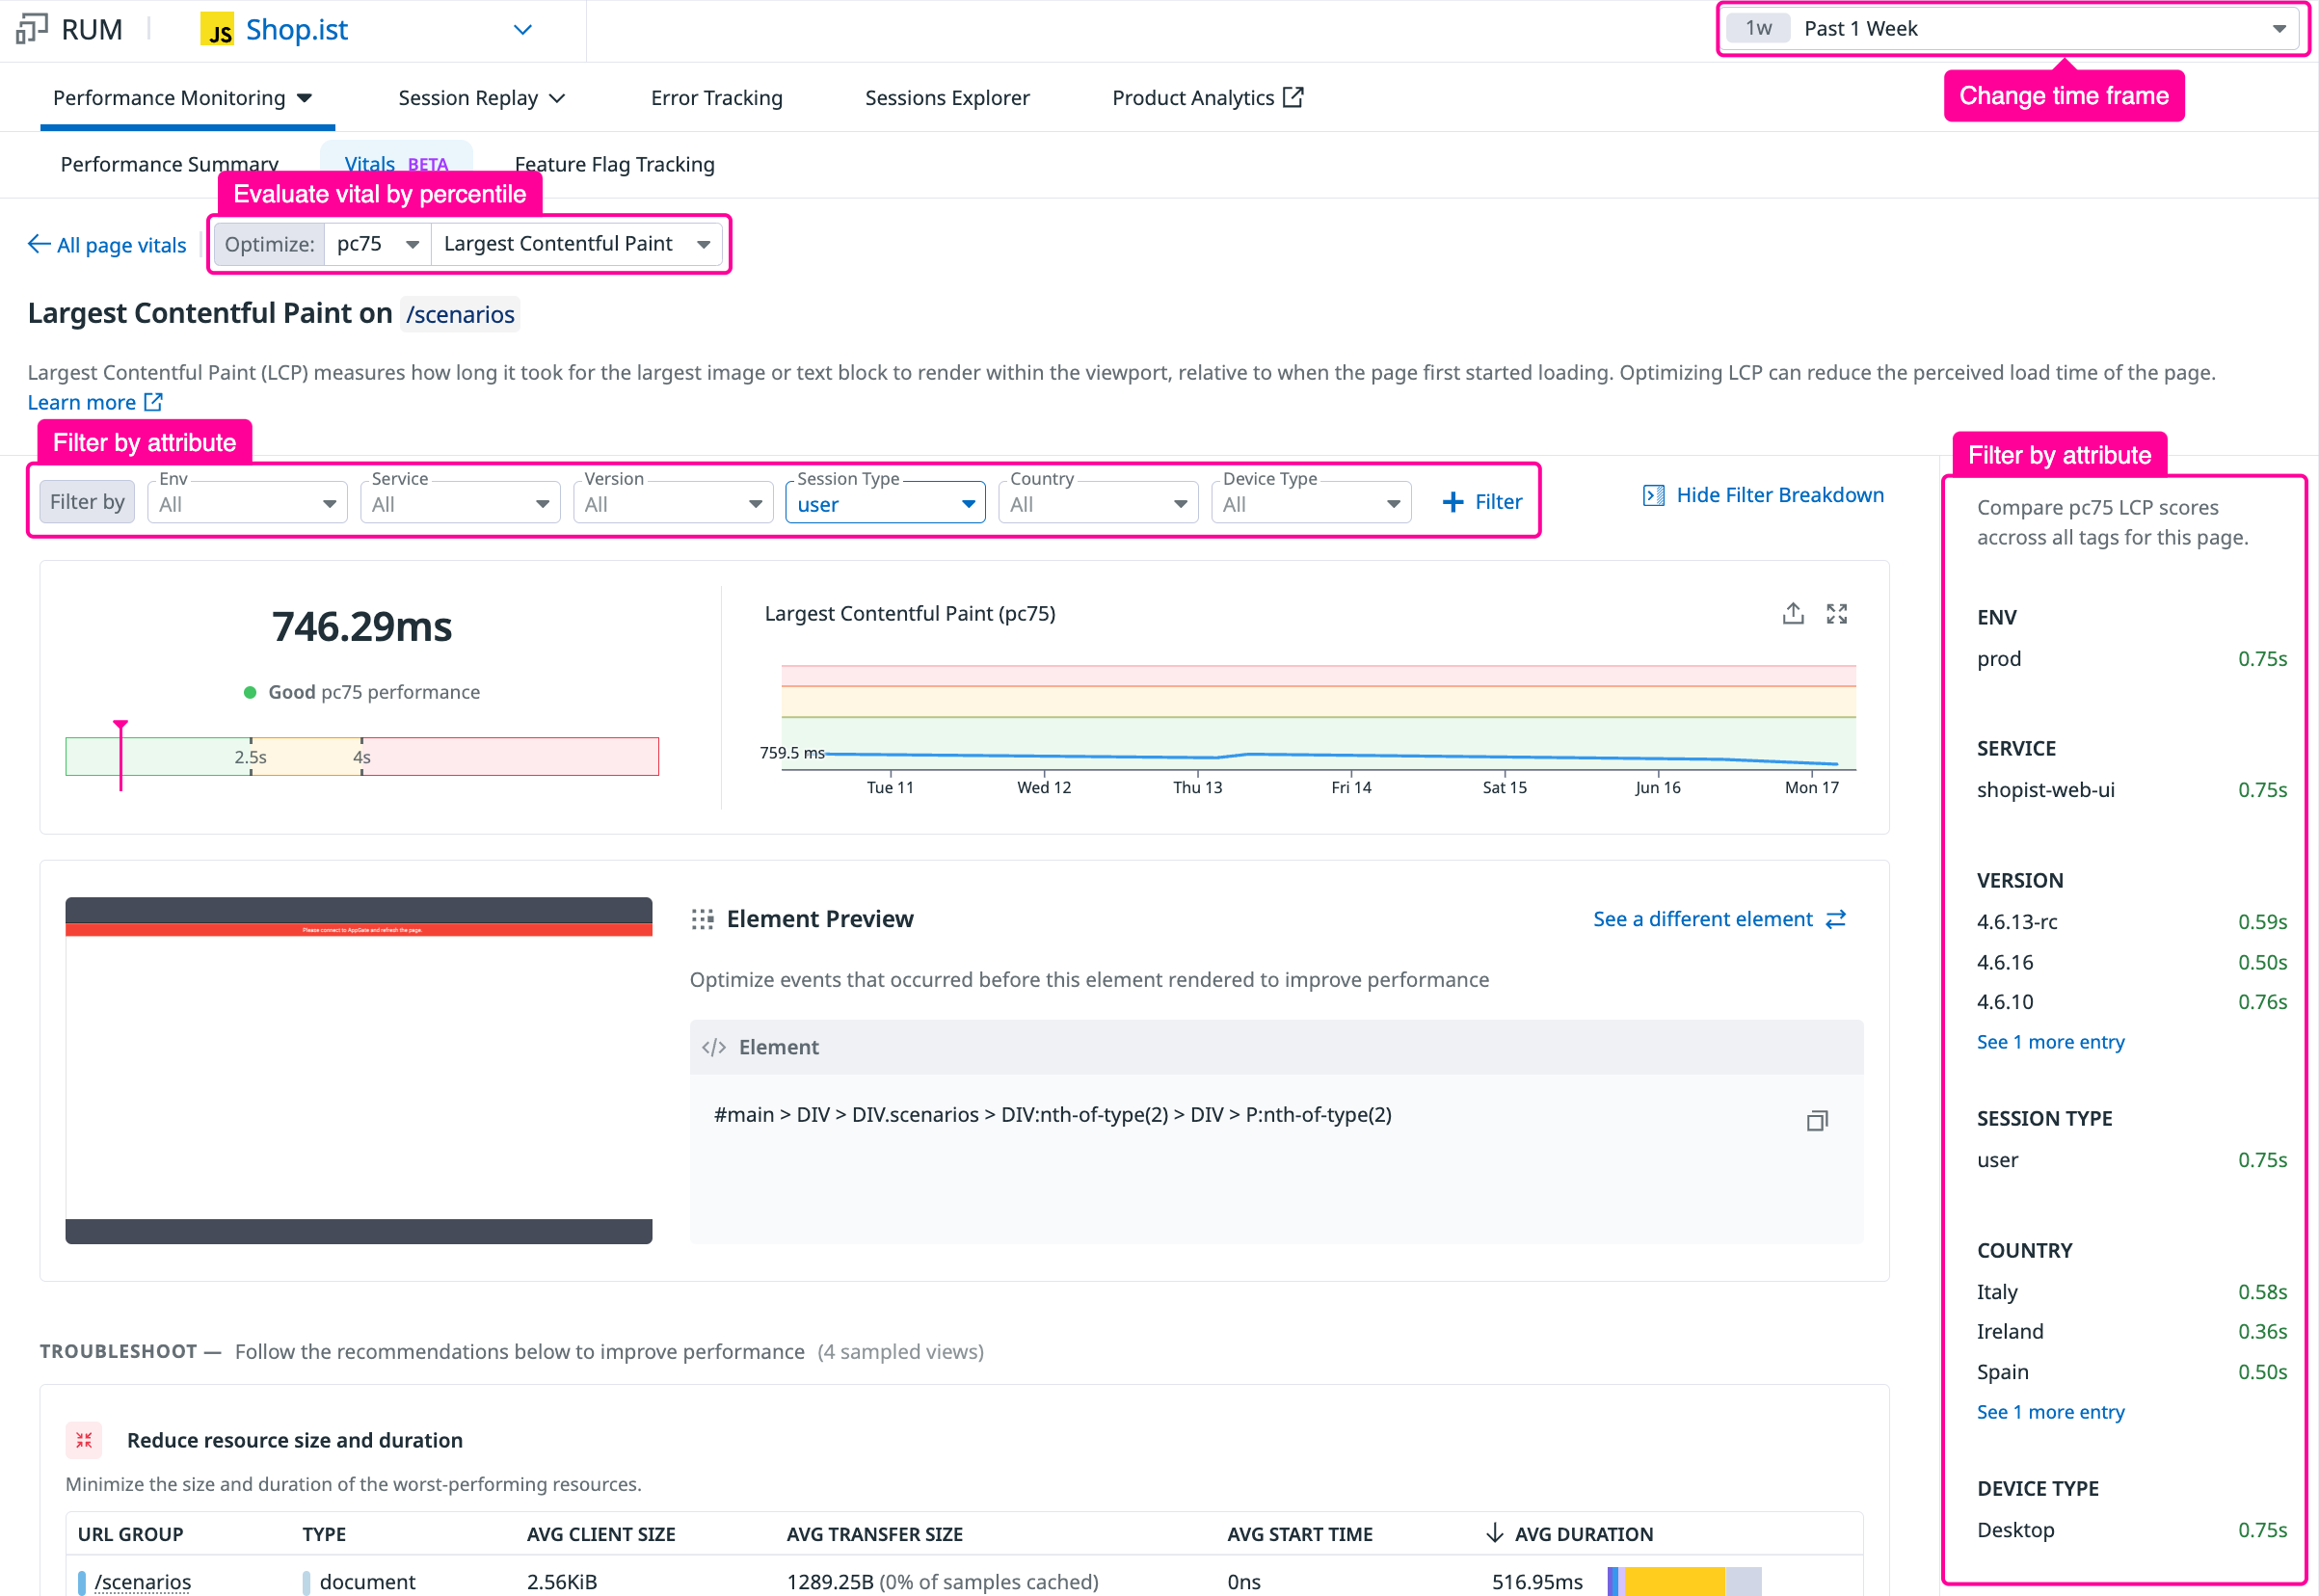
After you’ve selected a page and vital, you can see insights that explain their performance.
From here, you can:
- Change the time frame in the upper right
- Filter by different attributes using the dropdown buttons
- Filter by selecting a group from the breakdown on the right (“Show Filter Breakdown”)
- Select the percentile at which to evaluate your vital
In the example below, a pc75 evaluation means that the displayed value is at the 75th percentile of views in the selected filters. Pc75 is the typical percentile used to evaluate CWV for a given page.
Visualize the user’s experience
The next part of the page helps you visualize exactly what your users are experiencing.
Based on the selected time period and traffic, RUM Vitals highlights the most typical example of what users see on the page when the selected vital is captured. If you use Session Replay, this is where you see a visual of the page.
For some vitals, you can also select other versions of the page to investigate by clicking “See a different element”.
Troubleshoot resources and errors
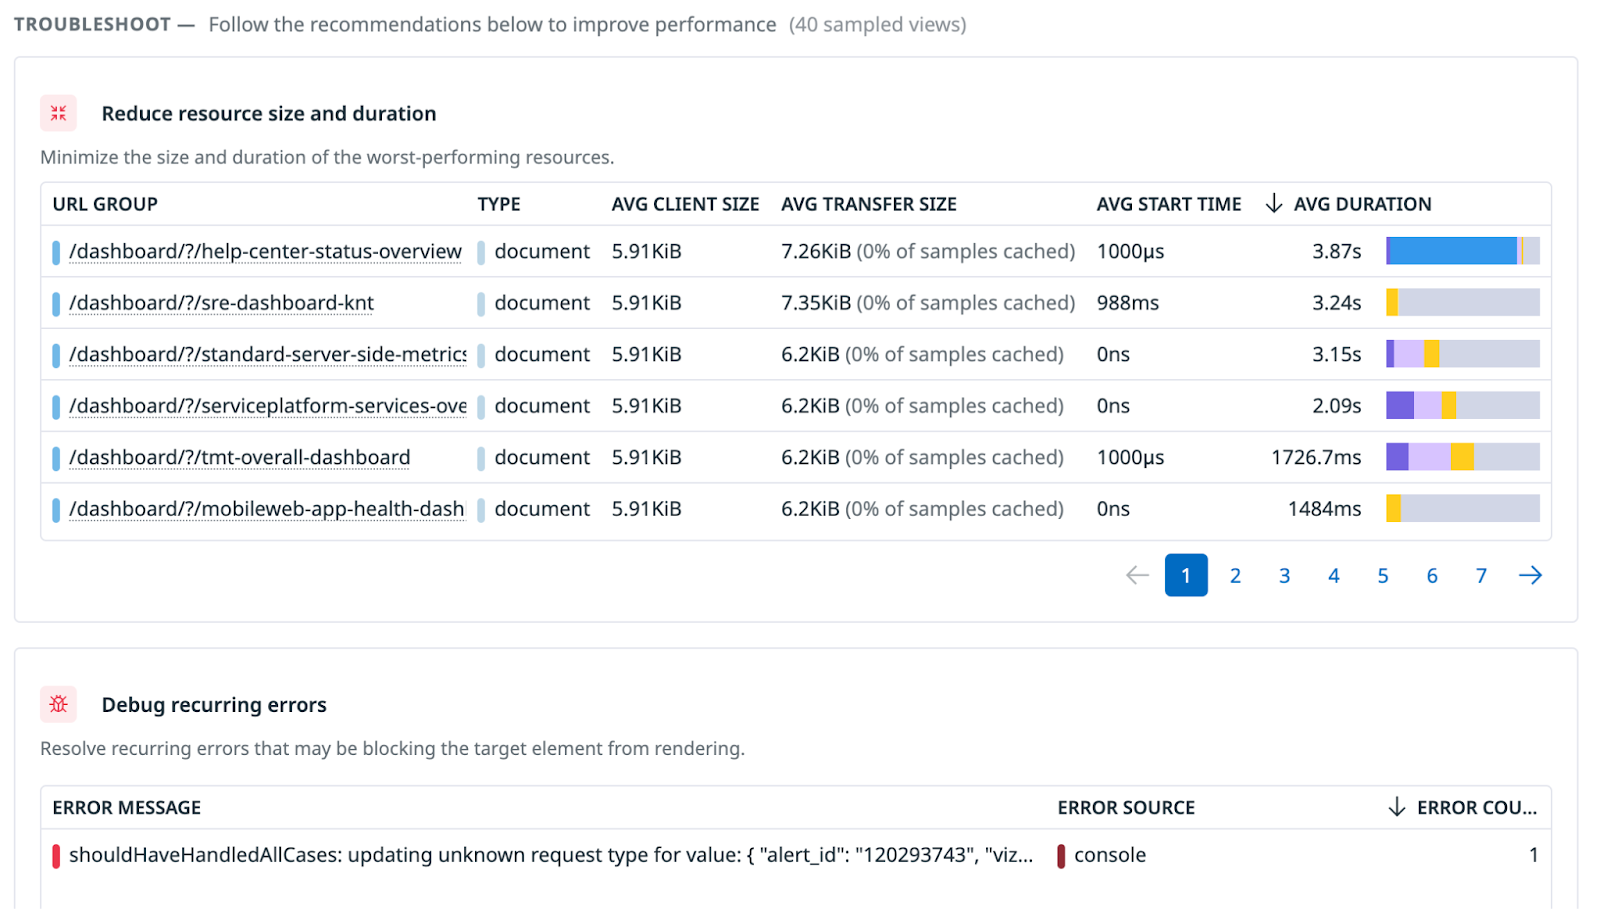
In the troubleshooting section, you can see resources and errors that occurred on the page that may have affected the vital’s performance. For example, for Largest Contentful Paint (LCP), you can see resources that were loaded before the LCP was triggered. Since LCP is an indicator of how long the largest element takes to load on the page, you could investigate the following:
- Anything that happens before then could be causing slowness or rendering issues
- Resources that are particularly slow or large could be contributing to performance issues
- Recurring errors could be causing problems as well
View event samples
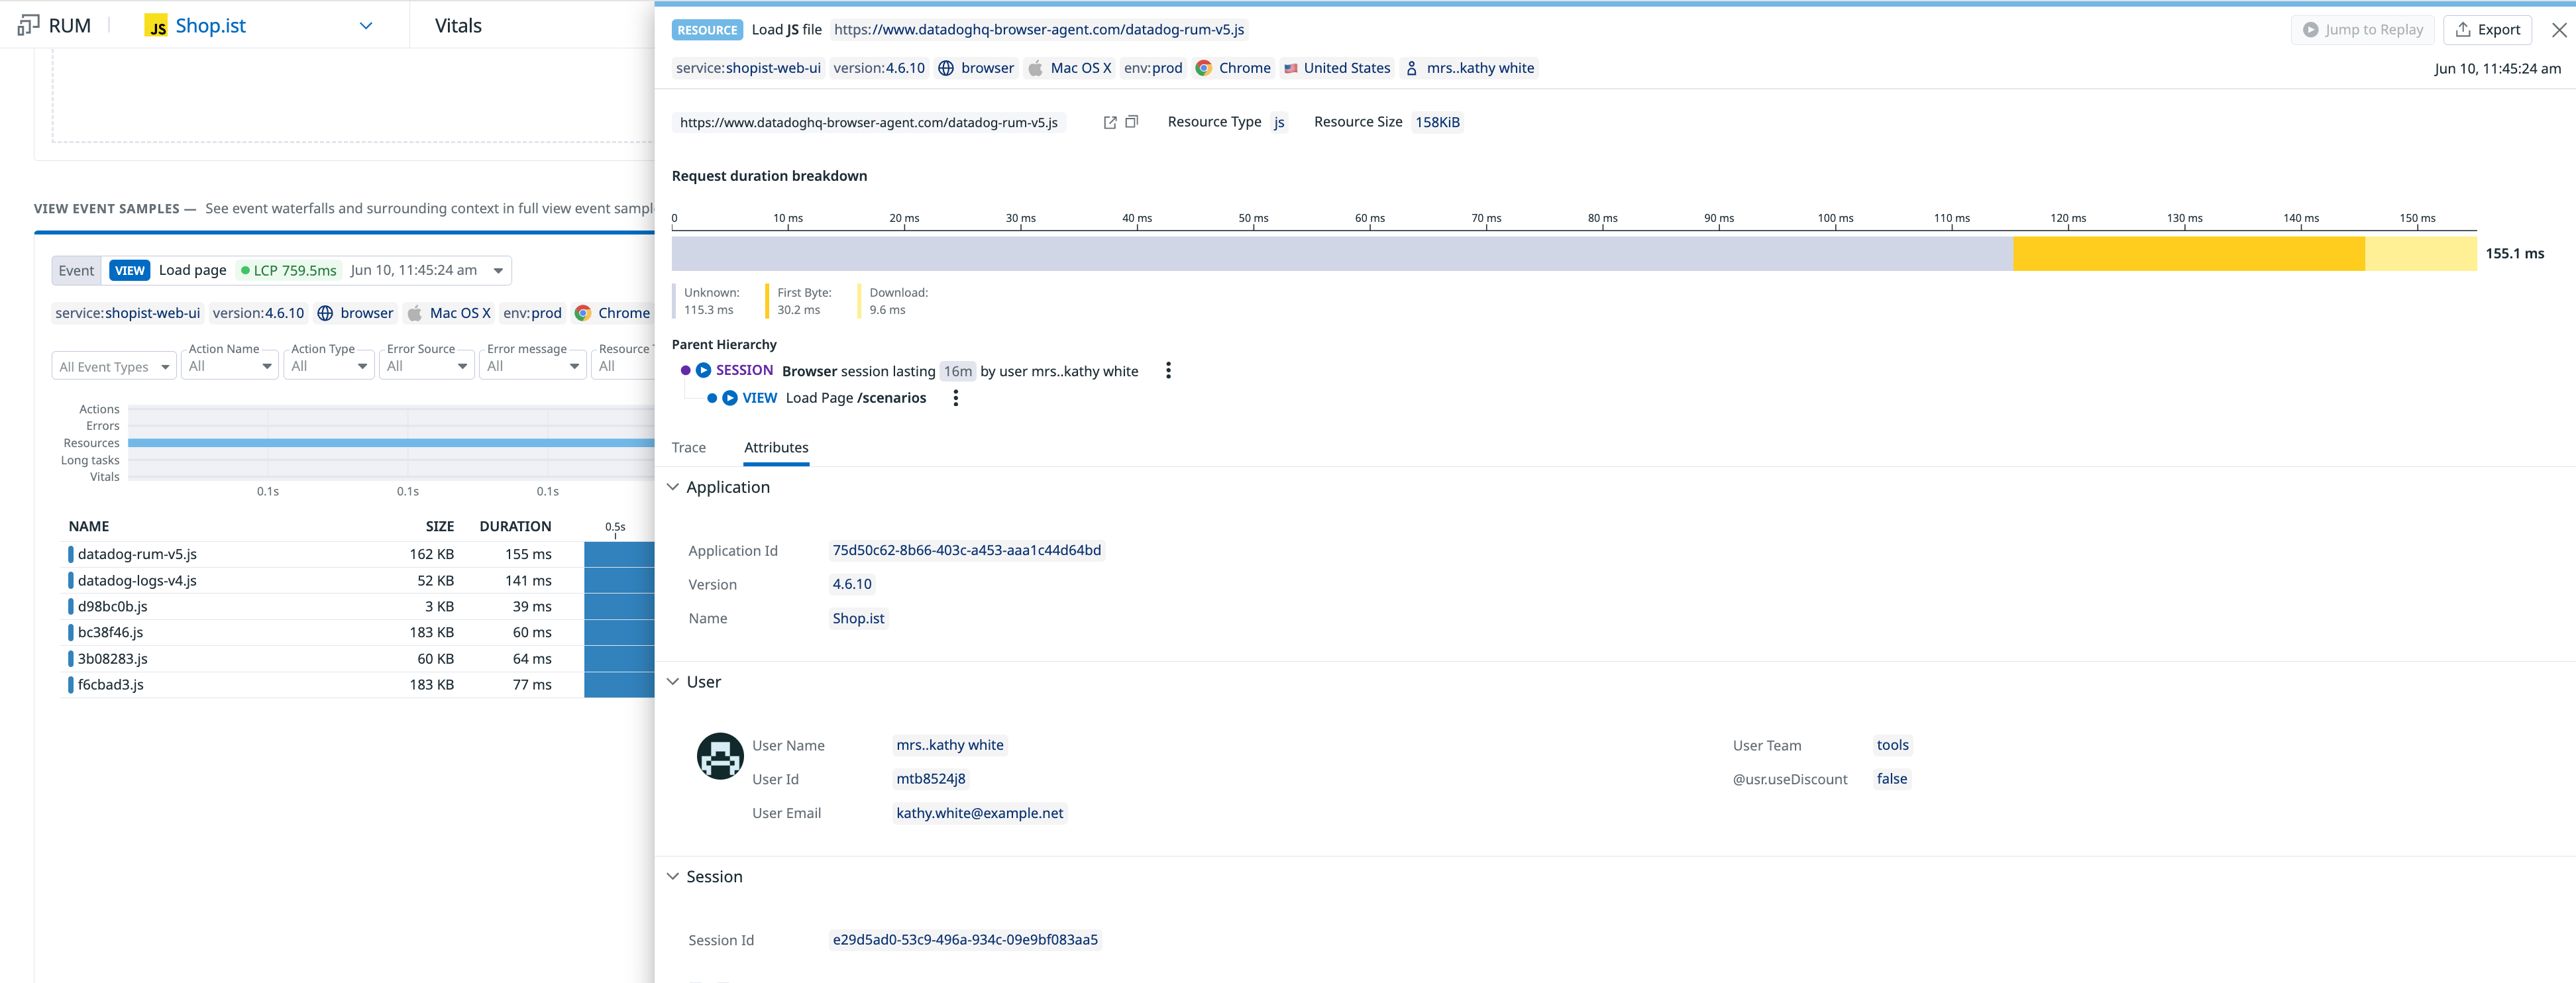
To see everything in context with the rest of the page activity, scroll down to the waterfall and timeline of events. The waterfall shows the event timeline up until the moment the vital was captured.
You can select another sample event using the dropdown in the top left, and expand any event in the waterfall by clicking it to see the side panel, as shown below.
Further Reading
Documentation, liens et articles supplémentaires utiles:


