- Essentials
- Getting Started
- Datadog
- Datadog Site
- DevSecOps
- Serverless for AWS Lambda
- Agent
- Integrations
- Containers
- Dashboards
- Monitors
- Logs
- APM Tracing
- Profiler
- Tags
- API
- Service Catalog
- Session Replay
- Continuous Testing
- Synthetic Monitoring
- Incident Management
- Database Monitoring
- Cloud Security Management
- Cloud SIEM
- Application Security Management
- Workflow Automation
- CI Visibility
- Test Visibility
- Test Impact Analysis
- Code Analysis
- Learning Center
- Support
- Glossary
- Standard Attributes
- Guides
- Agent
- Integrations
- OpenTelemetry
- Developers
- Authorization
- DogStatsD
- Custom Checks
- Integrations
- Create an Agent-based Integration
- Create an API Integration
- Create a Log Pipeline
- Integration Assets Reference
- Build a Marketplace Offering
- Create a Tile
- Create an Integration Dashboard
- Create a Recommended Monitor
- Create a Cloud SIEM Detection Rule
- OAuth for Integrations
- Install Agent Integration Developer Tool
- Service Checks
- IDE Plugins
- Community
- Guides
- Administrator's Guide
- API
- Datadog Mobile App
- CoScreen
- Cloudcraft
- In The App
- Dashboards
- Notebooks
- DDSQL Editor
- Sheets
- Monitors and Alerting
- Infrastructure
- Metrics
- Watchdog
- Bits AI
- Service Catalog
- API Catalog
- Error Tracking
- Service Management
- Infrastructure
- Application Performance
- APM
- Continuous Profiler
- Database Monitoring
- Data Streams Monitoring
- Data Jobs Monitoring
- Digital Experience
- Real User Monitoring
- Product Analytics
- Synthetic Testing and Monitoring
- Continuous Testing
- Software Delivery
- CI Visibility
- CD Visibility
- Test Optimization
- Code Analysis
- Quality Gates
- DORA Metrics
- Security
- Security Overview
- Cloud SIEM
- Cloud Security Management
- Application Security Management
- AI Observability
- Log Management
- Observability Pipelines
- Log Management
- Administration
Getting Started with Database Monitoring
Overview
Datadog Database Monitoring helps you to better understand the health and performance of your databases and to determine the root cause of any problems.
In one place, you can view:
- Host-level metrics
- Explain plans
- Historical query performance metrics
Work through this guide to set up Datadog Database Monitoring on an example PostgreSQL database. Next, identify an expensive query, troubleshoot a slow query, and create a dashboard to view changes in query volume.
Setup
Prerequisites
Before getting started, you need a Datadog account.
To run the example application, you need a machine with GNU Make and Docker. Have your Datadog API key available.
Install the example application
The example application starts up the Datadog Agent and a PostgreSQL database in a Docker container. While the application runs, the Agent sends database metrics to Datadog. You can view the data from the application in Datadog Database Monitoring.
Follow these instructions to install the example application on MacOS or Linux.
Clone the repository containing the example application:
git clone https://github.com/DataDog/dd-database-monitoring-exampleChange to the
dd-database-monitoring-exampledirectory:cd dd-database-monitoring-exampleSet the environment variable
DD_API_KEYto your Datadog API key:export DD_API_KEY=<API_KEY>Start the application:
make postgres
The command continues to run until you stop it by pressing Ctrl + C.
Identify an expensive query
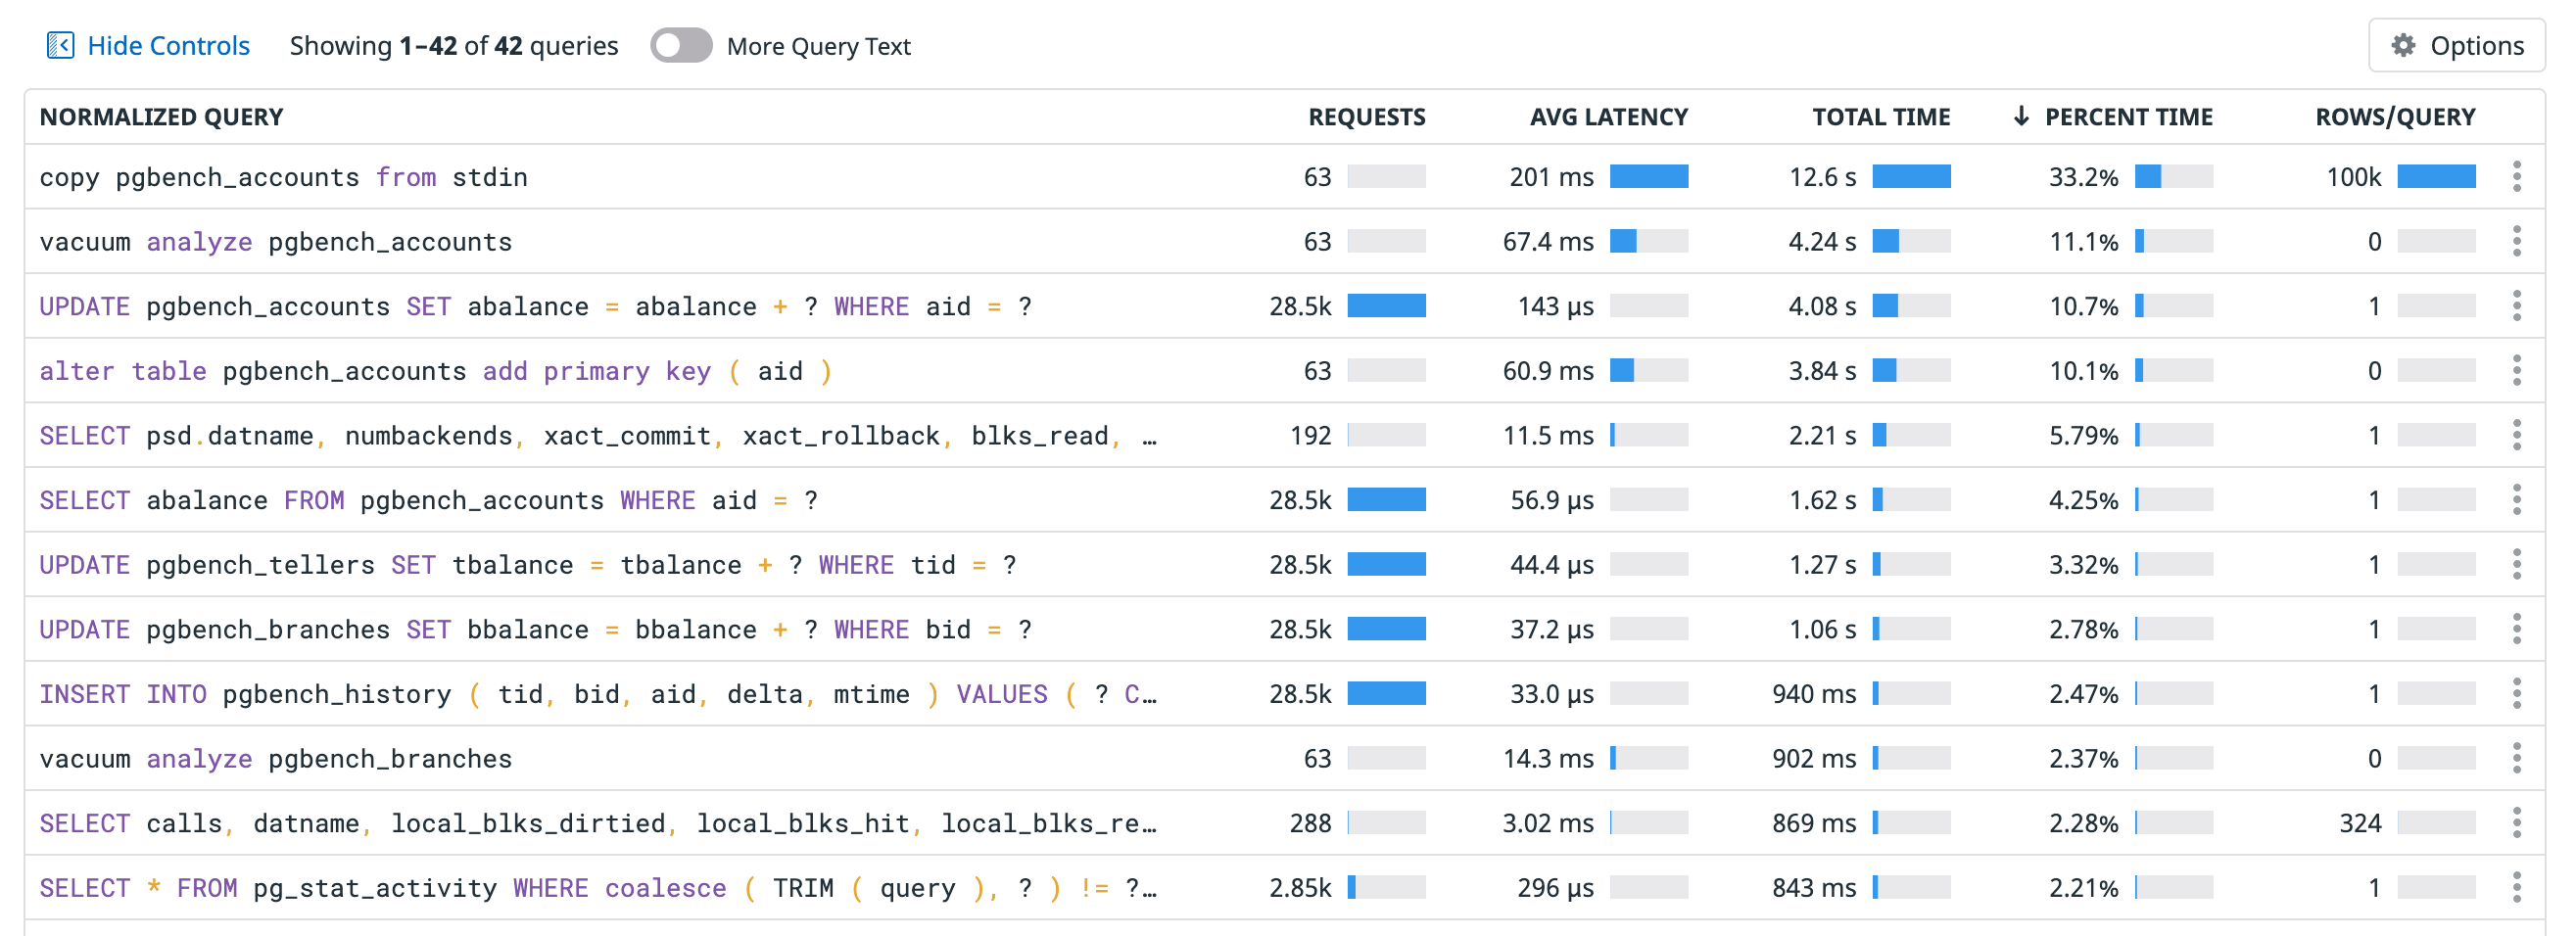
Which query consumes the most database time? To find out, use the Query Metrics view.
On the Database Monitoring page, click the Query metrics tab in the UI.
Sort the Normalized Query table by Percent time to see the query that the database spends the most time executing.
The query that consumes the most database time appears on the first line:
Troubleshoot a slow query
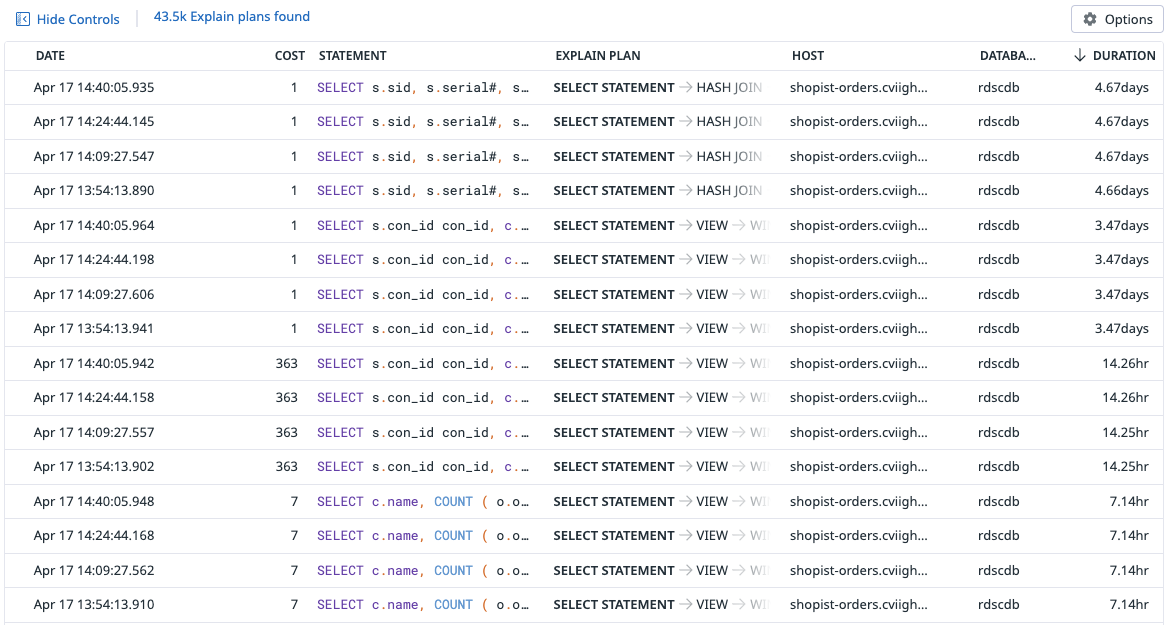
In addition to identifying slow queries, Datadog Database Monitoring can help you diagnose them. A query’s Explain Plan describes the steps that the database takes to resolve the query. View an Explain Plan by clicking on a sample in the Query Samples view.
Navigate to the Query Samples view within Database Monitoring by selecting the Samples tab.
In the In dropdown, select Explain Plans.
Sort the Normalized Query table by Duration.
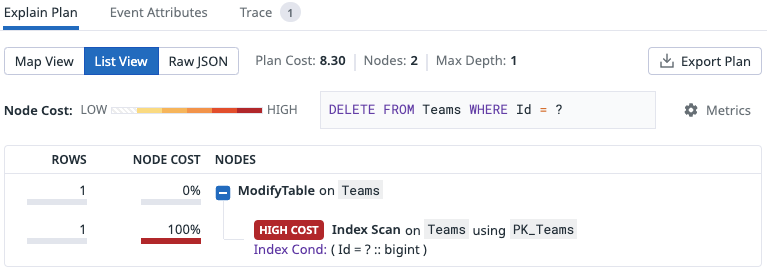
Find a query in the table with data in the Explain Plan column and click on it to open the Sample Details page.
Under Explain Plan, click List View. This Explain Plan at the bottom of the Explain Plan Sample page shows that the query requires an Index Scan.
Visualize database health and performance
To understand the health and performance of your databases at a glance, add Datadog Database Monitoring metrics to a dashboard.
View changes in query volume
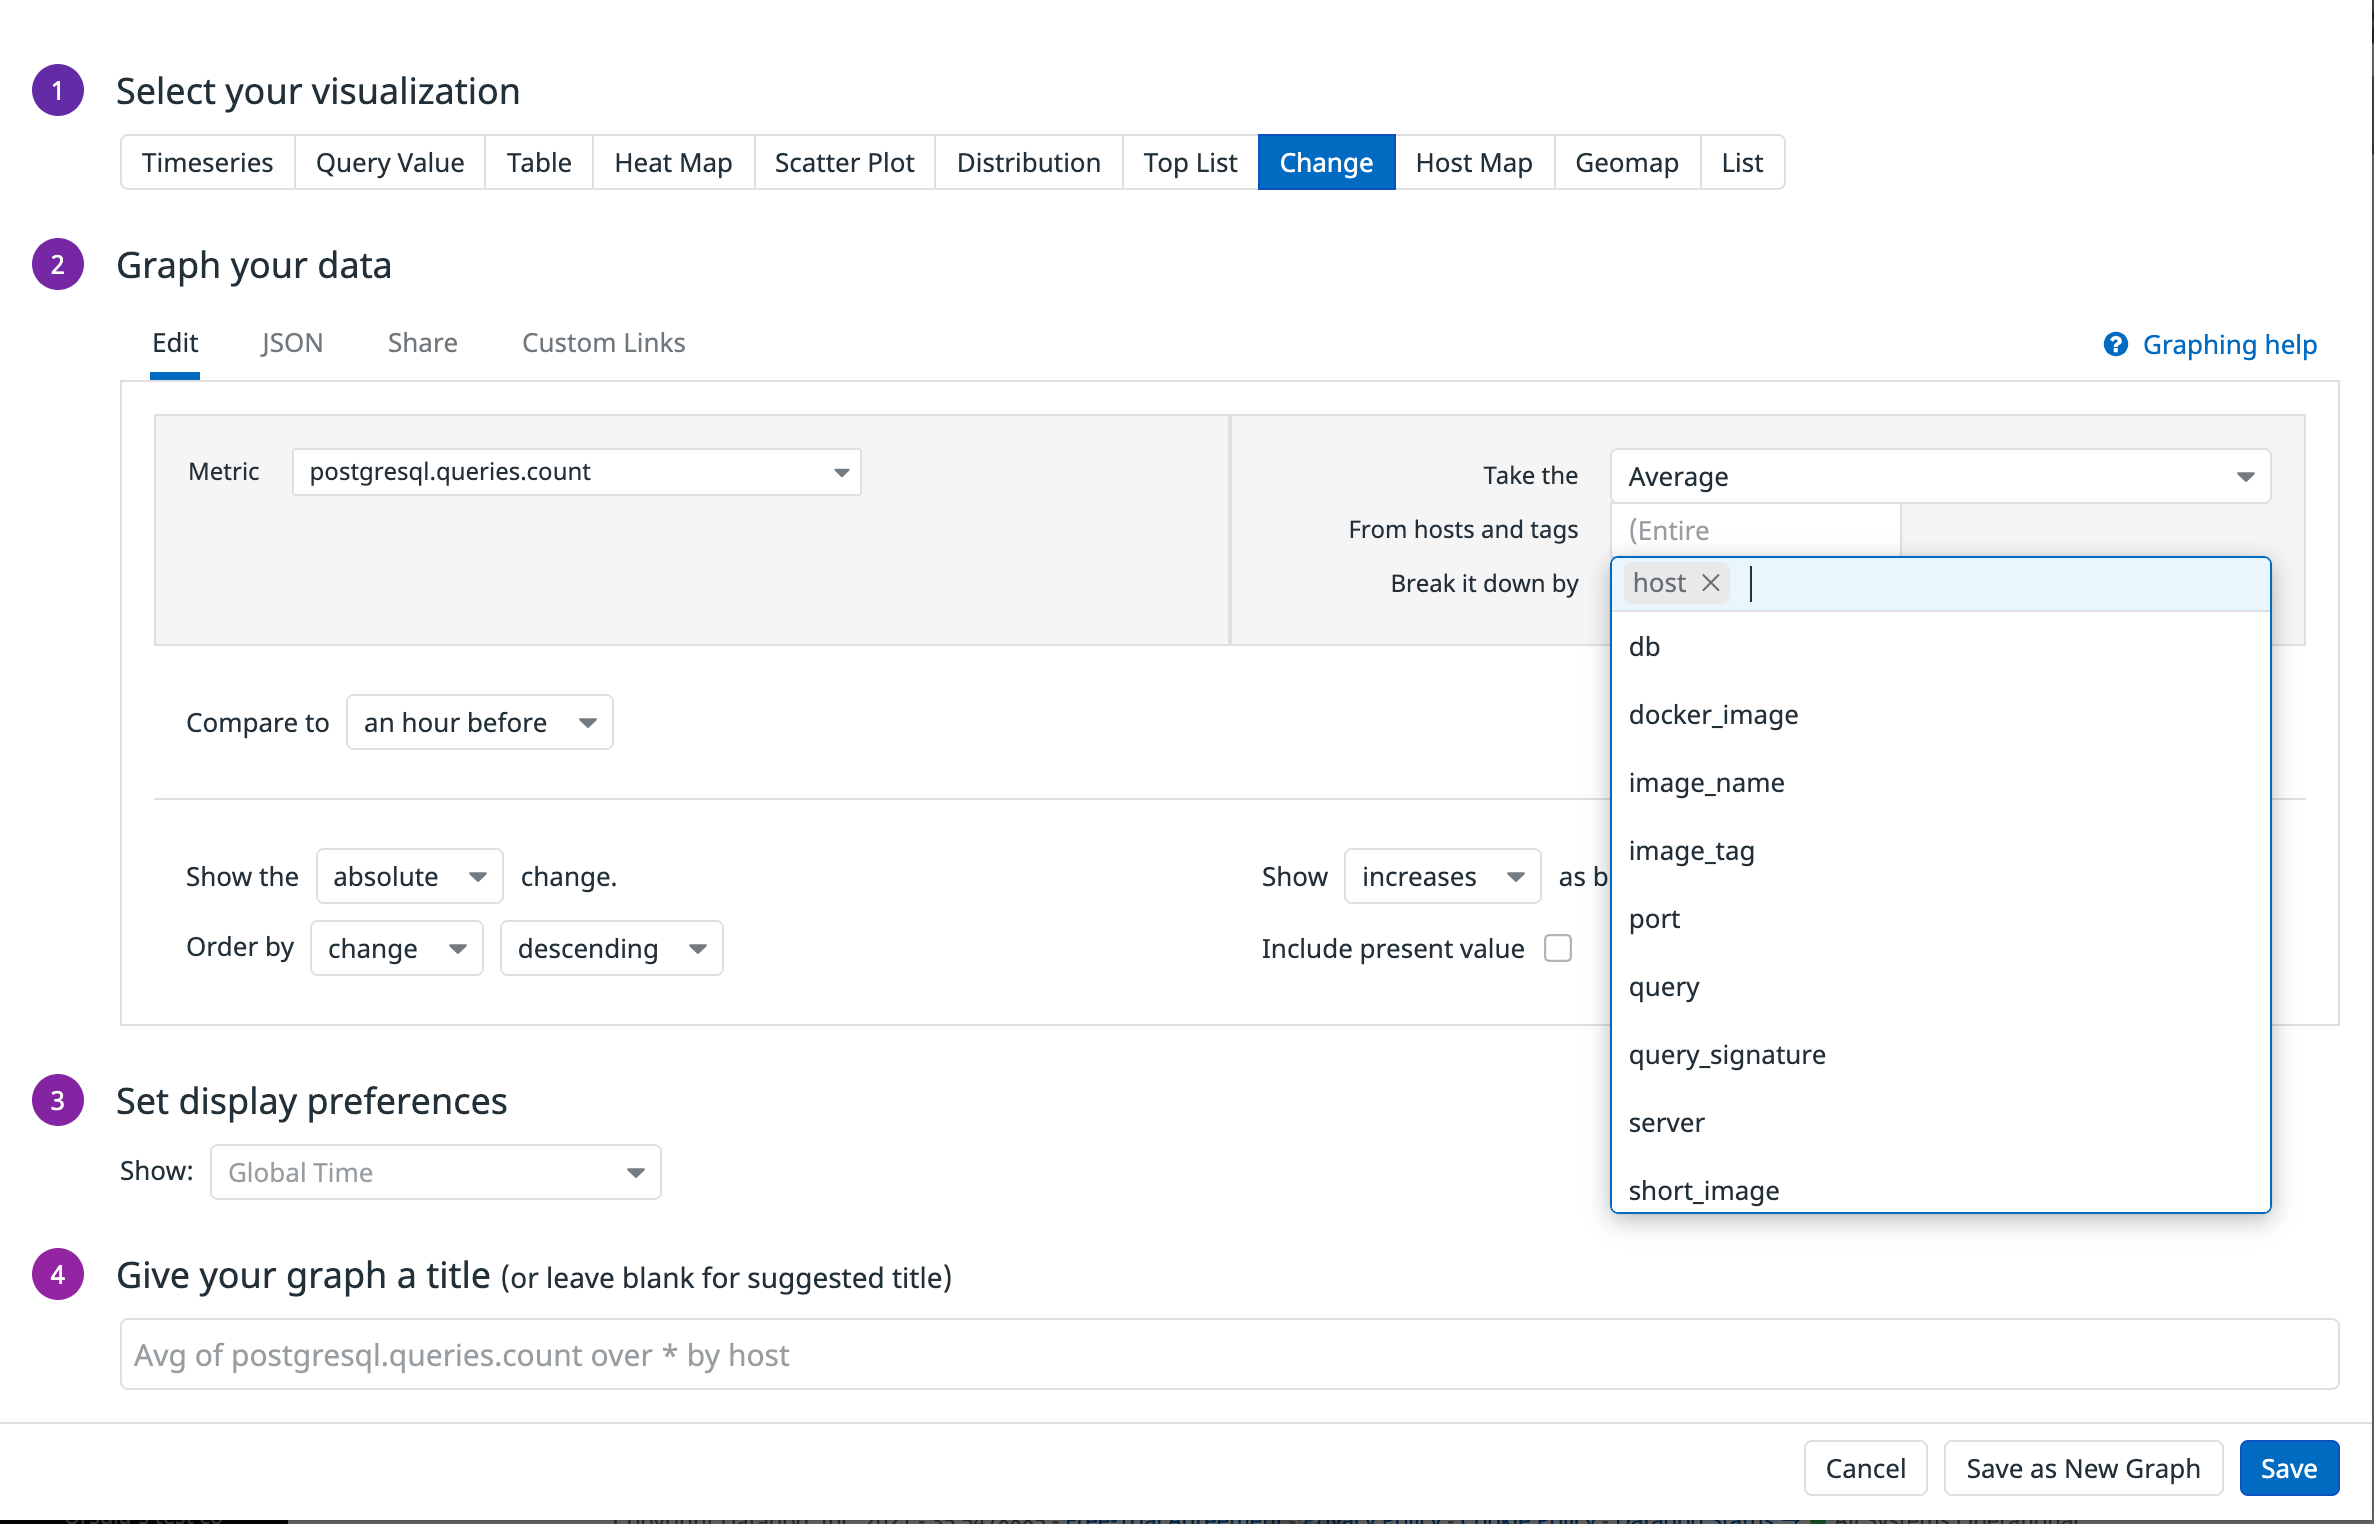
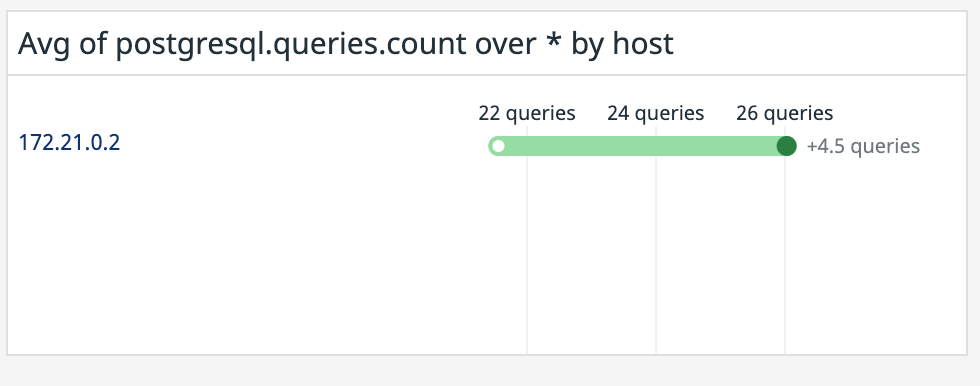
For example, you can see the absolute change in query volume in the past hour by adding a Change widget to track a query count metric.
Select Dashboards > New Dashboard in the UI.
Enter a name for your dashboard. Click the New Dashboard button to go to your new dashboard.
To add content to your dashboard, click Add Widgets.
In the widget carousel, select the Change widget.
Select
postgresql.queries.countin the Metric dropdown. This metric counts the number of queries sent to a PostgreSQL database.Select
hostin the Break it down by dropdown so that the widget aggregates queries by host.Click the Save button. The dashboard shows your new widget.
View out-of-the-box dashboards
Observe current database activity, resource utilization, and more on out-of-the-box dashboards provided by Datadog Database Monitoring.
To access the dashboards, from the Database Monitoring page, select the Dashboards tab and choose the dashboard that you want to see.
You can clone and modify out-of-the-box dashboards to suit your needs.
Further Reading
Additional helpful documentation, links, and articles:
