- Essentials
- Getting Started
- Datadog
- Datadog Site
- DevSecOps
- Serverless for AWS Lambda
- Agent
- Integrations
- Containers
- Dashboards
- Monitors
- Logs
- APM Tracing
- Profiler
- Tags
- API
- Service Catalog
- Session Replay
- Continuous Testing
- Synthetic Monitoring
- Incident Management
- Database Monitoring
- Cloud Security Management
- Cloud SIEM
- Application Security Management
- Workflow Automation
- CI Visibility
- Test Visibility
- Test Impact Analysis
- Code Analysis
- Learning Center
- Support
- Glossary
- Standard Attributes
- Guides
- Agent
- Integrations
- OpenTelemetry
- Developers
- Authorization
- DogStatsD
- Custom Checks
- Integrations
- Create an Agent-based Integration
- Create an API Integration
- Create a Log Pipeline
- Integration Assets Reference
- Build a Marketplace Offering
- Create a Tile
- Create an Integration Dashboard
- Create a Recommended Monitor
- Create a Cloud SIEM Detection Rule
- OAuth for Integrations
- Install Agent Integration Developer Tool
- Service Checks
- IDE Plugins
- Community
- Guides
- Administrator's Guide
- API
- Datadog Mobile App
- CoScreen
- Cloudcraft
- In The App
- Dashboards
- Notebooks
- DDSQL Editor
- Sheets
- Monitors and Alerting
- Infrastructure
- Metrics
- Watchdog
- Bits AI
- Service Catalog
- API Catalog
- Error Tracking
- Service Management
- Infrastructure
- Application Performance
- APM
- Continuous Profiler
- Database Monitoring
- Data Streams Monitoring
- Data Jobs Monitoring
- Digital Experience
- Real User Monitoring
- Product Analytics
- Synthetic Testing and Monitoring
- Continuous Testing
- Software Delivery
- CI Visibility
- CD Visibility
- Test Optimization
- Code Analysis
- Quality Gates
- DORA Metrics
- Security
- Security Overview
- Cloud SIEM
- Cloud Security Management
- Application Security Management
- AI Observability
- Log Management
- Observability Pipelines
- Log Management
- Administration
Getting Started with APM Tracing
Overview
Datadog Application Performance Monitoring (APM) provides deep visibility into your applications, enabling you to identify performance bottlenecks, troubleshoot issues, and optimize your services.
This guide demonstrates how to get started with APM and send your first trace to Datadog:
- Set up Datadog APM to send traces to Datadog.
- Run your application to generate data.
- Explore the collected data in Datadog.
Prerequisites
To complete this guide, you need the following:
- Create a Datadog account if you haven’t already.
- Find or create a Datadog API key.
- Start up a Linux host or VM.
Create an application
To create an application to observe in Datadog:
On your Linux host or VM, create a new Python application named
hello.py. For example,nano hello.py.Add the following code to
hello.py:hello.py
  from flask import Flask
  import random

  app = Flask(__name__)

  quotes = [
      "Strive not to be a success, but rather to be of value. - Albert Einstein",
      "Believe you can and you're halfway there. - Theodore Roosevelt",
      "The future belongs to those who believe in the beauty of their dreams. - Eleanor Roosevelt"
  ]

  @app.route('/')
  def index():
      quote = random.choice(quotes)+"\n"
      return quote

  if __name__ == '__main__':
      app.run(host='0.0.0.0', port=5050)
Set up Datadog APM
To set up Datadog APM without needing to modify your application’s code or the deployment process, use Single Step APM Instrumentation:
Note: Single Step APM Instrumentation is in beta. Alternatively, you can set up APM using Datadog tracing libraries.
Run the installation command:
DD_API_KEY=<YOUR_DD_API_KEY> DD_SITE="<YOUR_DD_SITE>" DD_APM_INSTRUMENTATION_ENABLED=host DD_APM_INSTRUMENTATION_LIBRARIES=python:2 DD_ENV=<AGENT_ENV> bash -c "$(curl -L https://install.datadoghq.com/scripts/install_script_agent7.sh)"Replace
<YOUR_DD_API_KEY>with your Datadog API key,<YOUR_DD_SITE>with your Datadog site, and<AGENT_ENV>with the environment your Agent is installed on (for example,development).Restart the services on your host or VM.
Verify the Agent is running:
sudo datadog-agent status
This approach automatically installs the Datadog Agent, enables Datadog APM, and instruments your application at runtime.
Run the application
When you set up Datadog APM with Single Step Instrumentation, Datadog automatically instruments your application at runtime.
To run hello.py:
Create a Python virtual environment in the current directory:
python3 -m venv ./venvActivate the
venvvirtual environment:source ./venv/bin/activateInstall
pipandflask:sudo apt-get install python3-pip pip install flaskSet the service name and run
hello.py:export DD_SERVICE=hello python3 hello.py
Test the application
Test the application to send traces to Datadog:
In a new command prompt, run the following:
curl http://0.0.0.0:5050/Confirm that a random quote is returned.
Believe you can and you're halfway there. - Theodore Roosevelt
Each time you run the curl command, a new trace is sent to Datadog.
Explore traces in Datadog
In Datadog, go to APM > Services. You should see a Python service named
hello:Select the service to view its performance metrics, such as latency, throughput, and error rates.
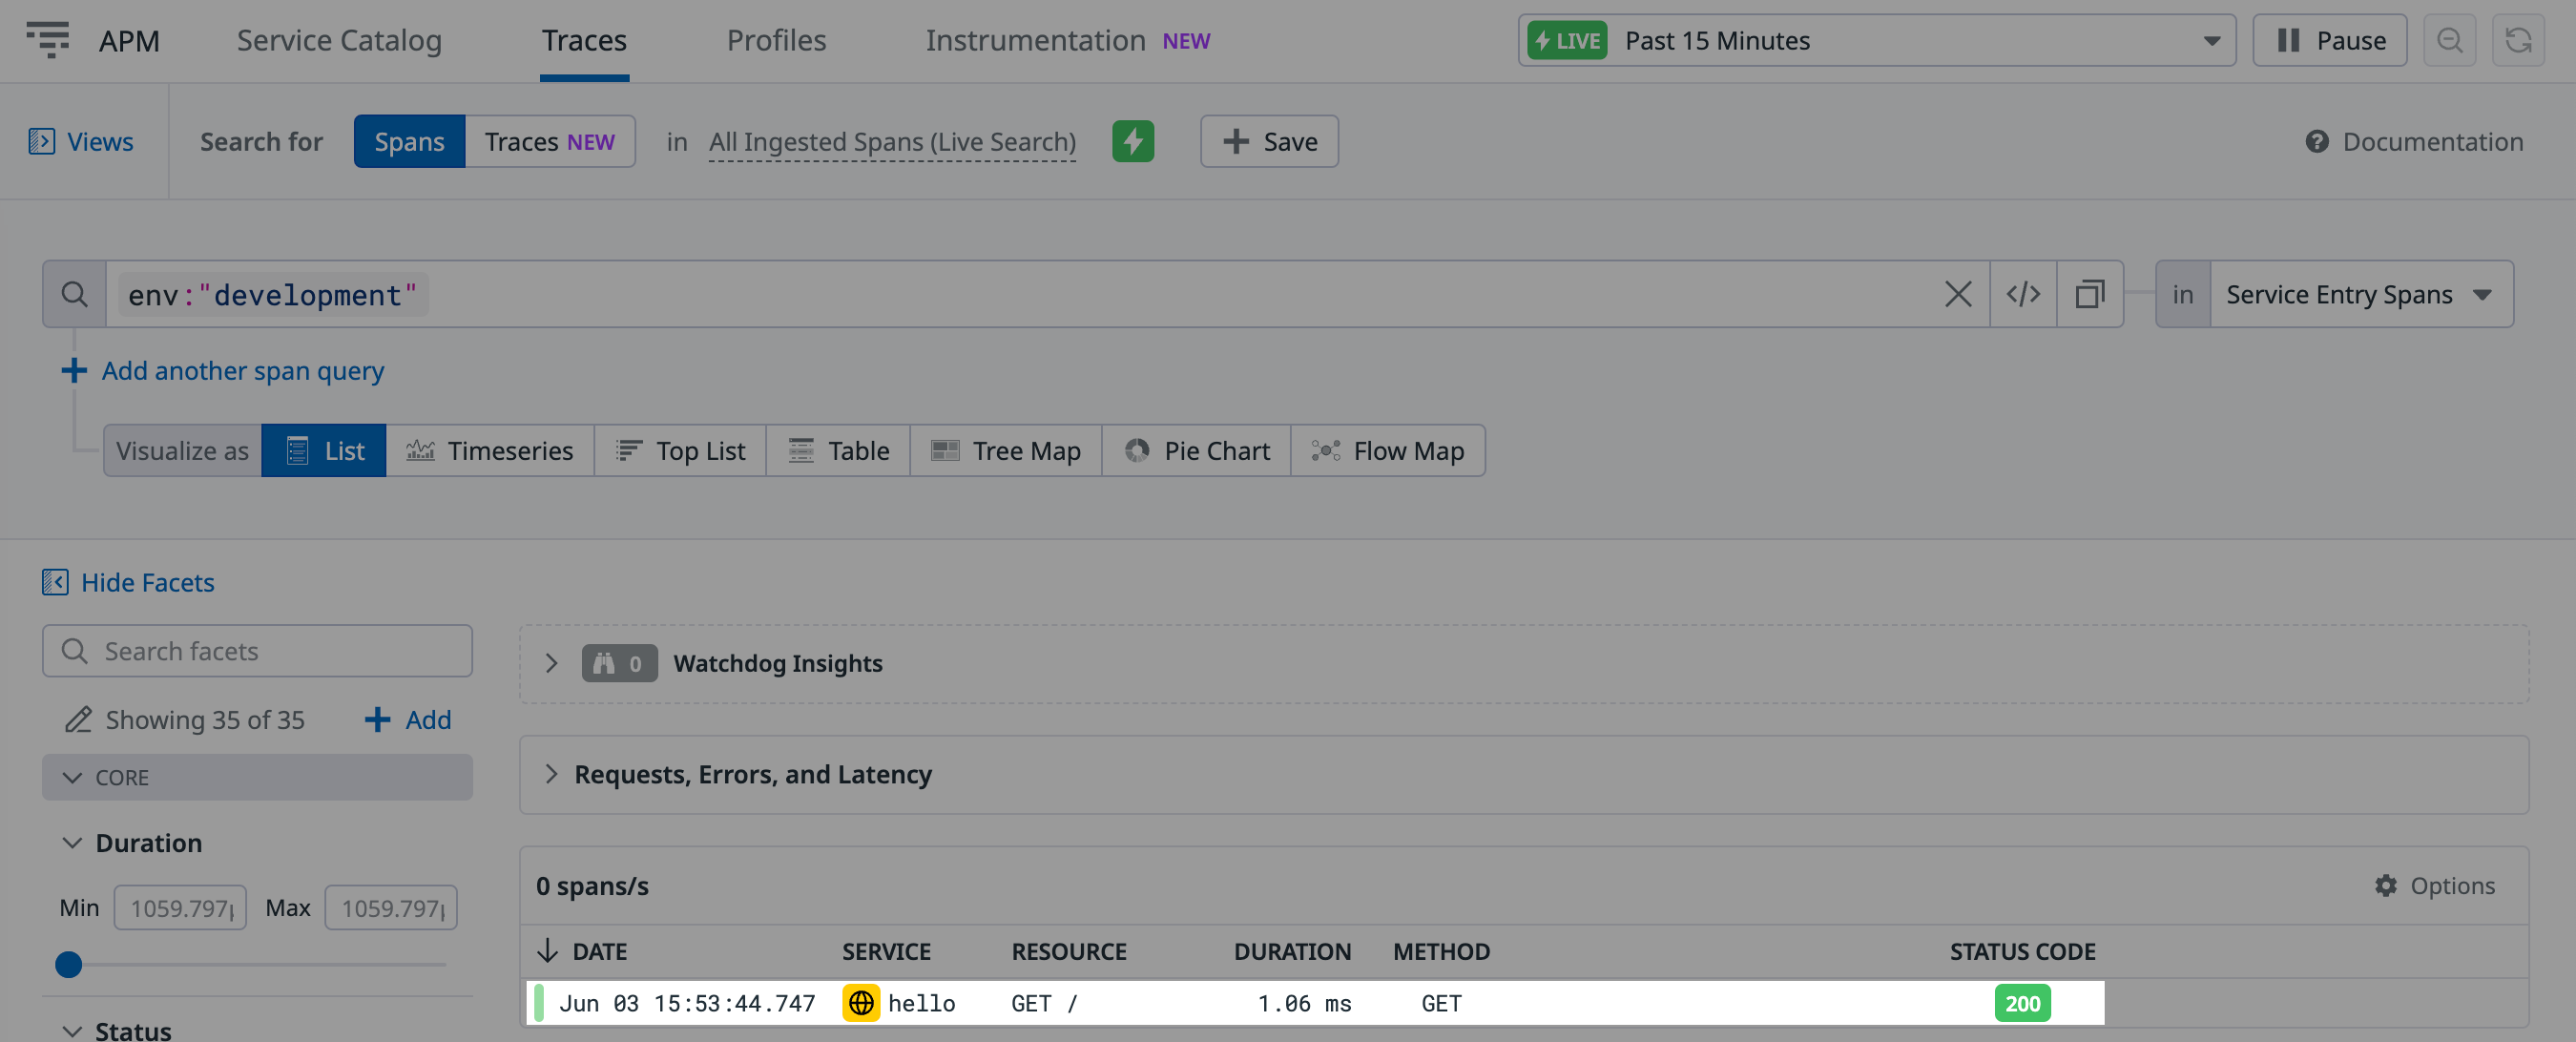
Go to APM > Traces. You should see a trace for the
helloservice:Select a trace to see its details, including the flame graph, which helps identify performance bottlenecks.
Advanced APM setup
Up until this point, you let Datadog automatically instrument the hello.py application using Single Step Instrumentation. This approach is recommended if you want to capture essential traces across common libraries and languages without touching code or manually installing libraries.
However, if you need to collect traces from custom code or require more fine-grained control, you can add custom instrumentation.
To illustrate this, you will import the Datadog Python tracing library into hello.py and create a custom span and span tag.
To add custom instrumentation:
Install the Datadog tracing library:
pip install ddtraceAdd the highlighted lines to the code in
hello.pyto create a custom span tagget_quoteand a custom span tagquote:from flask import Flask import random from ddtrace import tracer app = Flask(__name__) quotes = [ "Strive not to be a success, but rather to be of value. - Albert Einstein", "Believe you can and you're halfway there. - Theodore Roosevelt", "The future belongs to those who believe in the beauty of their dreams. - Eleanor Roosevelt" ] @app.route('/') def index(): with tracer.trace("get_quote") as span: quote = random.choice(quotes)+"\n" span.set_tag("quote", quote) return quote if __name__ == '__main__': app.run(host='0.0.0.0', port=5050)Run
hello.pyin the virtual environment from earlier:ddtrace-run python hello.pyRun a few
curlcommands in a separate command prompt:curl http://0.0.0.0:5050/In Datadog, go to APM > Traces.
Select the hello trace.
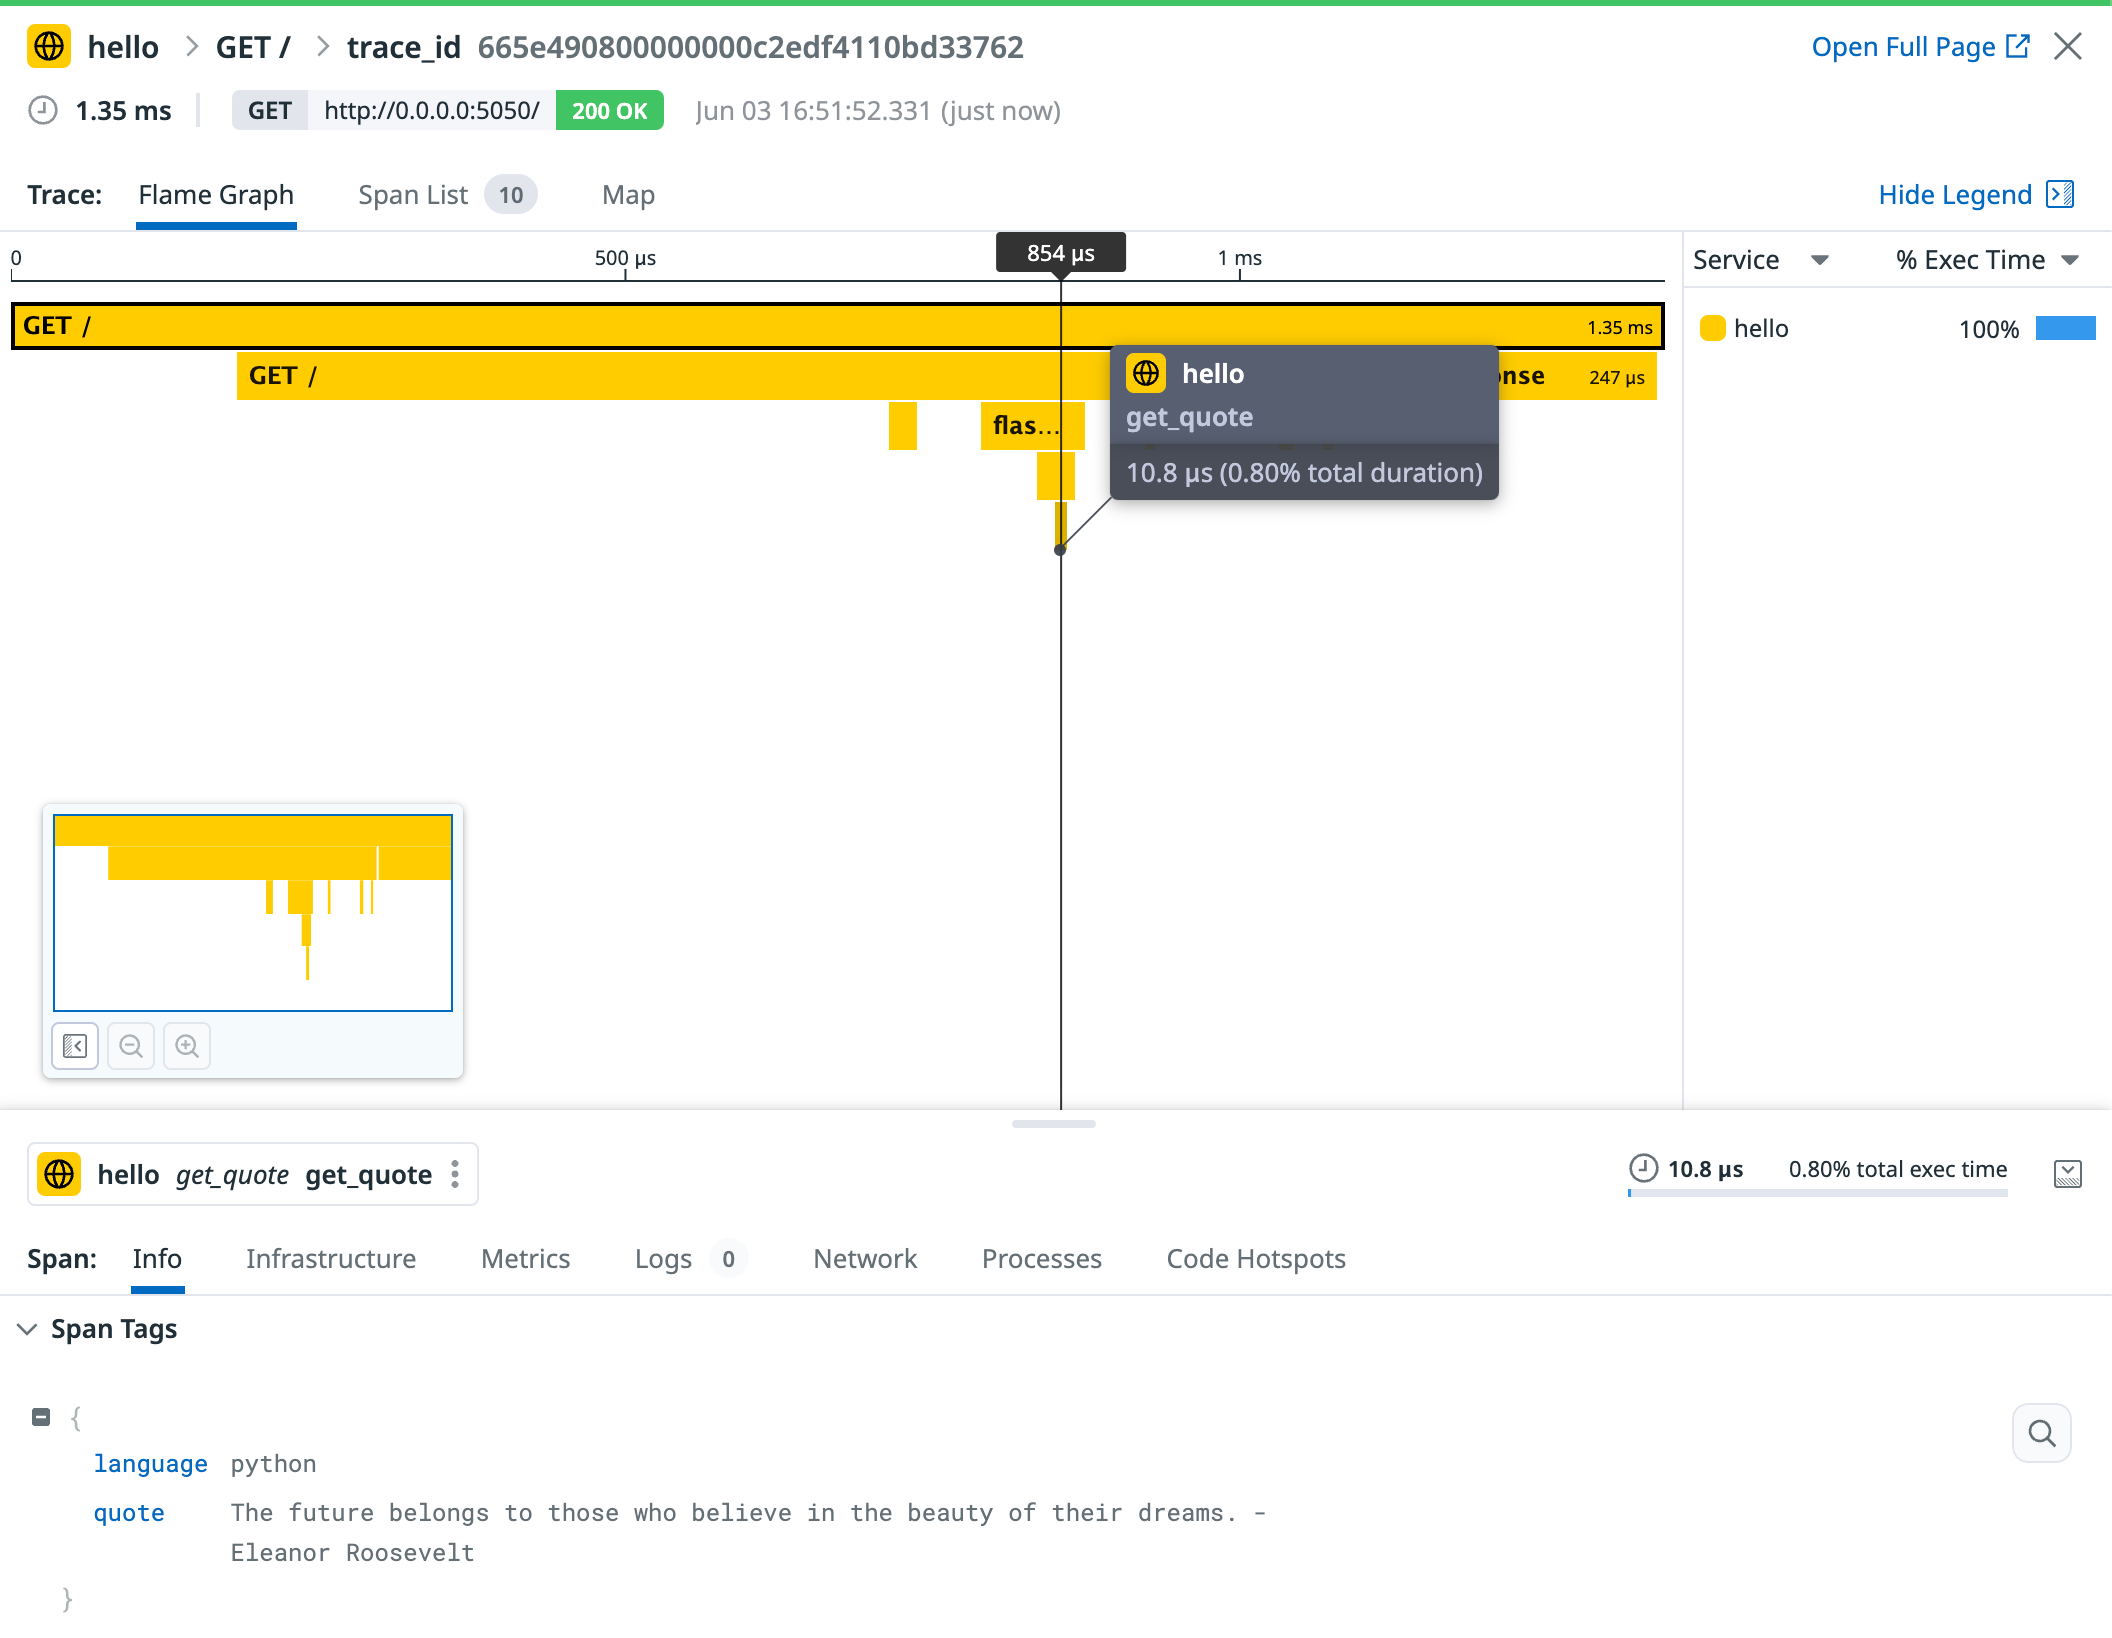
Find the new custom
get_quotespan in the flame graph and hover over it:Notice that the custom
quotespan tag displays on the Info tab.
Further reading
Additional helpful documentation, links, and articles:


