- Principales informations
- Getting Started
- Datadog
- Site Datadog
- DevSecOps
- Serverless for AWS Lambda
- Agent
- Intégrations
- Conteneurs
- Dashboards
- Monitors
- Logs
- Tracing
- Profileur
- Tags
- API
- Service Catalog
- Session Replay
- Continuous Testing
- Surveillance Synthetic
- Incident Management
- Database Monitoring
- Cloud Security Management
- Cloud SIEM
- Application Security Management
- Workflow Automation
- CI Visibility
- Test Visibility
- Intelligent Test Runner
- Code Analysis
- Learning Center
- Support
- Glossary
- Standard Attributes
- Guides
- Agent
- Intégrations
- OpenTelemetry
- Développeurs
- Authorization
- DogStatsD
- Checks custom
- Intégrations
- Create an Agent-based Integration
- Create an API Integration
- Create a Log Pipeline
- Integration Assets Reference
- Build a Marketplace Offering
- Create a Tile
- Create an Integration Dashboard
- Create a Recommended Monitor
- Create a Cloud SIEM Detection Rule
- OAuth for Integrations
- Install Agent Integration Developer Tool
- Checks de service
- IDE Plugins
- Communauté
- Guides
- Administrator's Guide
- API
- Application mobile
- CoScreen
- Cloudcraft
- In The App
- Dashboards
- Notebooks
- DDSQL Editor
- Alertes
- Infrastructure
- Métriques
- Watchdog
- Bits AI
- Service Catalog
- API Catalog
- Error Tracking
- Service Management
- Infrastructure
- Universal Service Monitoring
- Conteneurs
- Sans serveur
- Surveillance réseau
- Cloud Cost
- Application Performance
- APM
- Profileur en continu
- Database Monitoring
- Agent Integration Overhead
- Setup Architectures
- Configuration de Postgres
- Configuration de MySQL
- Configuration de SQL Server
- Setting Up Oracle
- Setting Up MongoDB
- Connecting DBM and Traces
- Données collectées
- Exploring Database Hosts
- Explorer les métriques de requête
- Explorer des échantillons de requêtes
- Dépannage
- Guides
- Data Streams Monitoring
- Data Jobs Monitoring
- Digital Experience
- RUM et Session Replay
- Product Analytics
- Surveillance Synthetic
- Continuous Testing
- Software Delivery
- CI Visibility
- CD Visibility
- Test Visibility
- Exécuteur de tests intelligent
- Code Analysis
- Quality Gates
- DORA Metrics
- Securité
- Security Overview
- Cloud SIEM
- Cloud Security Management
- Application Security Management
- AI Observability
- Log Management
- Pipelines d'observabilité
- Log Management
- Administration
Code Origins for Spans
Cette page n'est pas encore disponible en français, sa traduction est en cours.
Si vous avez des questions ou des retours sur notre projet de traduction actuel, n'hésitez pas à nous contacter.
Si vous avez des questions ou des retours sur notre projet de traduction actuel, n'hésitez pas à nous contacter.
Join the Preview!
Code Origins is currently in Preview. To join the preview, follow the instructions below. To submit questions, feedback, or requests related to Code Origins, fill out this form with details.
Overview
Code Origins captures the exact locations in your codebase where APM spans are created. When enabled, it automatically adds file path, line number, and function name to each span, making it easier to:
- Debug performance issues
- Understand code execution flow
- Identify performance bottlenecks
In Trace Explorer, select a span to see Code Origin details on the Overview tab:
Getting started
Prerequisites
- Datadog APM is configured to capture spans.
- Source Code Integration is enabled (recommended for code previews).
- Your service meets the compatibility requirements.
Compatibility requirements
| Runtime Language | Tracing Library Version | Frameworks |
|---|---|---|
| Java | 1.47.0+ | Spring Boot/Data, gRPC servers, Micronaut 4, Kafka consumers |
| Python | 2.15.0+ | Django, Flask, Starlette and derivatives |
| Node.js | 4.49.0+ | Fastify |
| .NET | 3.15.0+ | ASP.NET, ASP.NET Core |
Enable Code Origins
Run your service with the following environment variable:
export DD_CODE_ORIGIN_FOR_SPANS_ENABLED=true
Using Code Origins
In the Trace Explorer
Navigate to the Trace Explorer.
Click on any trace to view its details.
In the span details panel, look for the “Code Origin” section.
Optionally, click on source code variables to add them as attributes to future spans with Dynamic Instrumentation.
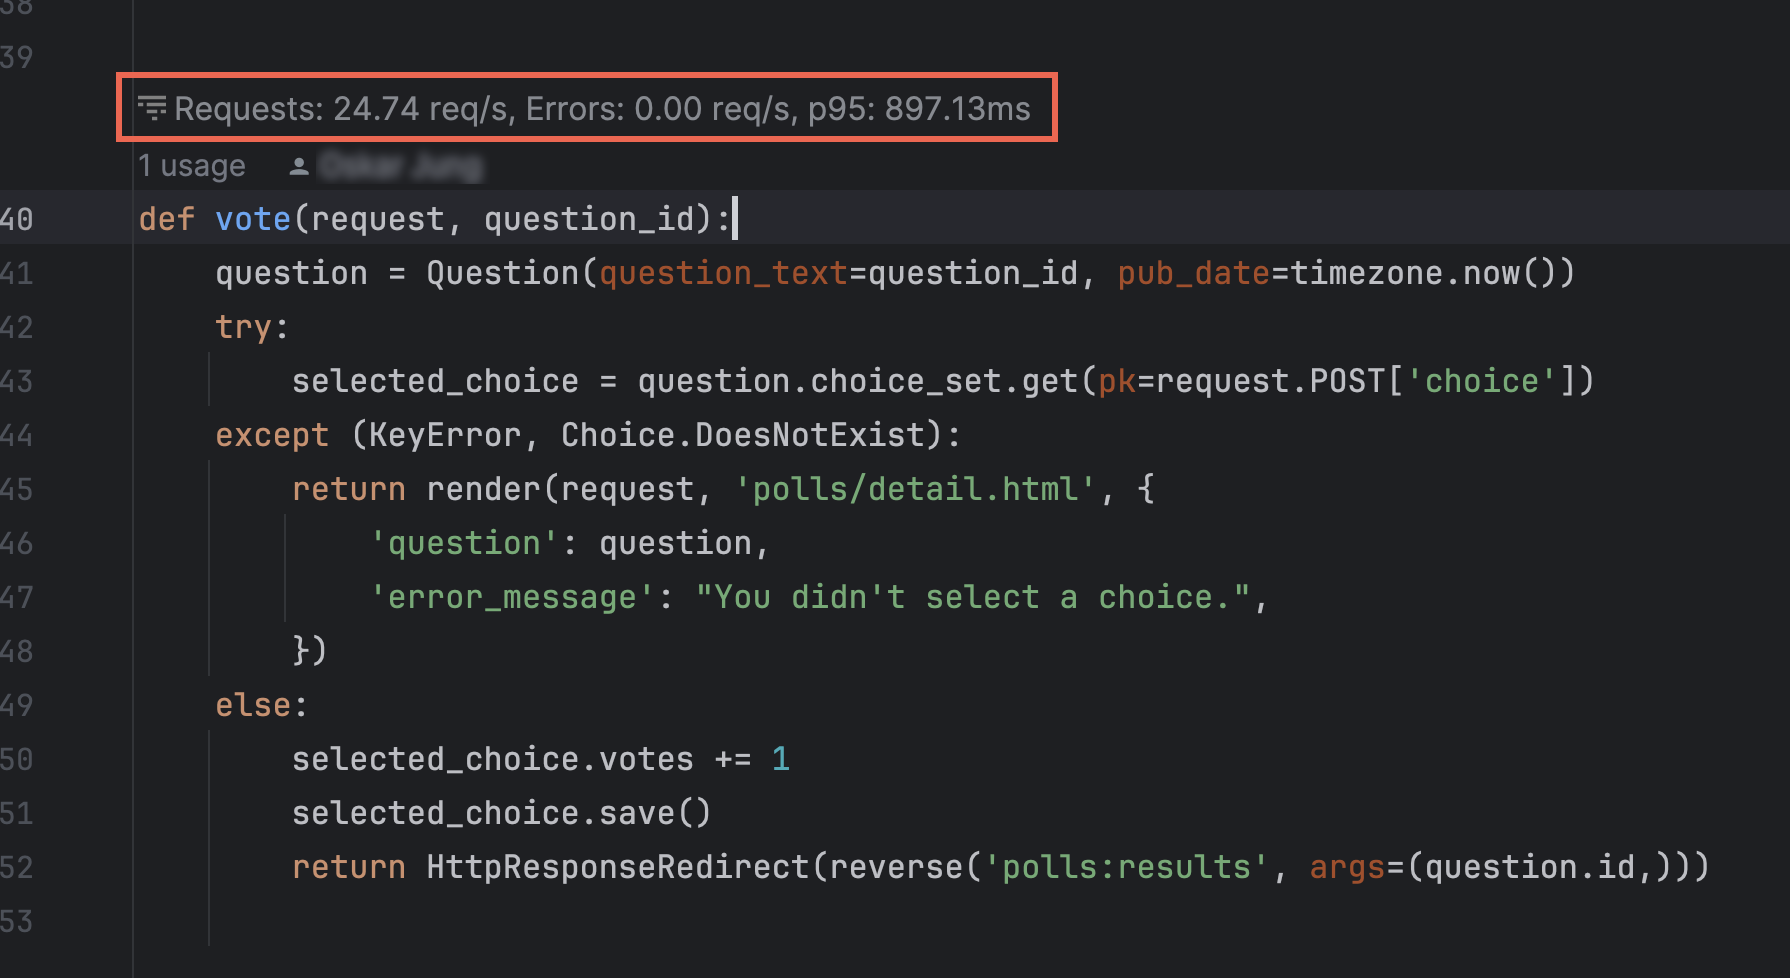
In your IDE
Set up your Datadog IDE Integration.
- Supported IDEs: IntelliJ, VS Code
- Supported Languages: Java, Python
View RED metrics (Requests, Errors, and Duration) as inline annotations above your endpoint methods.
Troubleshooting
If Code Origin information is missing:
- Verify Code Origins is enabled in your tracing library configuration.
- Confirm that your service meets all compatibility requirements.
- In particular, check whether your service’s language and framework support Code Origins.
- Filter for spans that include Code Origins using the query
@_dd.code_origin.type:*in the Trace Explorer. - Enable Source Code Integration to see code previews in the APM Trace side panel.
Further Reading
Documentation, liens et articles supplémentaires utiles:


