- Essentials
- Getting Started
- Agent
- API
- APM Tracing
- Containers
- Dashboards
- Database Monitoring
- Datadog
- Datadog Site
- DevSecOps
- Incident Management
- Integrations
- Logs
- Monitors
- OpenTelemetry
- Profiler
- Session Replay
- Security
- Serverless for AWS Lambda
- Software Catalog
- Software Delivery
- Synthetic Monitoring and Testing
- Tags
- Workflow Automation
- Learning Center
- Support
- Glossary
- Standard Attributes
- Guides
- Agent
- Integrations
- Developers
- Authorization
- DogStatsD
- Custom Checks
- Integrations
- Create an Agent-based Integration
- Create an API Integration
- Create a Log Pipeline
- Integration Assets Reference
- Build a Marketplace Offering
- Create a Tile
- Create an Integration Dashboard
- Create a Monitor Template
- Create a Cloud SIEM Detection Rule
- OAuth for Integrations
- Install Agent Integration Developer Tool
- Service Checks
- IDE Plugins
- Community
- Guides
- OpenTelemetry
- Administrator's Guide
- API
- Partners
- Datadog Mobile App
- DDSQL Reference
- CoScreen
- CoTerm
- Cloudcraft (Standalone)
- In The App
- Dashboards
- Notebooks
- DDSQL Editor
- Reference Tables
- Sheets
- Monitors and Alerting
- Metrics
- Watchdog
- Bits AI
- Internal Developer Portal
- Error Tracking
- Change Tracking
- Service Management
- Actions & Remediations
- Infrastructure
- Cloudcraft
- Resource Catalog
- Universal Service Monitoring
- Hosts
- Containers
- Processes
- Serverless
- Network Monitoring
- Cloud Cost
- Application Performance
- APM
- APM Terms and Concepts
- Application Instrumentation
- APM Metrics Collection
- Trace Pipeline Configuration
- Correlate Traces with Other Telemetry
- Trace Explorer
- Recommendations
- Code Origins for Spans
- Service Observability
- Endpoint Observability
- Dynamic Instrumentation
- Live Debugger
- Error Tracking
- Data Security
- Guides
- Troubleshooting
- Continuous Profiler
- Database Monitoring
- Agent Integration Overhead
- Setup Architectures
- Setting Up Postgres
- Setting Up MySQL
- Setting Up SQL Server
- Setting Up Oracle
- Setting Up Amazon DocumentDB
- Setting Up MongoDB
- Connecting DBM and Traces
- Data Collected
- Exploring Database Hosts
- Exploring Query Metrics
- Exploring Query Samples
- Exploring Database Schemas
- Exploring Recommendations
- Troubleshooting
- Guides
- Data Streams Monitoring
- Data Jobs Monitoring
- Digital Experience
- Real User Monitoring
- Synthetic Testing and Monitoring
- Continuous Testing
- Product Analytics
- Software Delivery
- CI Visibility
- CD Visibility
- Test Optimization
- Quality Gates
- DORA Metrics
- Security
- Security Overview
- Cloud SIEM
- Code Security
- Cloud Security
- App and API Protection
- Workload Protection
- Sensitive Data Scanner
- AI Observability
- Log Management
- Observability Pipelines
- Log Management
- Administration
Continuous Profiler
Overview
The Continuous Profiler highlights resource consumption (such as CPU, memory allocation, and thrown exceptions) using profiling data collected from deployed services. This information helps developers eliminate bottlenecks and write more efficient code.
Profiler tab
The Continuous Profiler tab shows profiling information for the service in a selected environment, aggregated over a specific time frame. Available views are:
- Top list: Displays a list of the most resource intensive methods for the current profiling measure.
- Flame graph: A flame graph representing stack traces in the profiles.
You can specify the following parameters for the profiling data:
- The profile type to be displayed
- The environment in which the service is running
- The time frame for the profile samples to be aggregated
The available profiling types usually include options like CPU Time and Allocated Memory, but are determined by the platform and vary by language.
Top list
The Top List sub-tab shows the methods that consume the most resources based on the aggregated profile data loaded from the Datadog servers. These are the methods that are most likely candidates for optimization.
- Double-click an item in the list (or selecting Jump to Source from the context menu) to open a source code editor showing where the method is defined.
- To see a flame graph visualization of a method, select Search in Flame Graph from the context menu.
Call tree
The call tree to the right of the Top List shows the paths that lead to (and from) the selected method.
The default Caller Hierarchy view shows the callers (or predecessors) of the target method and the frequency with which they appear in the call stack. To view the callees (or successors), click the Callee Hierarchy button on the toolbar.
Right-click on a method in the call tree to see options to navigate to the source editor or flame graph.
Flame graph
A flame graph is a visualization of profiling samples that shows stack traces and their relative frequency during the sample period. The Datadog plugin collects multiple individual profiles from the requested time frame and aggregates them. Each individual profile covers a 60 second interval within the requested time frame.
Each time you change the profile type, the time frame, or the environment, the Datadog plugin generates a new flame graph.
You can navigate the flame graph in several ways:
- Double-click any frame to focus on that method and all the methods that it has called during the sampling period.
- Use the minimap to pan around the graph.
- Right-click a method and select Jump to Source to go to the corresponding point in the source code.
Hovering over a method displays a tooltip with the following information:
- The class name and method signature
- The package name
- The profiling metric value and percentage breakdown.
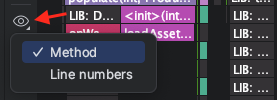
Profiling samples include stack trace and line number information. Use the Separate Flame Graph by button to switch between separating frames by method or line number.
Source highlighting
When the Continuous Profiler tab is active, the plugin adds code highlights to the source code editor margin. For Top Methods, an icon appears in the editor margin, and line-level highlights appear in the code based on the active Profiling data.
- Hover over the icon to see more information.
- Click the icon to open the top list Profiling tab or open Profiling in Datadog.
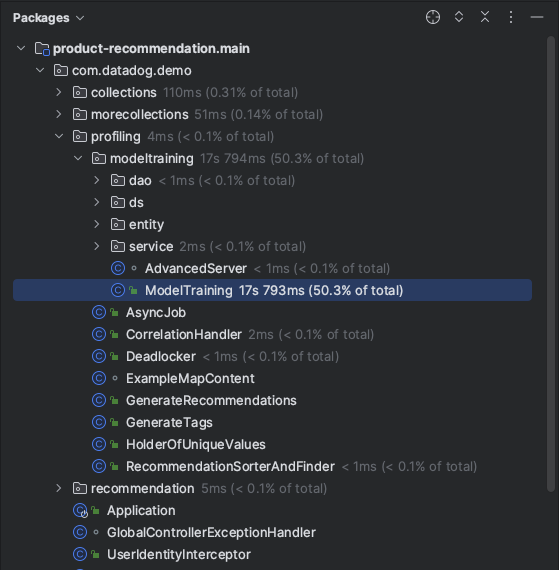
The active Profiling tab also affects the project tree view, which is annotated with the selected profile’s metrics:
Further reading
Additional helpful documentation, links, and articles:


