Cette page n'est pas encore disponible en français, sa traduction est en cours. Si vous avez des questions ou des retours sur notre projet de traduction actuel, n'hésitez pas à nous contacter.
This integration monitors your Cloudera Data Platform through the Datadog Agent, allowing you to submit metrics and service checks on the health of your Cloudera Data Hub clusters, hosts, and roles.
Follow the instructions below to install and configure this check for an Agent running on a host. For containerized environments, see the Autodiscovery Integration Templates for guidance on applying these instructions.
Edit the cloudera.d/conf.yaml file, in the conf.d/ folder at the root of your Agent’s configuration directory to start collecting your Cloudera cluster and host data. See the sample cloudera.d/conf.yaml for all available configuration options. Note: The api_url should contain the API version at the end.
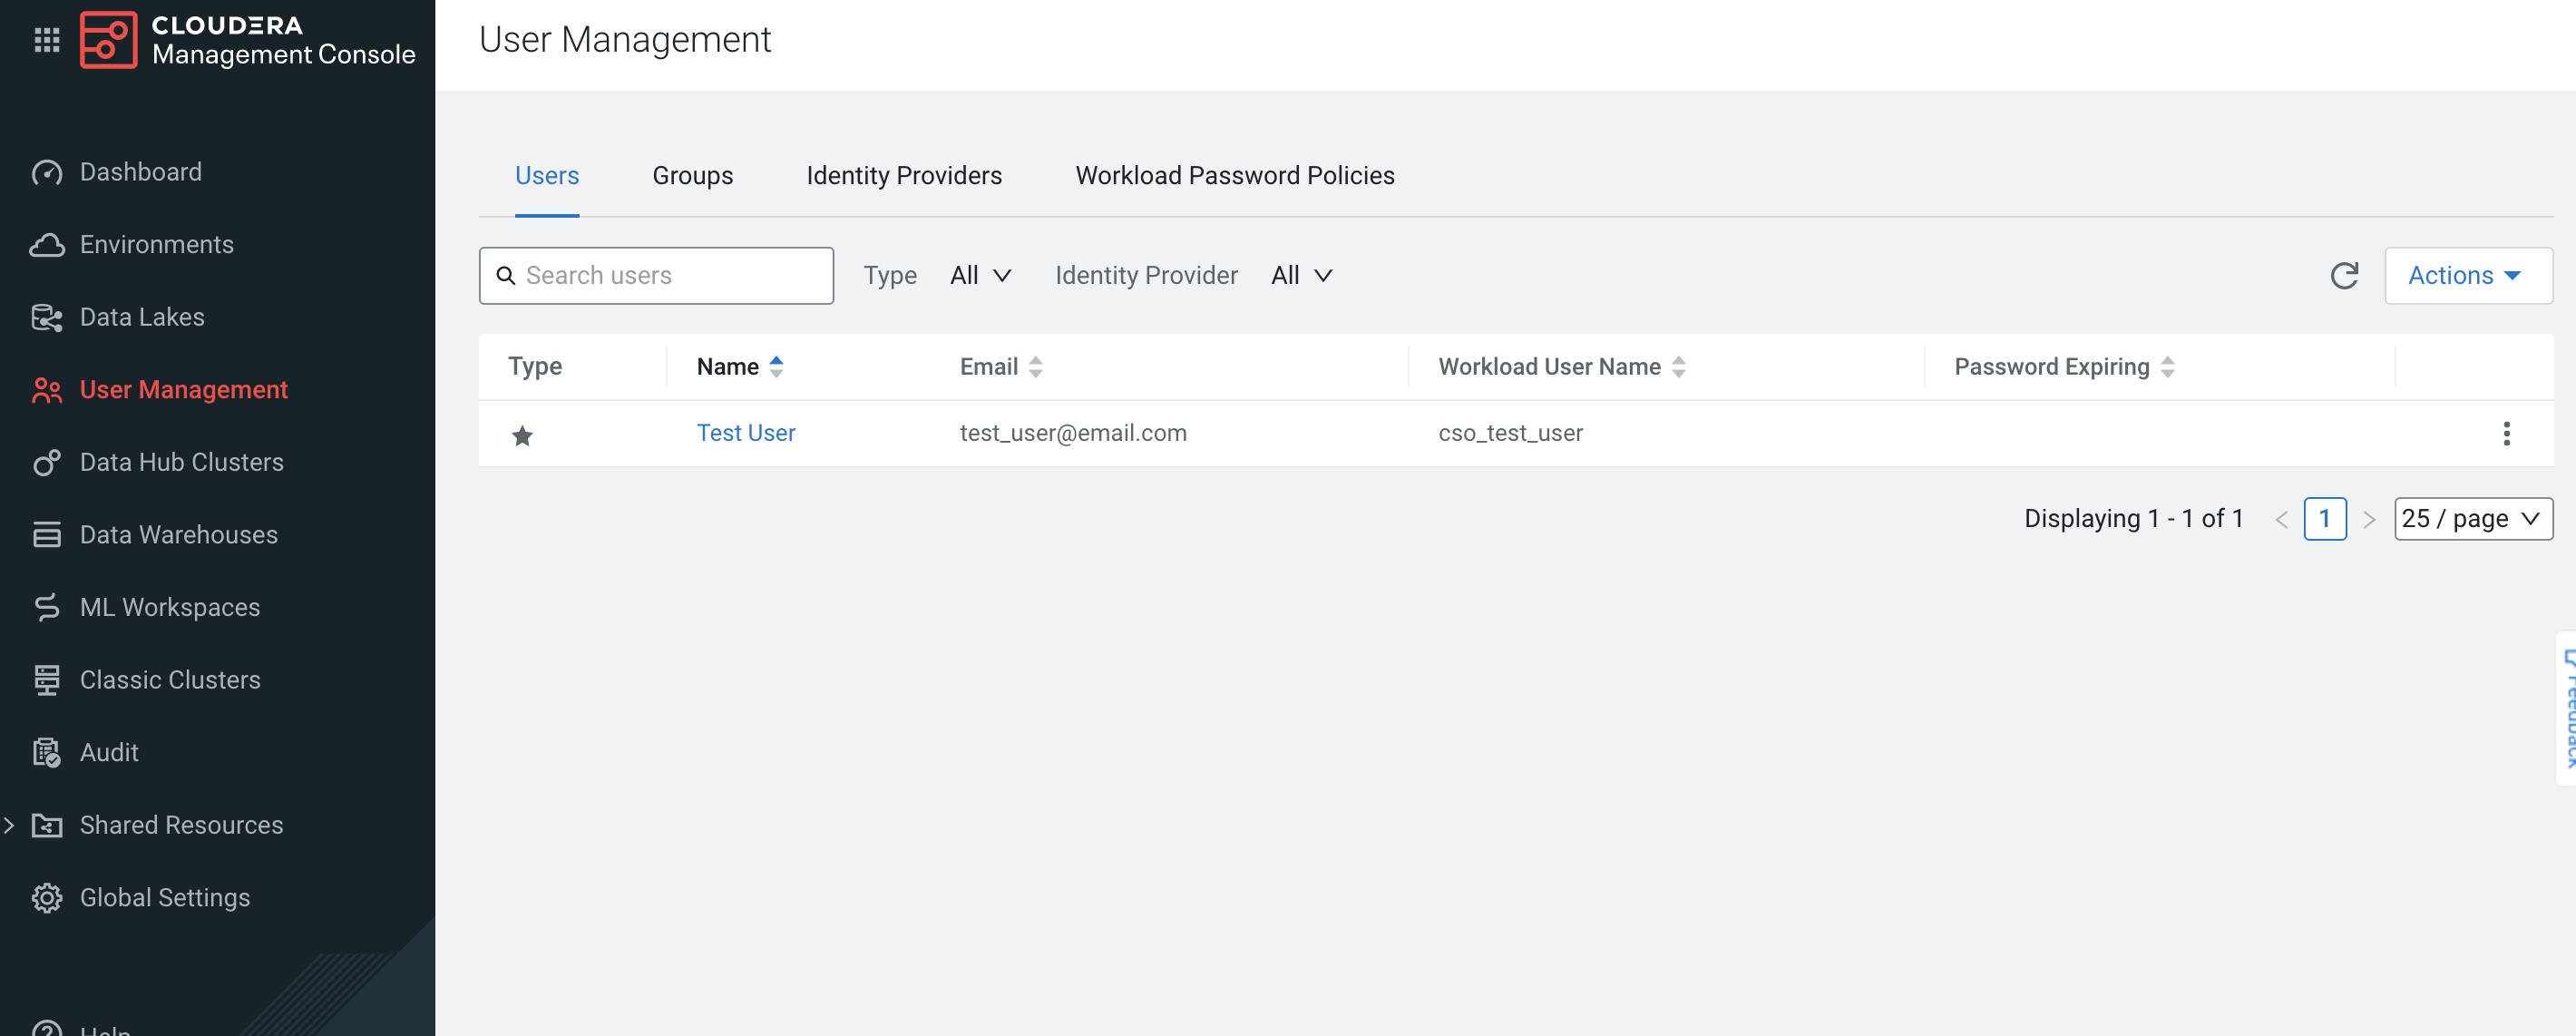
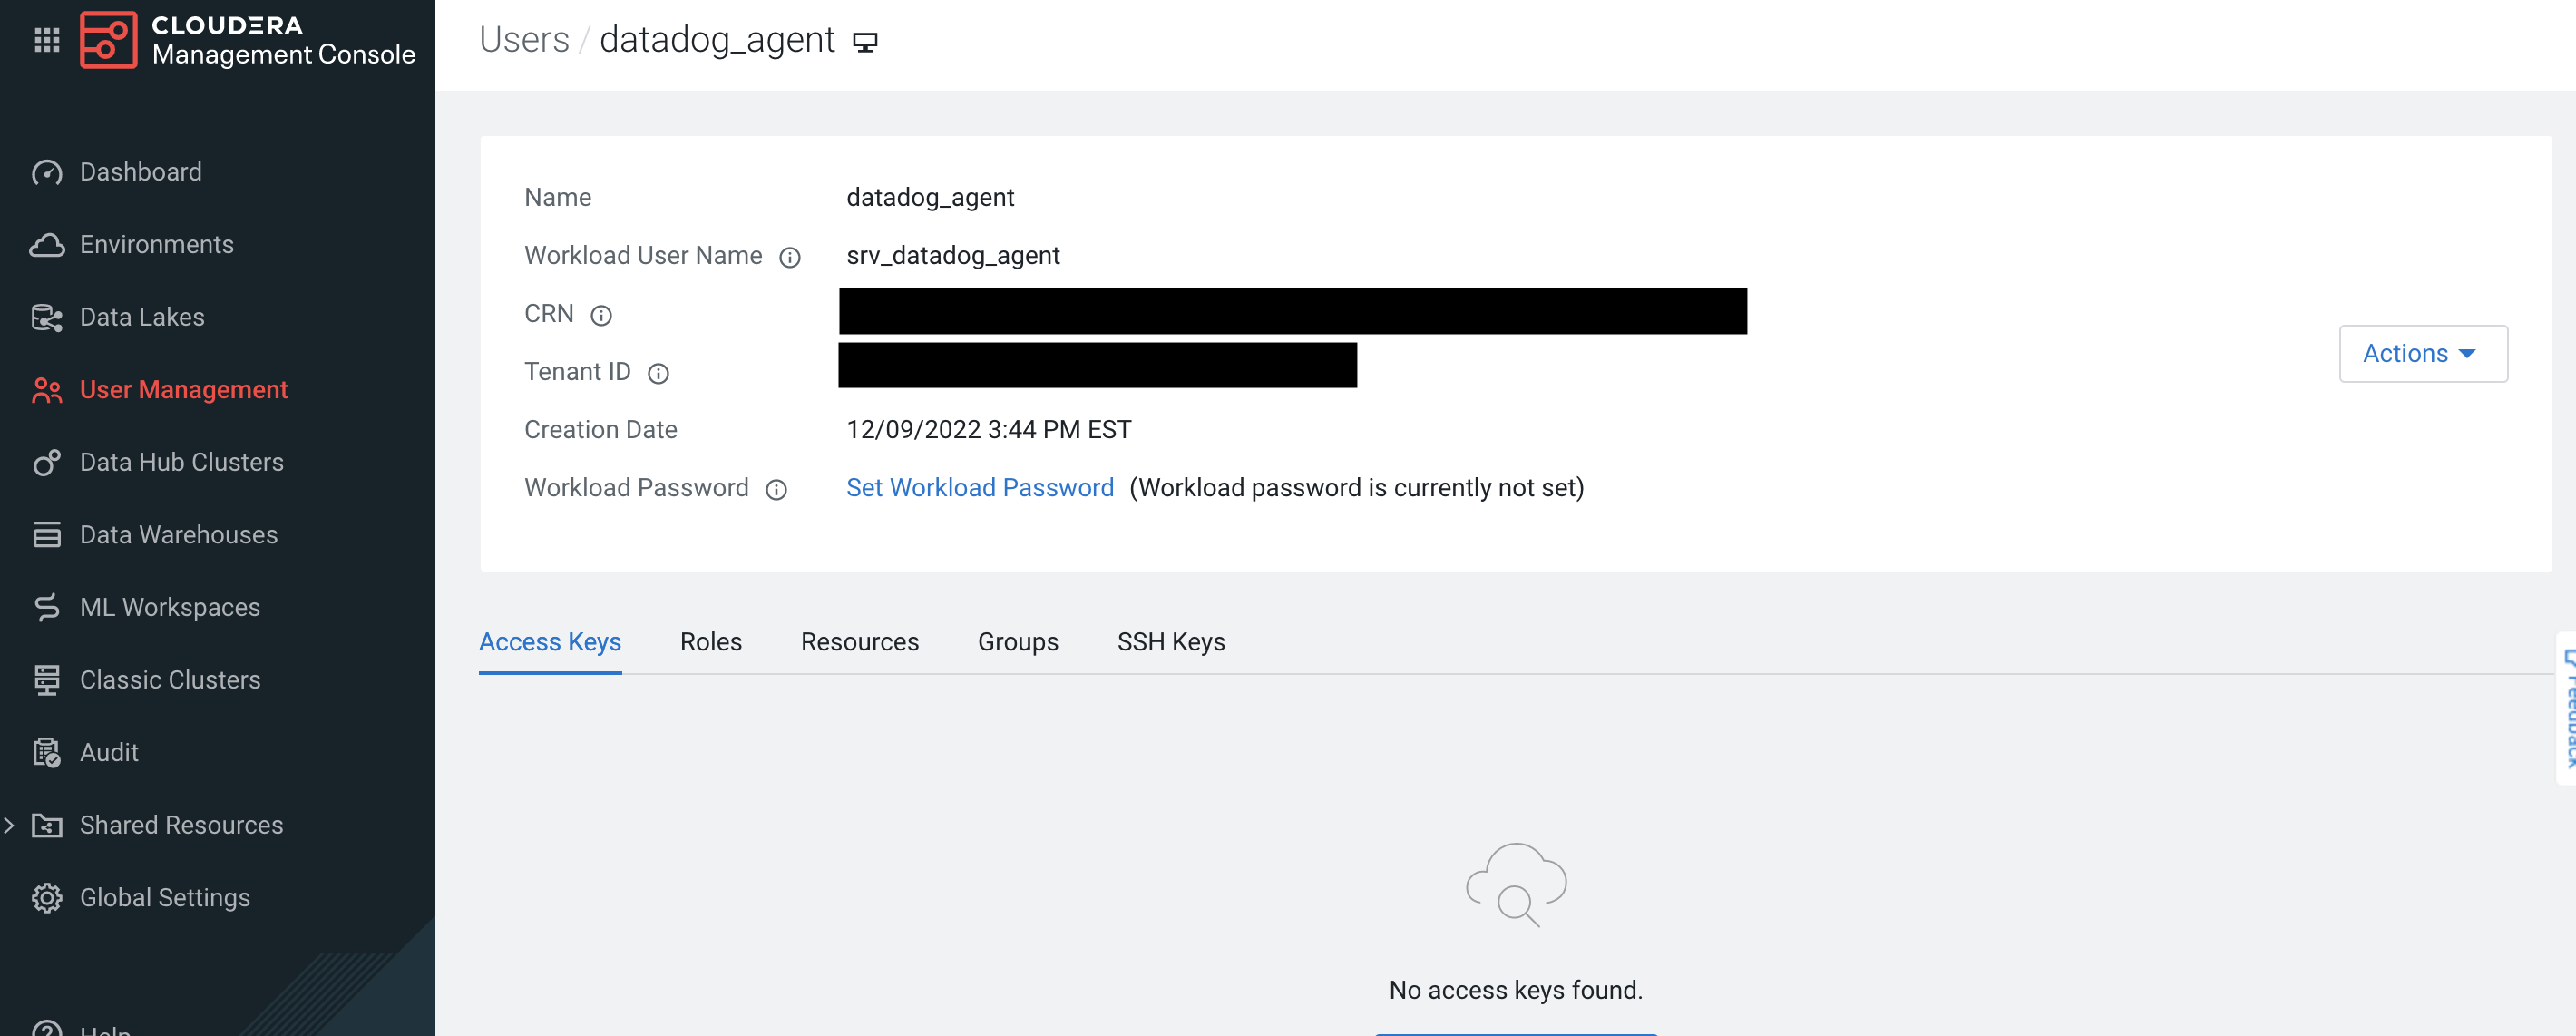
init_config:## @param workload_username - string - required## The Workload username. This value can be found in the `User Management` tab of the Management ## Console in the `Workload User Name`.#workload_username:<WORKLOAD_USERNAME>## @param workload_password - string - required## The Workload password. This value can be found in the `User Management` tab of the Management ## Console in the `Workload Password`.#workload_password:<WORKLOAD_PASSWORD>## Every instance is scheduled independently of the others.#instances:## @param api_url - string - required## The URL endpoint for the Cloudera Manager API. This can be found under the Endpoints tab for ## your Data Hub to monitor. #### Note: The version of the Cloudera Manager API needs to be appended at the end of the URL. ## For example, using v48 of the API for Data Hub `cluster_1` should result with a URL similar ## to the following:## `https://cluster1.cloudera.site/cluster_1/cdp-proxy-api/cm-api/v48`#- api_url:<API_URL>
Restart the Agent to start collecting and sending Cloudera Data Hub cluster data to Datadog.
You can configure the Cloudera integration to collect custom metrics that are not be collected by default by running custom timeseries queries. These queries use the tsquery language to retrieve data from Cloudera Manager.
Example:
Collect JVM garbage collection rate and JVM free memory with cloudera_jvm as a custom tag:
custom_queries:- query:select last(jvm_gc_rate) as jvm_gc_rate, last(jvm_free_memory) as jvm_free_memorytags:cloudera_jvm
Note: These queries can take advantage of metric expressions, resulting in queries such as total_cpu_user + total_cpu_system, 1000 * jvm_gc_time_ms / jvm_gc_count, and max(total_cpu_user). When using metric expressions, make sure to also include aliases for the metrics, otherwise the metric names may be incorrectly formatted. For example, SELECT last(jvm_gc_count) results in the metric cloudera.<CATEGORY>.last_jvm_gc_count. You can append an alias like in the following example: SELECT last(jvm_gc_count) as jvm_gc_count to generate the metric cloudera.<CATEGORY>.jvm_gc_count.
The Cloudera integration collects events that are emitted from the /events endpoint from the Cloudera Manager API. The event levels are mapped as the following:
cloudera.can_connect Returns OK if the check is able to connect to the Cloudera Manager API and collect metrics, CRITICAL otherwise. Statuses: ok, critical
cloudera.cluster.health Returns OK if the cluster is in good health or is starting, WARNING if the cluster is stopping or the health is concerning, CRITICAL if the cluster is down or in bad health, and UNKNOWN otherwise. Statuses: ok, critical, warning, unknown
cloudera.host.health Returns OK if the host is in good health or is starting, WARNING if the host is stopping or the health is concerning, CRITICAL if the host is down or in bad health, and UNKNOWN otherwise. Statuses: ok, critical, warning, unknown
To install the Datadog Agent on a Cloudera host, make sure that the security group associated with the host allows SSH access.
Then, you need to use the root user cloudbreak when accessing the host with the SSH key generated during the environment creation:
The workload username and password can be used to access Cloudera hosts through SSH, although only the cloudbreak user can install the Datadog Agent.
Trying to use any user that is not cloudbreak may result in the following error:
<NON_CLOUDBREAK_USER> is not allowed to run sudo on <CLOUDERA_HOSTNAME>. This incident will be reported.