- Principales informations
- Getting Started
- Datadog
- Site Datadog
- DevSecOps
- Serverless for AWS Lambda
- Agent
- Intégrations
- Conteneurs
- Dashboards
- Monitors
- Logs
- Tracing
- Profileur
- Tags
- API
- Service Catalog
- Session Replay
- Continuous Testing
- Surveillance Synthetic
- Incident Management
- Database Monitoring
- Cloud Security Management
- Cloud SIEM
- Application Security Management
- Workflow Automation
- CI Visibility
- Test Visibility
- Intelligent Test Runner
- Code Analysis
- Learning Center
- Support
- Glossary
- Standard Attributes
- Guides
- Agent
- Intégrations
- OpenTelemetry
- Développeurs
- Authorization
- DogStatsD
- Checks custom
- Intégrations
- Create an Agent-based Integration
- Create an API Integration
- Create a Log Pipeline
- Integration Assets Reference
- Build a Marketplace Offering
- Create a Tile
- Create an Integration Dashboard
- Create a Recommended Monitor
- Create a Cloud SIEM Detection Rule
- OAuth for Integrations
- Install Agent Integration Developer Tool
- Checks de service
- IDE Plugins
- Communauté
- Guides
- API
- Application mobile
- CoScreen
- Cloudcraft
- In The App
- Dashboards
- Notebooks
- DDSQL Editor
- Alertes
- Infrastructure
- Métriques
- Watchdog
- Bits AI
- Service Catalog
- API Catalog
- Error Tracking
- Service Management
- Infrastructure
- Universal Service Monitoring
- Conteneurs
- Sans serveur
- Surveillance réseau
- Cloud Cost
- Application Performance
- APM
- Profileur en continu
- Database Monitoring
- Agent Integration Overhead
- Setup Architectures
- Configuration de Postgres
- Configuration de MySQL
- Configuration de SQL Server
- Setting Up Oracle
- Setting Up MongoDB
- Connecting DBM and Traces
- Données collectées
- Exploring Database Hosts
- Explorer les métriques de requête
- Explorer des échantillons de requêtes
- Dépannage
- Guides
- Data Streams Monitoring
- Data Jobs Monitoring
- Digital Experience
- RUM et Session Replay
- Product Analytics
- Surveillance Synthetic
- Continuous Testing
- Software Delivery
- CI Visibility
- CD Visibility
- Test Visibility
- Exécuteur de tests intelligent
- Code Analysis
- Quality Gates
- DORA Metrics
- Securité
- Security Overview
- Cloud SIEM
- Cloud Security Management
- Application Security Management
- AI Observability
- Log Management
- Pipelines d'observabilité
- Log Management
- Administration
Trace View
Cette page n'est pas encore disponible en français, sa traduction est en cours.
Si vous avez des questions ou des retours sur notre projet de traduction actuel, n'hésitez pas à nous contacter.
Si vous avez des questions ou des retours sur notre projet de traduction actuel, n'hésitez pas à nous contacter.
Overview
View an individual trace to see all of its spans and associated metadata. Each trace can be visualized as either a Flame Graph, Span List, Waterfall, or Map.
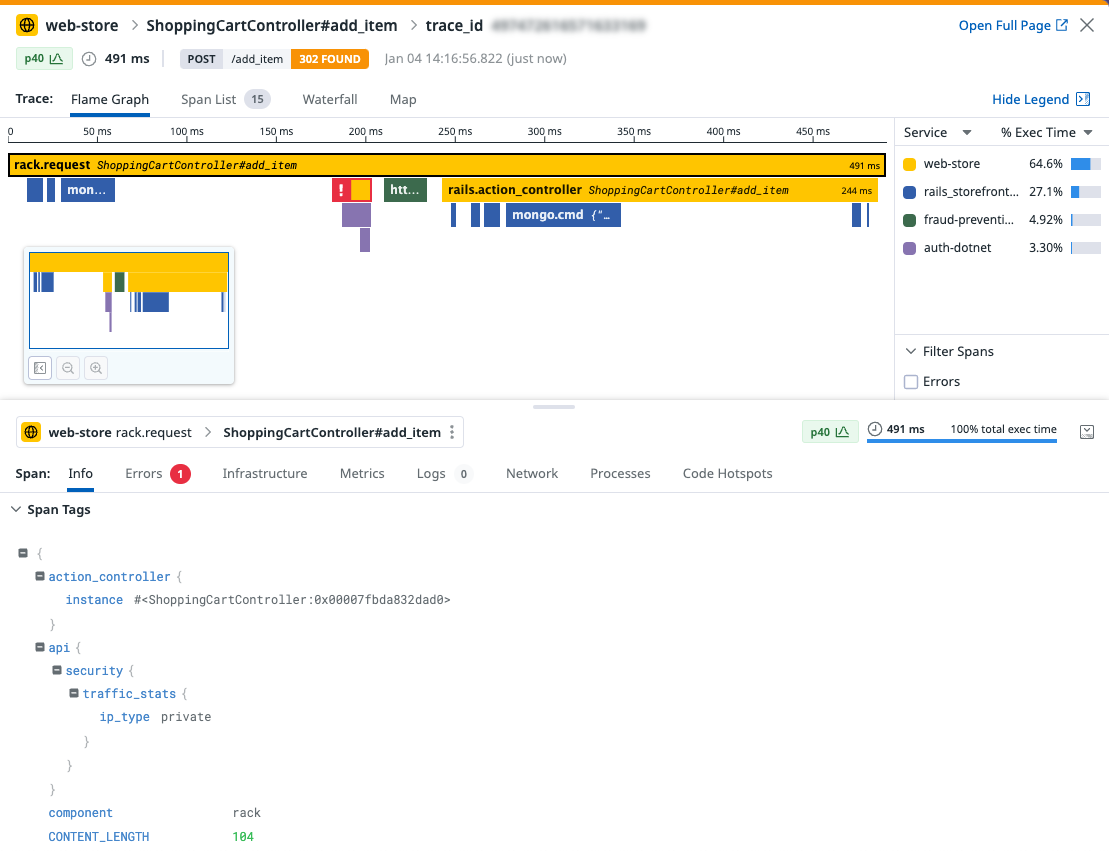
The trace header displays critical trace information, including the root span’s service name, resource name, trace ID, end-to-end trace duration, and the trace start time. To get a permalink to the trace, click Open Full Page and save the URL.
Trace visualizations
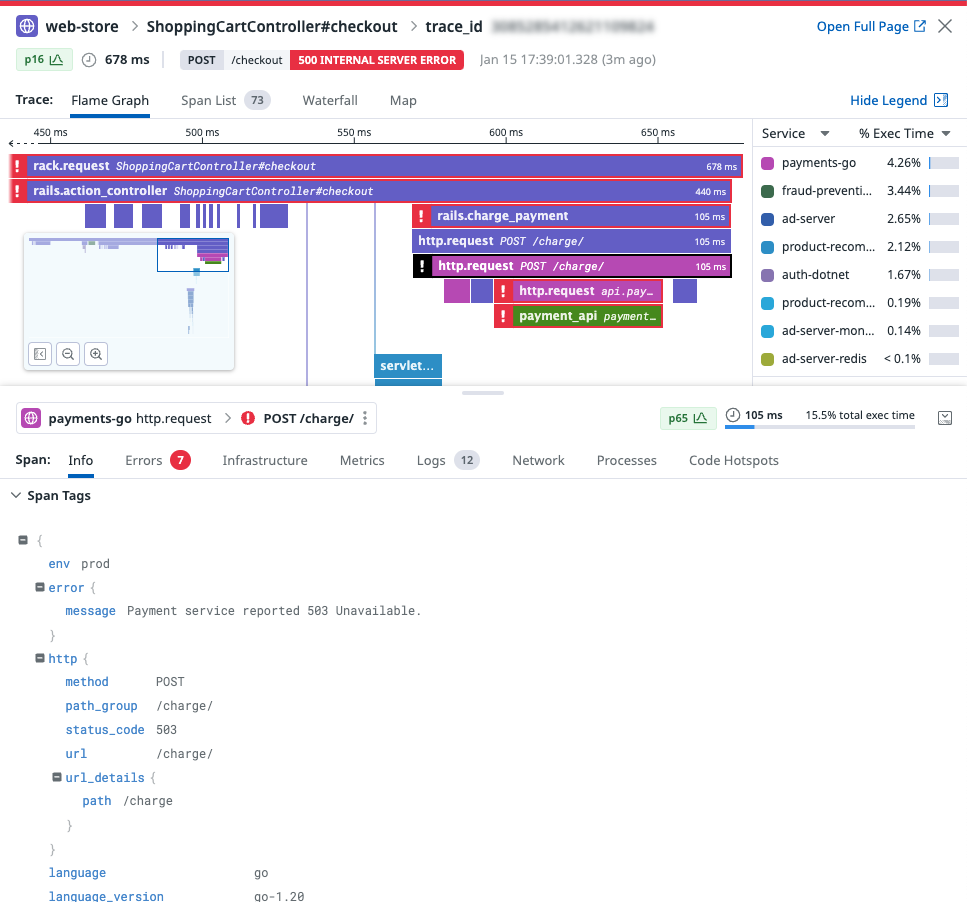
The Flame Graph is the default visualization that displays all the color-coded spans from a trace on a timeline. This is useful for understanding the execution path of a request and where time was spent over a trace.
To navigate the graph, scroll to zoom, click and drag to move around, and use the minimap to zoom into the selected span or zoom out to the full trace.
The legend details the color coding of the flame graph. Group spans by either Service (default), Host, or Container. Choose to display either the percentage of trace execution time (% Exec Time) or span count (Spans) by group. If errors exist on spans in the trace, highlight them in the flame graph by selecting the Errors checkbox under Filter Spans.
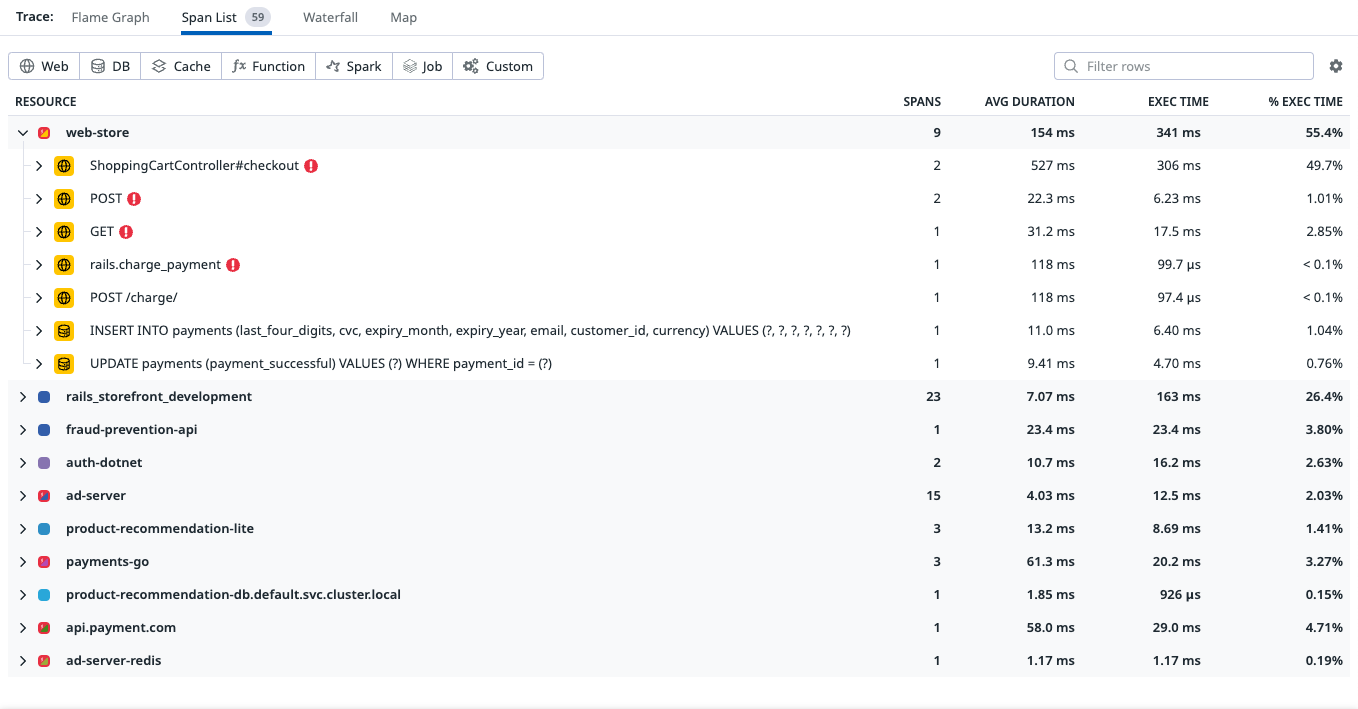
Displays resources by group (service by default) and sorts them according to their count of spans. This visualization is useful for scanning latency information by resource or grouping.
Filter resources by type or naming information using the corresponding buttons and text-based search.
Groups can be sorted by clicking on the corresponding column header: RESOURCE, SPANS, average duration (AVG DURATION), execution time (EXEC TIME), or percentage of trace execution time (% EXEC TIME).
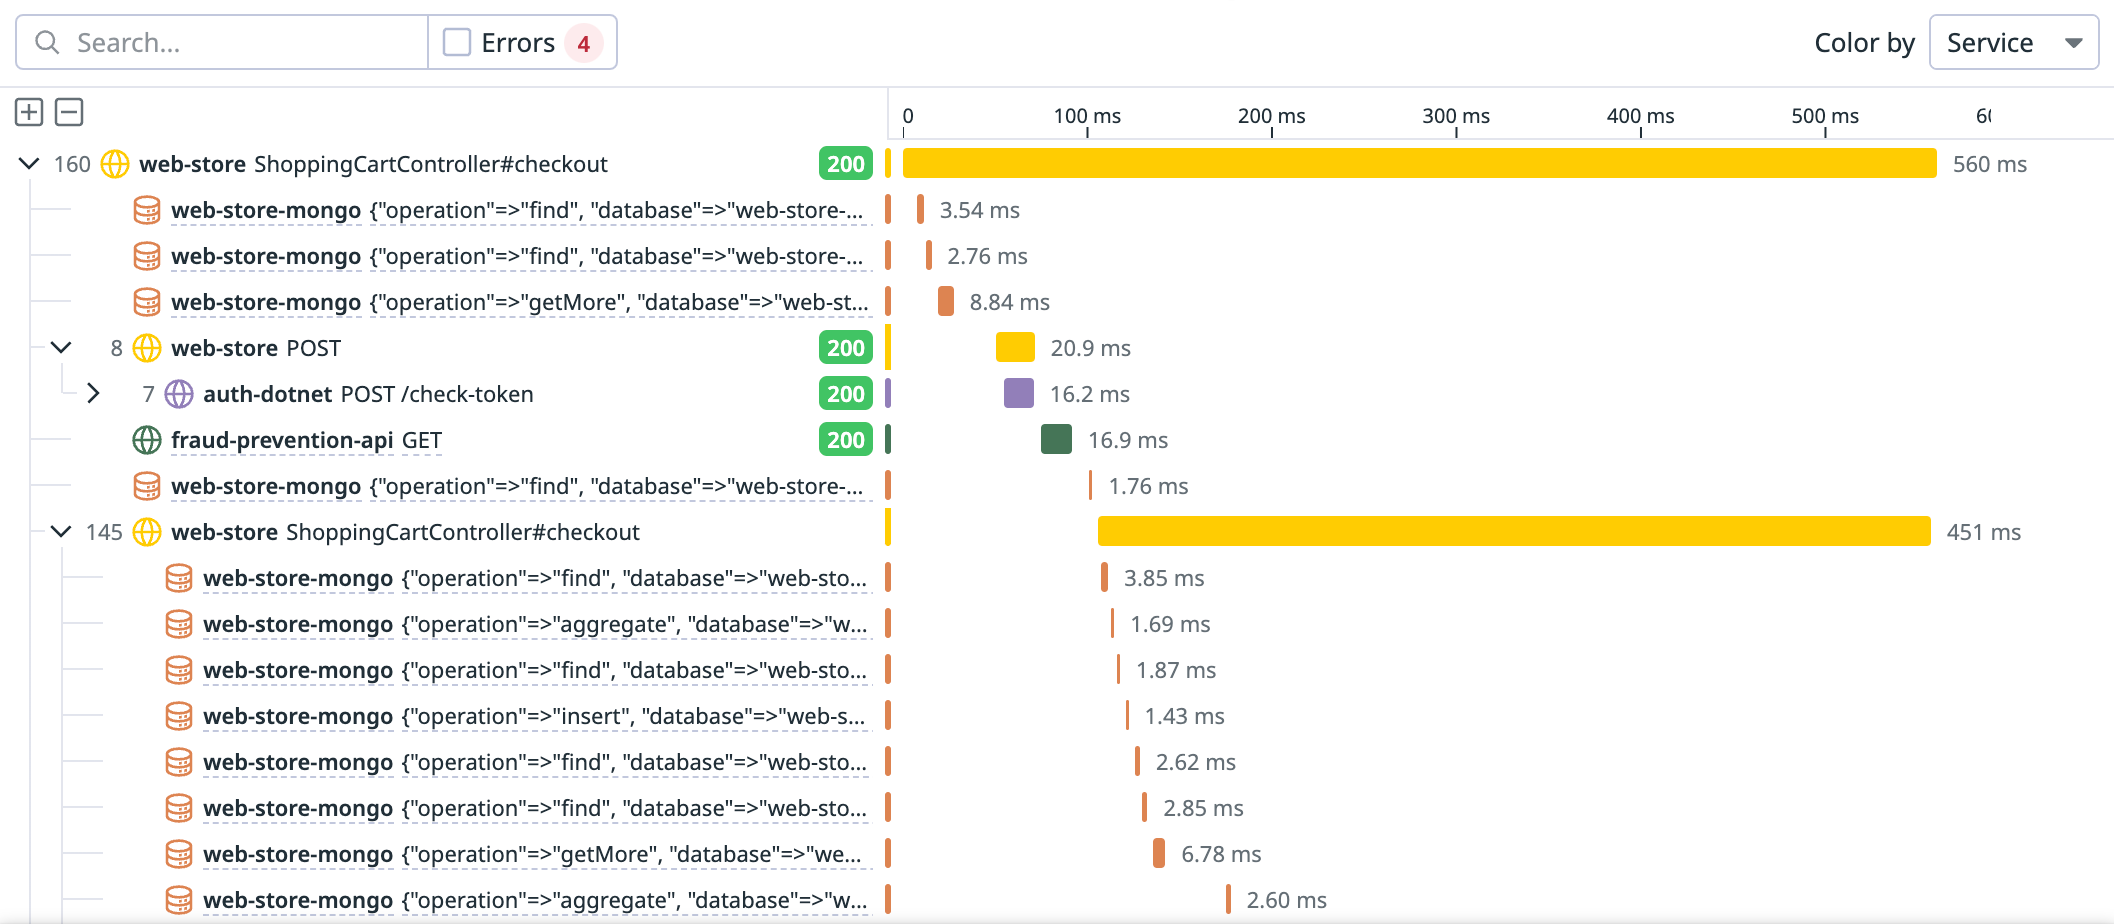
Displays all spans for a trace on a timeline where each row corresponds to a span. This visualization is useful for isolating and focusing on relevant parts of a trace.
Each row (span) indicates the following:
- Relative span duration: The length of the color-coded bar corresponds to the percentage of total trace duration.
- Absolute span duration: The absolute time in milliseconds (ms).
- Span details: The corresponding service name and resource name are displayed.
- Statuses: When applicable, an HTTP status code is displayed.
- Color coding: Spans are color-coded by service (default), host, or container. To change how spans are color-coded, use the Color by dropdown.
To expand or collapse span descendants, click the chevron (>) icon on a row. To expand or collapse all spans, click the Expand all (+) or Collapse all (-) buttons.
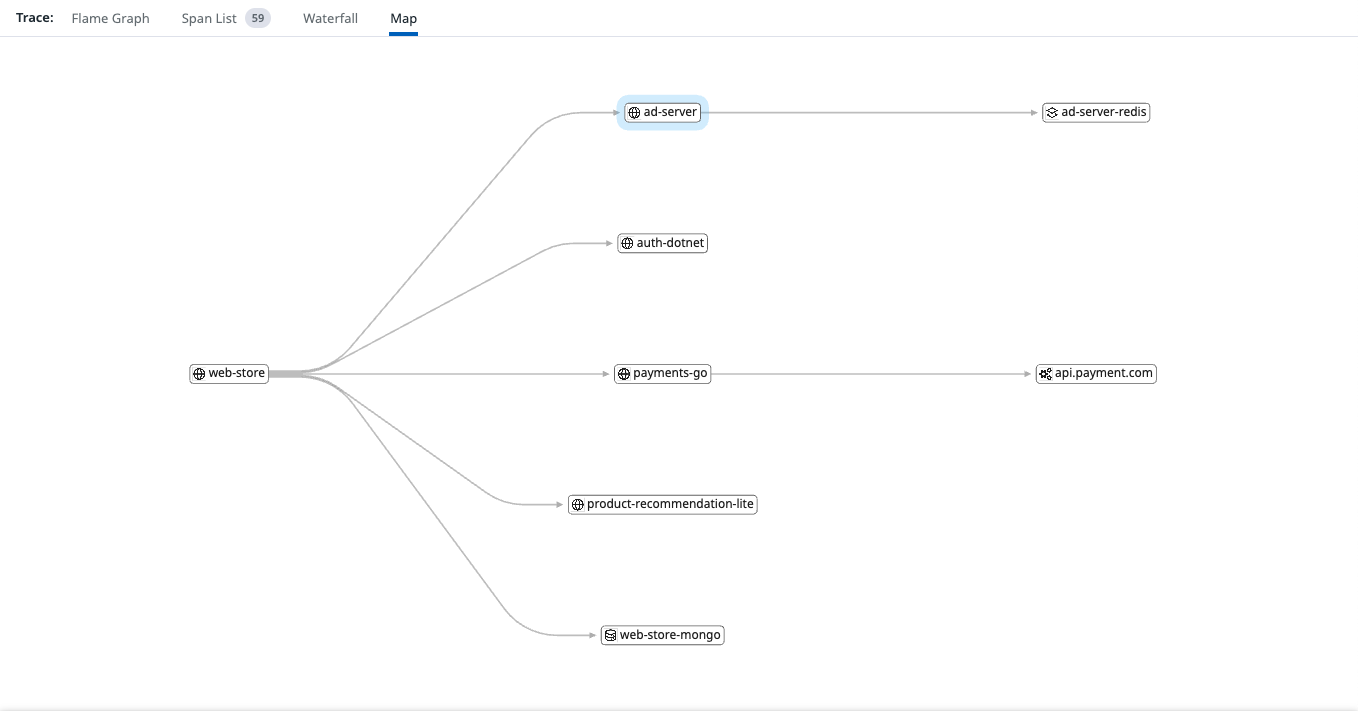
Displays a representation of all the services involved in the trace. This visualization is useful for getting a high-level overview of the services’ dependencies and transaction lifecycle at a service level.
Hover over a service to highlight its parent and children, and click on it to focus on the service entry span.
More information
The height-adjustable bottom of the Trace View shows selected span and trace information.
The span header contains service, operation, and resource names of the selected span as well as latency information. Pivot to other parts of the platform or narrow down your Trace Explorer search by clicking on the naming pill.
See all span metadata, including custom tags. Click on a span tag to update the search query in the Trace Explorer or copy the tag’s value to the clipboard.
Other information may be displayed under various conditions:
A git warning message (when git information is missing on a CI Test)
SQL Query markup (on a SQL query)
RUM Context and Metadata (on a RUM span)
Spark Metrics (on a Spark job span)
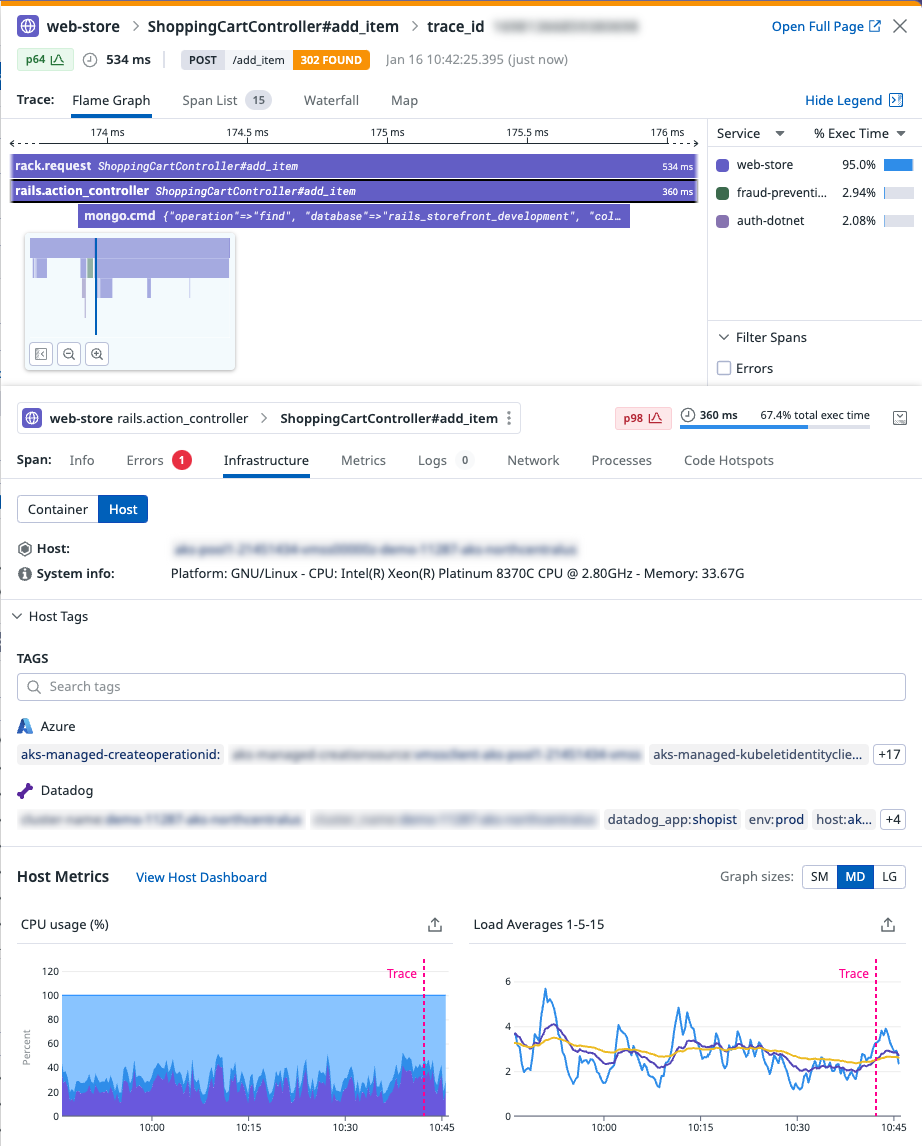
Toggle between host-level and container-level (when available) infrastructure information for the selected span.
See associated tags, as well as critical host/container metrics graphs including CPU, Memory, and I/O with an overlay of when the trace occurred.
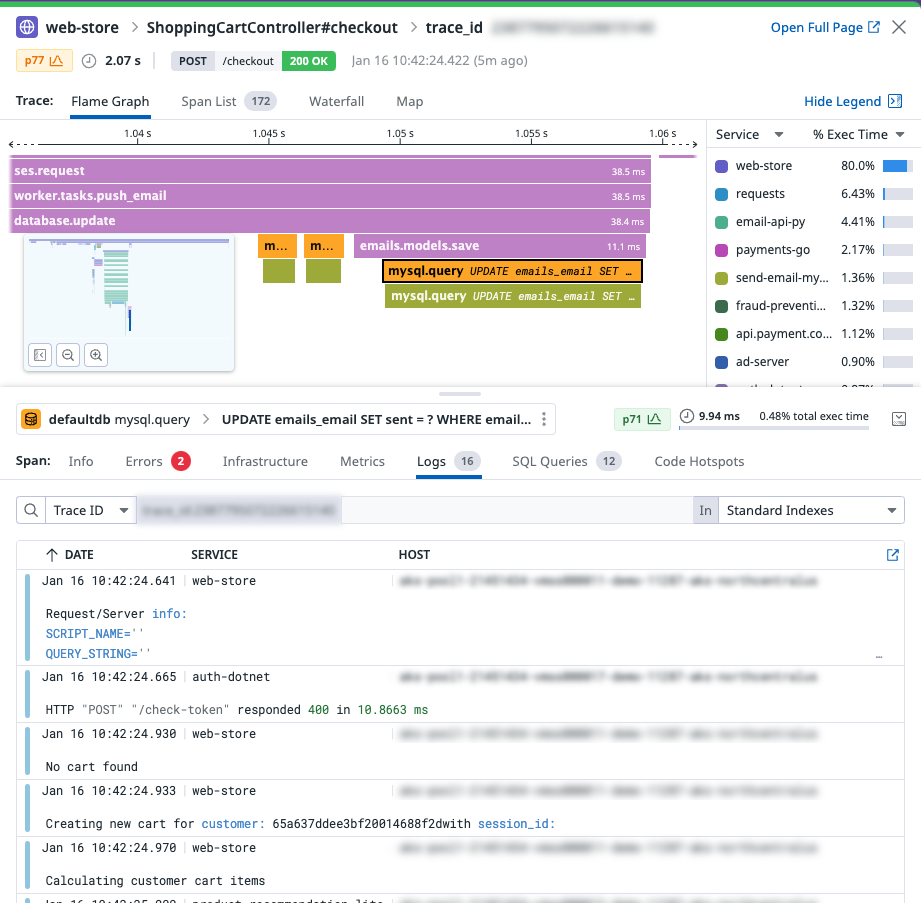
See logs related to your service at the time of the trace. When you hover over a log, a line showing its timestamp is displayed on the trace flame graph. Clicking on the log brings you to the Log Explorer search.
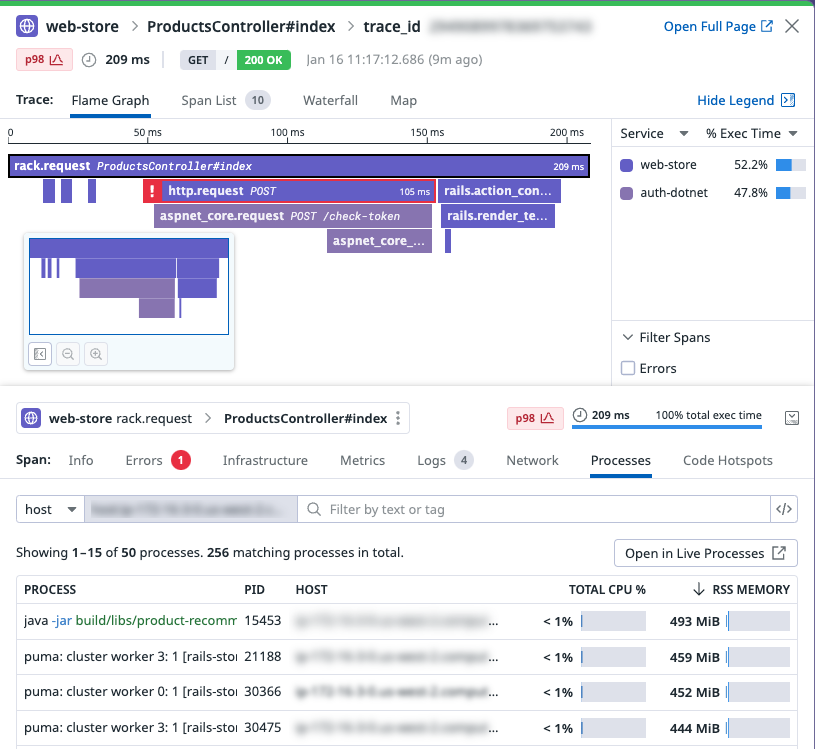
Click on a service’s span to see the processes running on its underlying infrastructure. A service’s span processes are correlated with the hosts or pods on which the service runs at the time of the request. You can analyze process metrics such as CPU and RSS memory alongside code-level errors to distinguish between application-specific and wider infrastructure issues. Clicking on a process will bring you to the Live Processes page. To view span-specific processes, enable process collection. Related processes are not currently supported for serverless and browser traces.
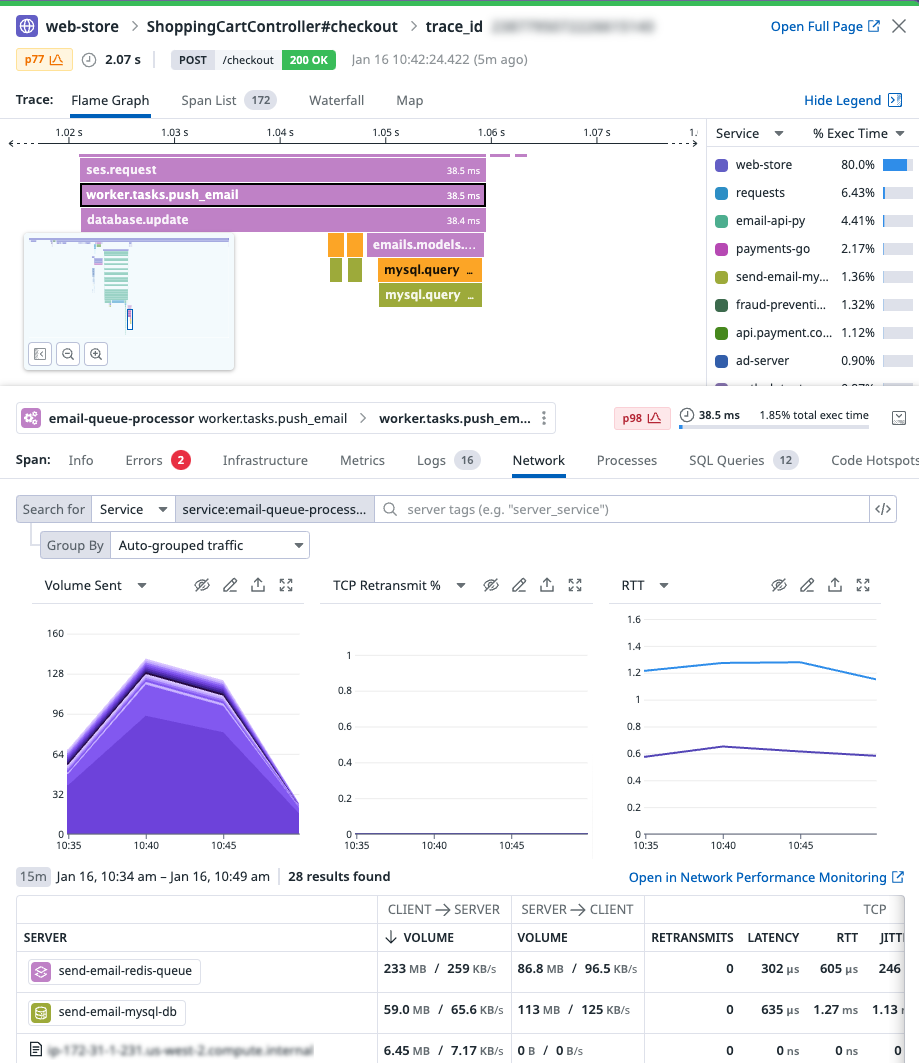
Click on a service’s span to see network dependencies of the service making the request. Use key network performance metrics such as volume, errors (TCP retransmits), and network latency (TCP round-trip time) to differentiate between application-specific and network-wide issues, especially when no code errors have been generated. For instance, you can use network telemetry to determine if high request latency is due to traffic overloading of the relevant application, or faulty dependencies with a downstream pod, security group, or any other tagged endpoint. Clicking on a process brings you to the Network Analytics page. To view span-specific processes, enable Network Performance Monitoring.
Note: Related network telemetry is not currently supported for serverless traces.
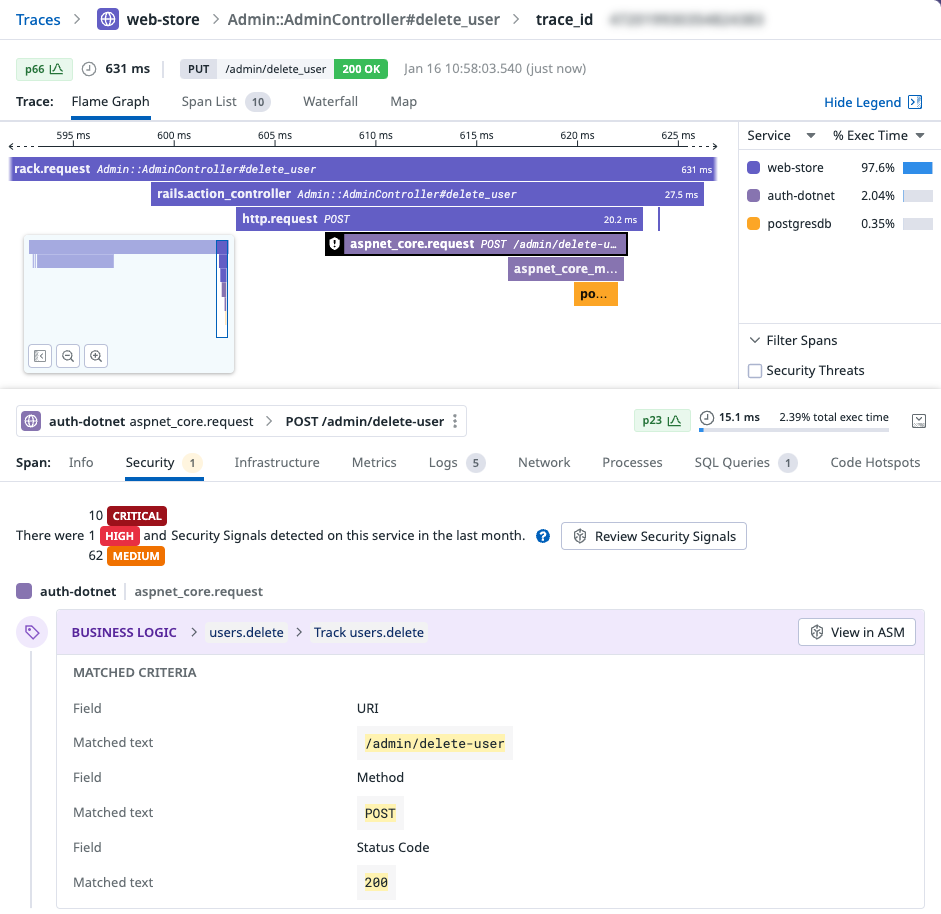
See attack attempts that target the services of the distributed trace. You can see the pattern used by the attacker, the rule that detects the attack, and whether the attacker found a vulnerability in your service.
Click View in ASM to investigate further using Datadog Application Security Management.
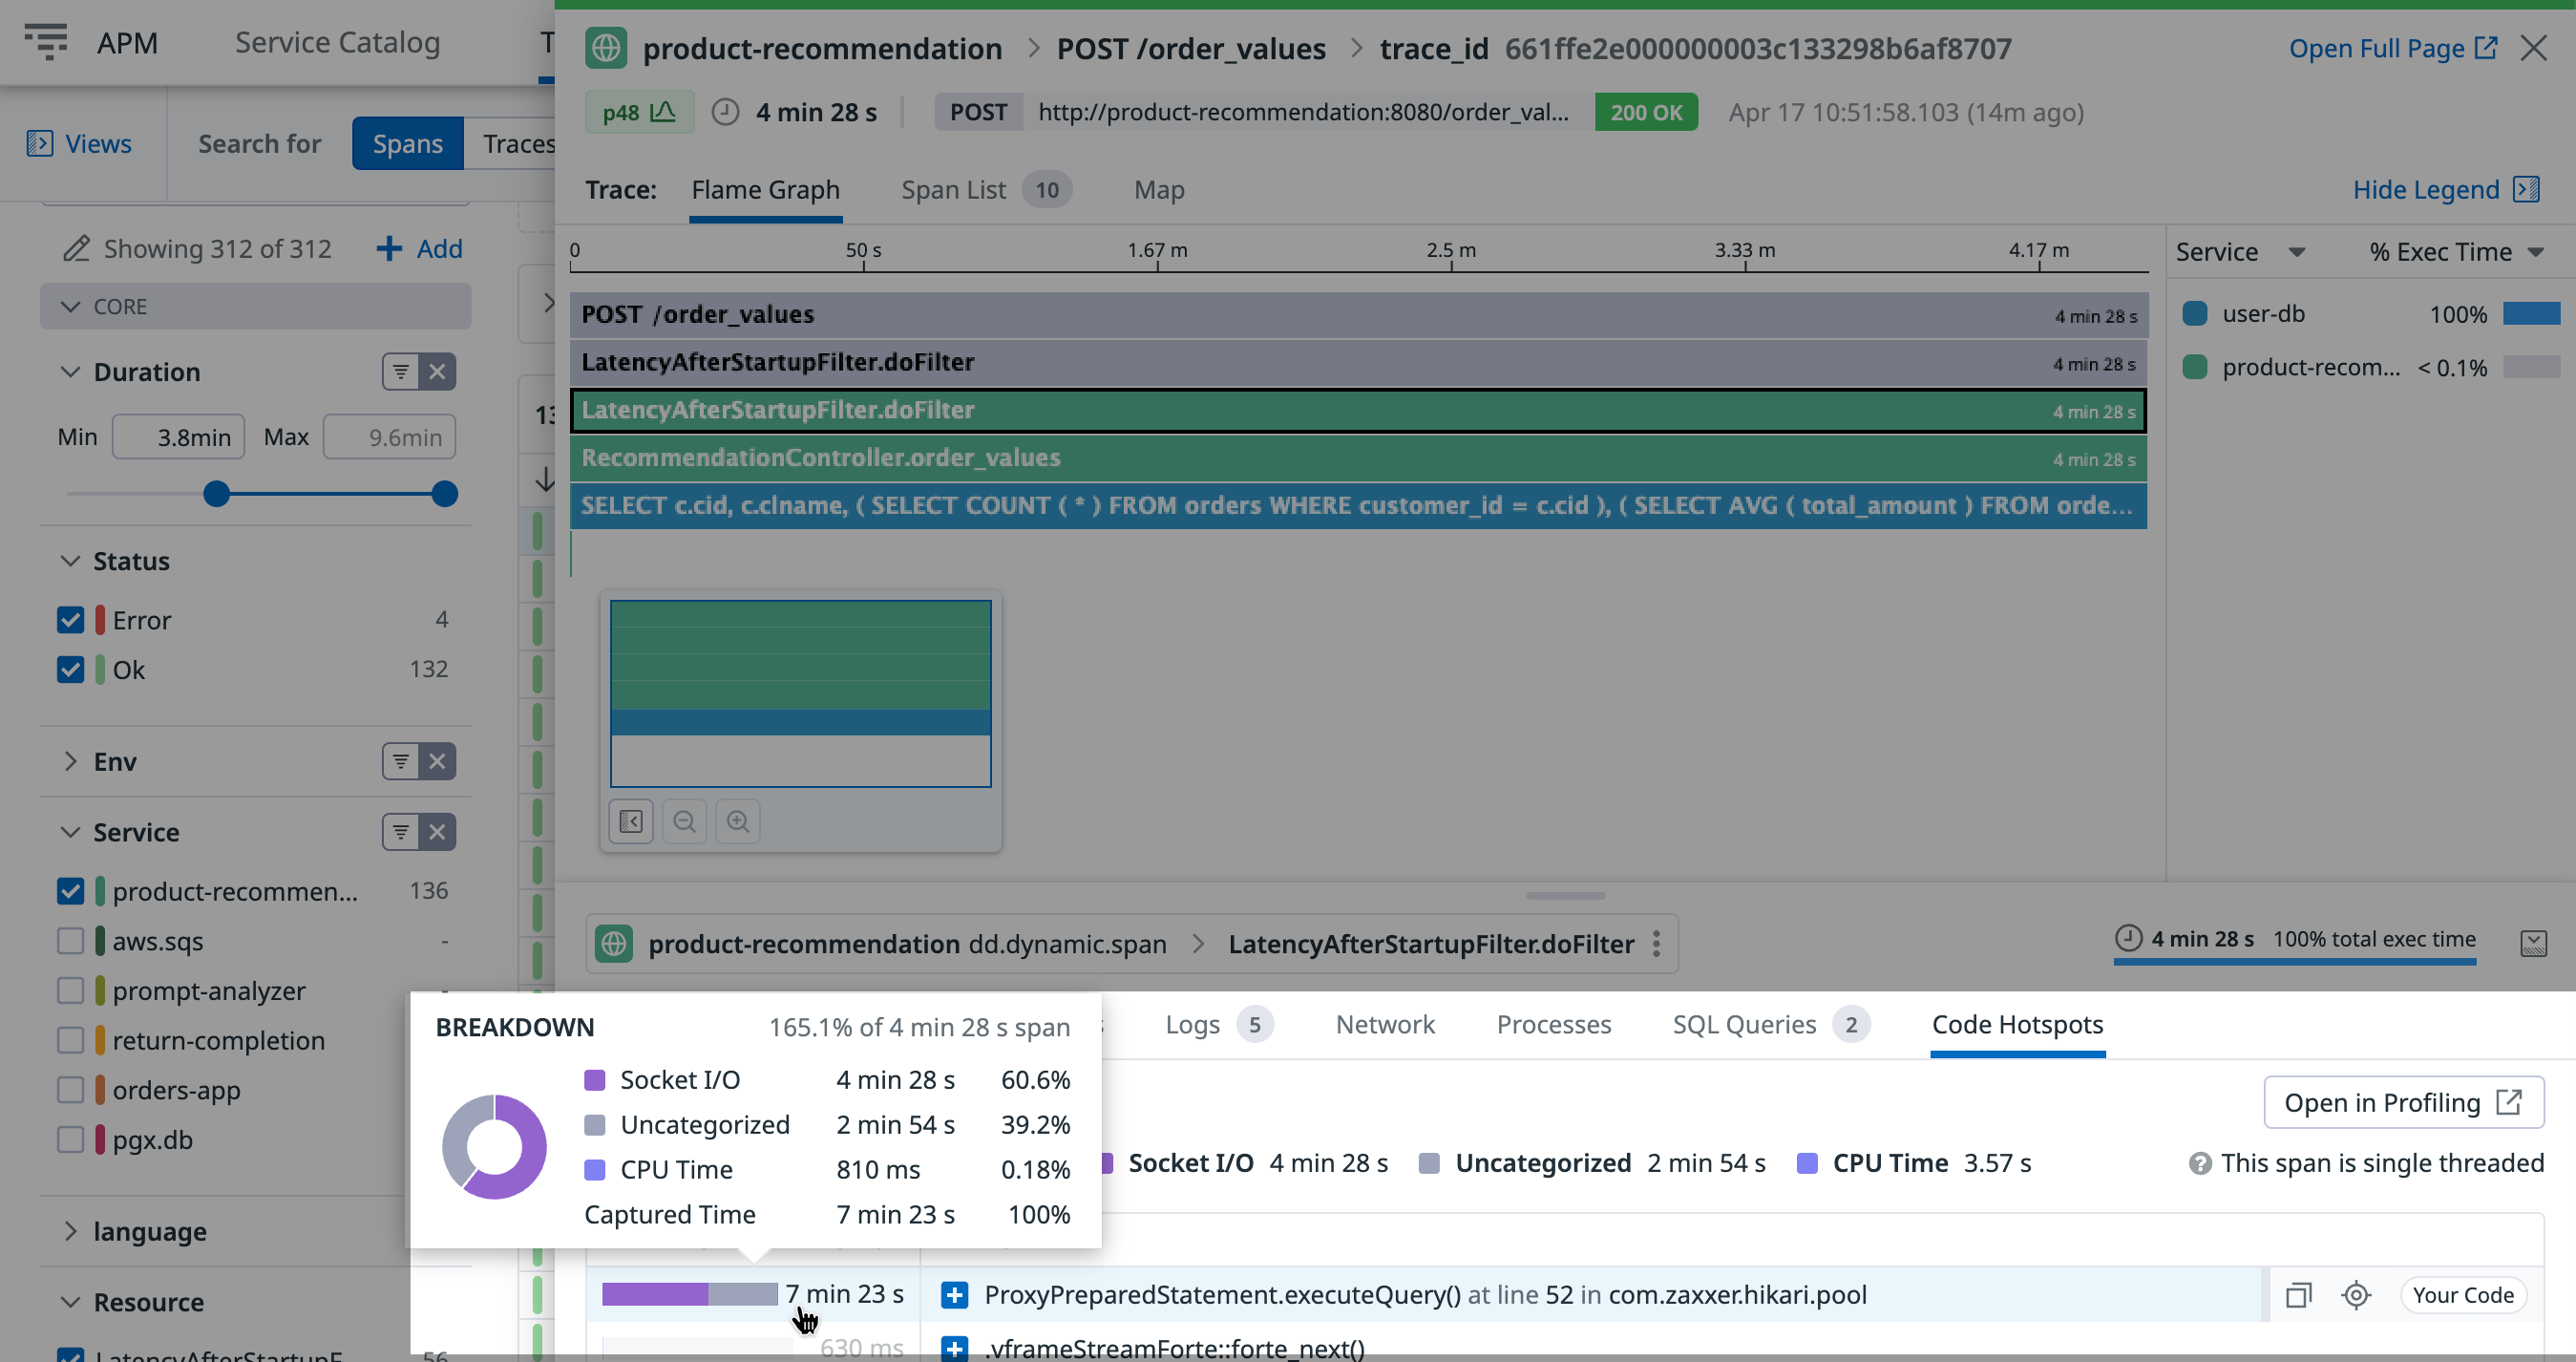
View Code Hotspots to identify lines of code related to performance issues. The values on the left side represent the time spent in each method call during the selected span.
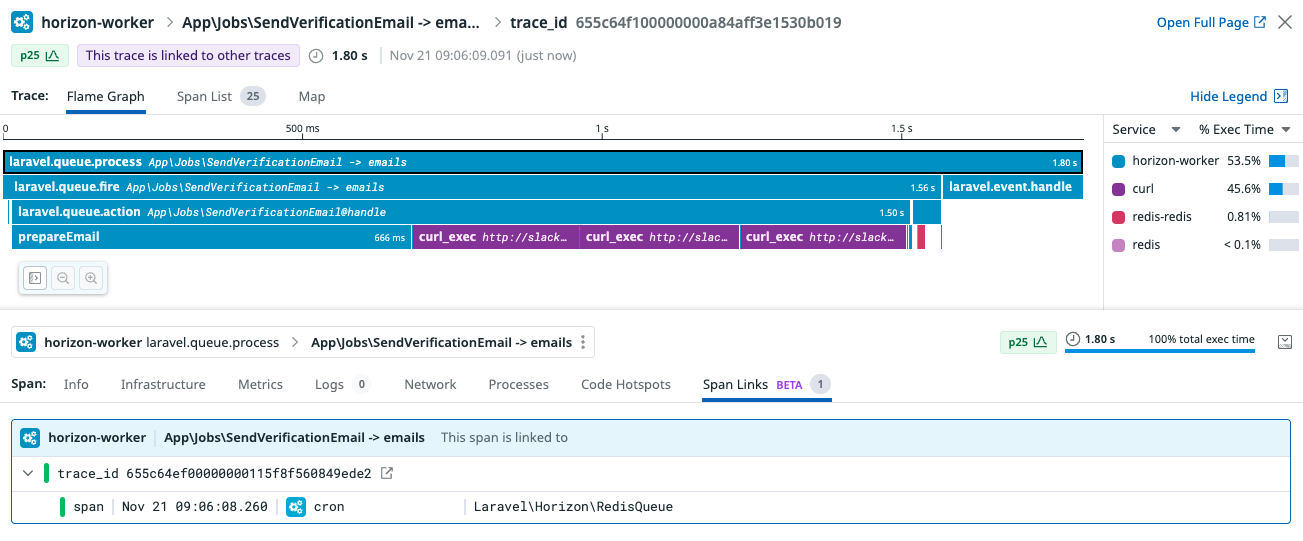
Span link support is in beta.
Span links correlate one or more spans together that are causally related but don’t have a typical parent-child relationship.
Click a span in the flame graph to display spans connected with span links:
Note: Span links only display when the corresponding spans are ingested and indexed, for example, with a retention filter.
To learn more about span links and how to add them with custom instrumentation, read Span Links.
Further Reading
Documentation, liens et articles supplémentaires utiles:
