- Essentials
- Getting Started
- Datadog
- Datadog Site
- DevSecOps
- Serverless for AWS Lambda
- Agent
- Integrations
- Containers
- Dashboards
- Monitors
- Logs
- APM Tracing
- Profiler
- Tags
- API
- Service Catalog
- Session Replay
- Continuous Testing
- Synthetic Monitoring
- Incident Management
- Database Monitoring
- Cloud Security Management
- Cloud SIEM
- Application Security Management
- Workflow Automation
- CI Visibility
- Test Visibility
- Intelligent Test Runner
- Code Analysis
- Learning Center
- Support
- Glossary
- Standard Attributes
- Guides
- Agent
- Integrations
- OpenTelemetry
- Developers
- Authorization
- DogStatsD
- Custom Checks
- Integrations
- Create an Agent-based Integration
- Create an API Integration
- Create a Log Pipeline
- Integration Assets Reference
- Build a Marketplace Offering
- Create a Tile
- Create an Integration Dashboard
- Create a Recommended Monitor
- Create a Cloud SIEM Detection Rule
- OAuth for Integrations
- Install Agent Integration Developer Tool
- Service Checks
- IDE Plugins
- Community
- Guides
- API
- Datadog Mobile App
- CoScreen
- Cloudcraft
- In The App
- Dashboards
- Notebooks
- DDSQL Editor
- Sheets
- Monitors and Alerting
- Infrastructure
- Metrics
- Watchdog
- Bits AI
- Service Catalog
- API Catalog
- Error Tracking
- Service Management
- Infrastructure
- Application Performance
- APM
- Continuous Profiler
- Database Monitoring
- Data Streams Monitoring
- Data Jobs Monitoring
- Digital Experience
- Real User Monitoring
- Product Analytics
- Synthetic Testing and Monitoring
- Continuous Testing
- Software Delivery
- CI Visibility
- CD Visibility
- Test Visibility
- Intelligent Test Runner
- Code Analysis
- Quality Gates
- DORA Metrics
- Security
- Security Overview
- Cloud SIEM
- Cloud Security Management
- Application Security Management
- AI Observability
- Log Management
- Observability Pipelines
- Log Management
- Administration
Cloudera
Supported OS
Integration version2.2.0
Overview
This integration monitors your Cloudera Data Platform through the Datadog Agent, allowing you to submit metrics and service checks on the health of your Cloudera Data Hub clusters, hosts, and roles.
Setup
Follow the instructions below to install and configure this check for an Agent running on a host. For containerized environments, see the Autodiscovery Integration Templates for guidance on applying these instructions.
Installation
The Cloudera check is included in the Datadog Agent package. No additional installation is needed on your server.
Configuration
Requirements
The Cloudera check requires version 7 of Cloudera Manager.
Prepare Cloudera Manager
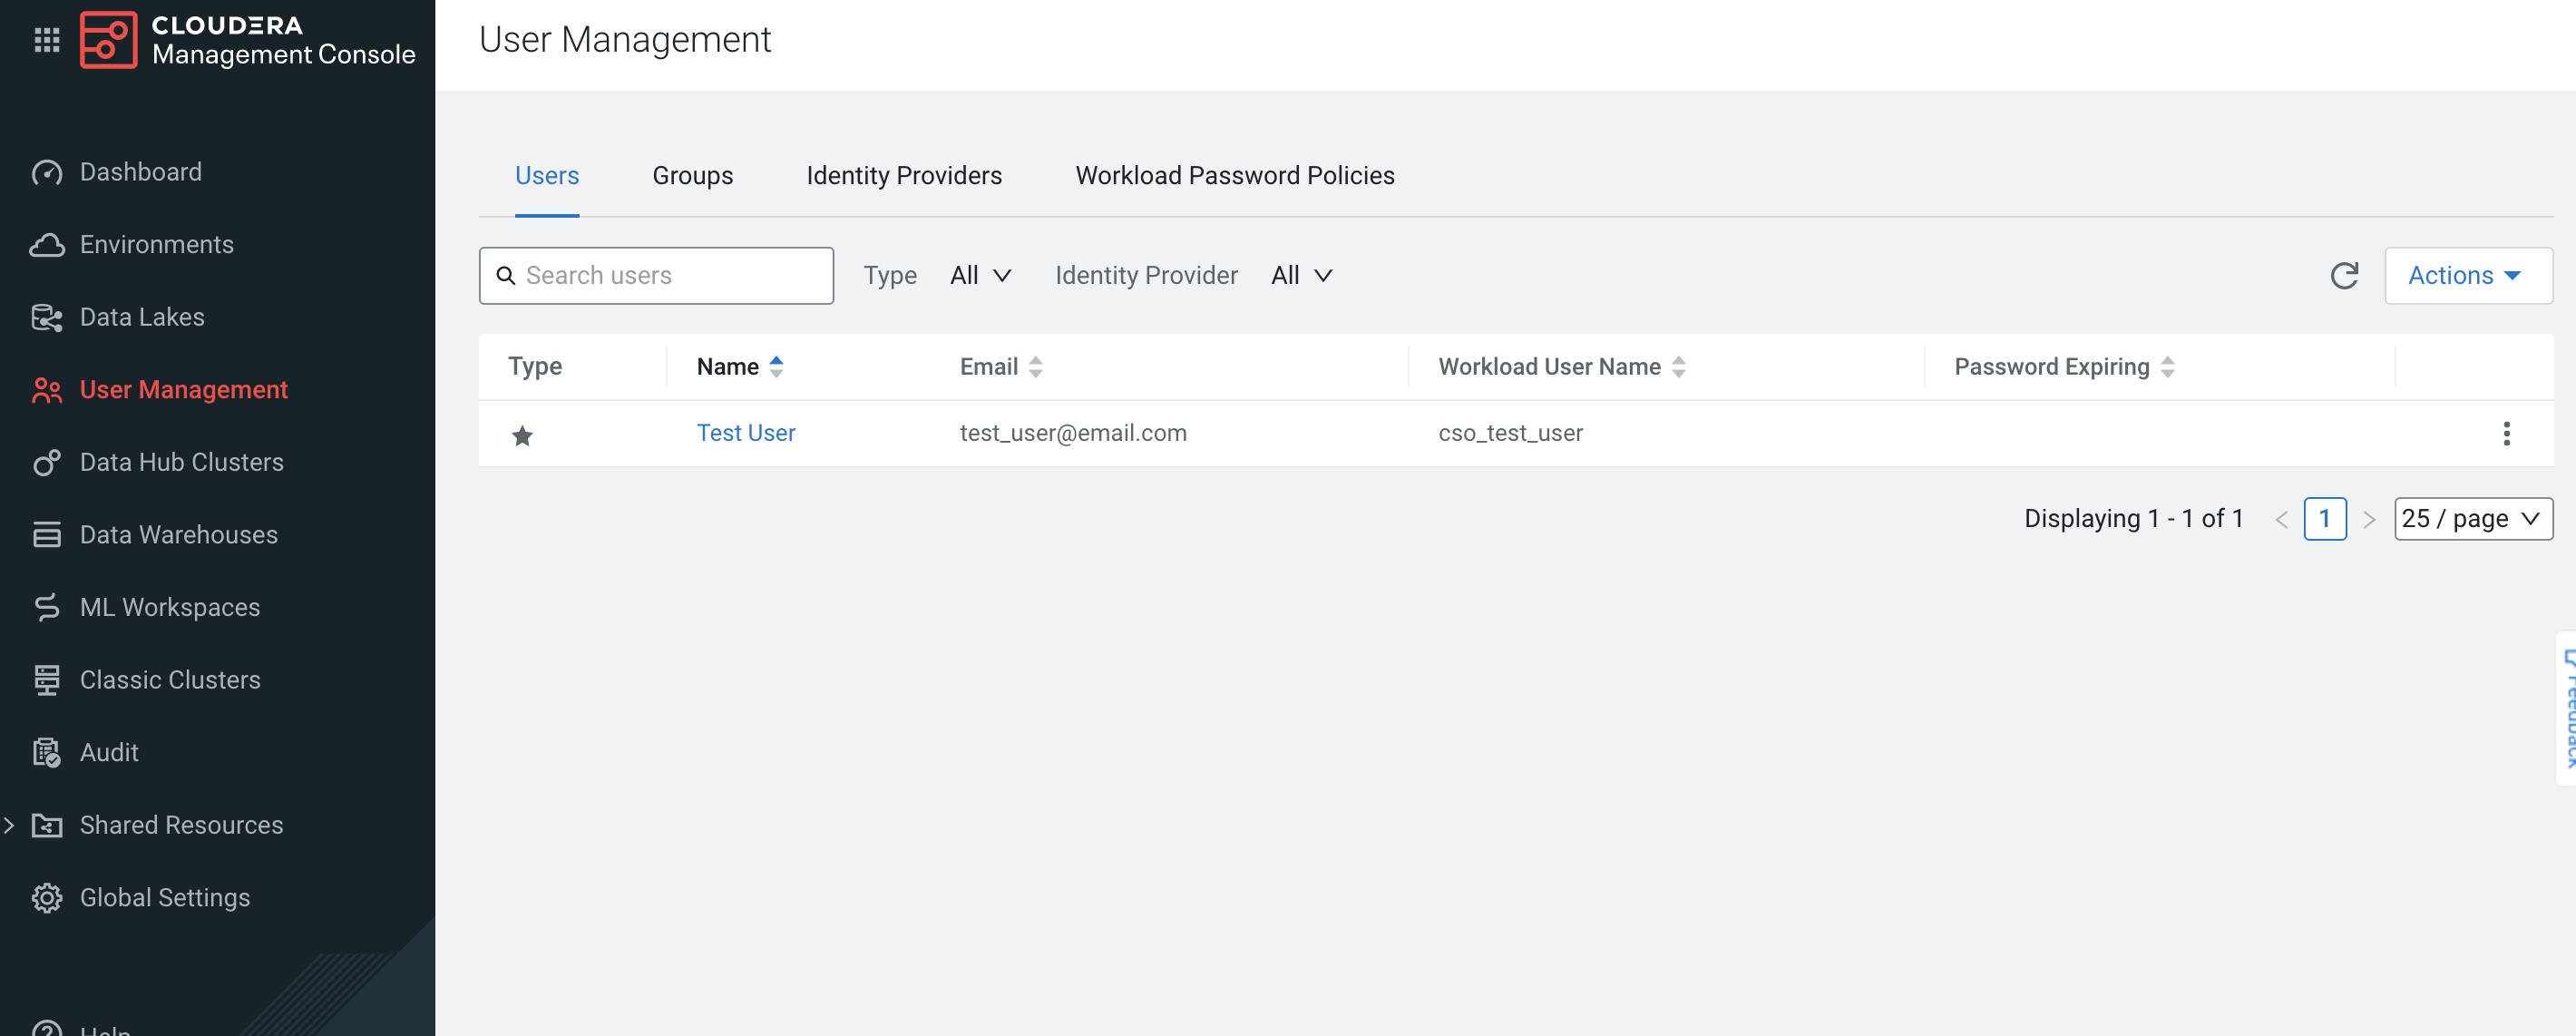
In Cloudera Data Platform, navigate to the Management Console and click on the User Management tab.

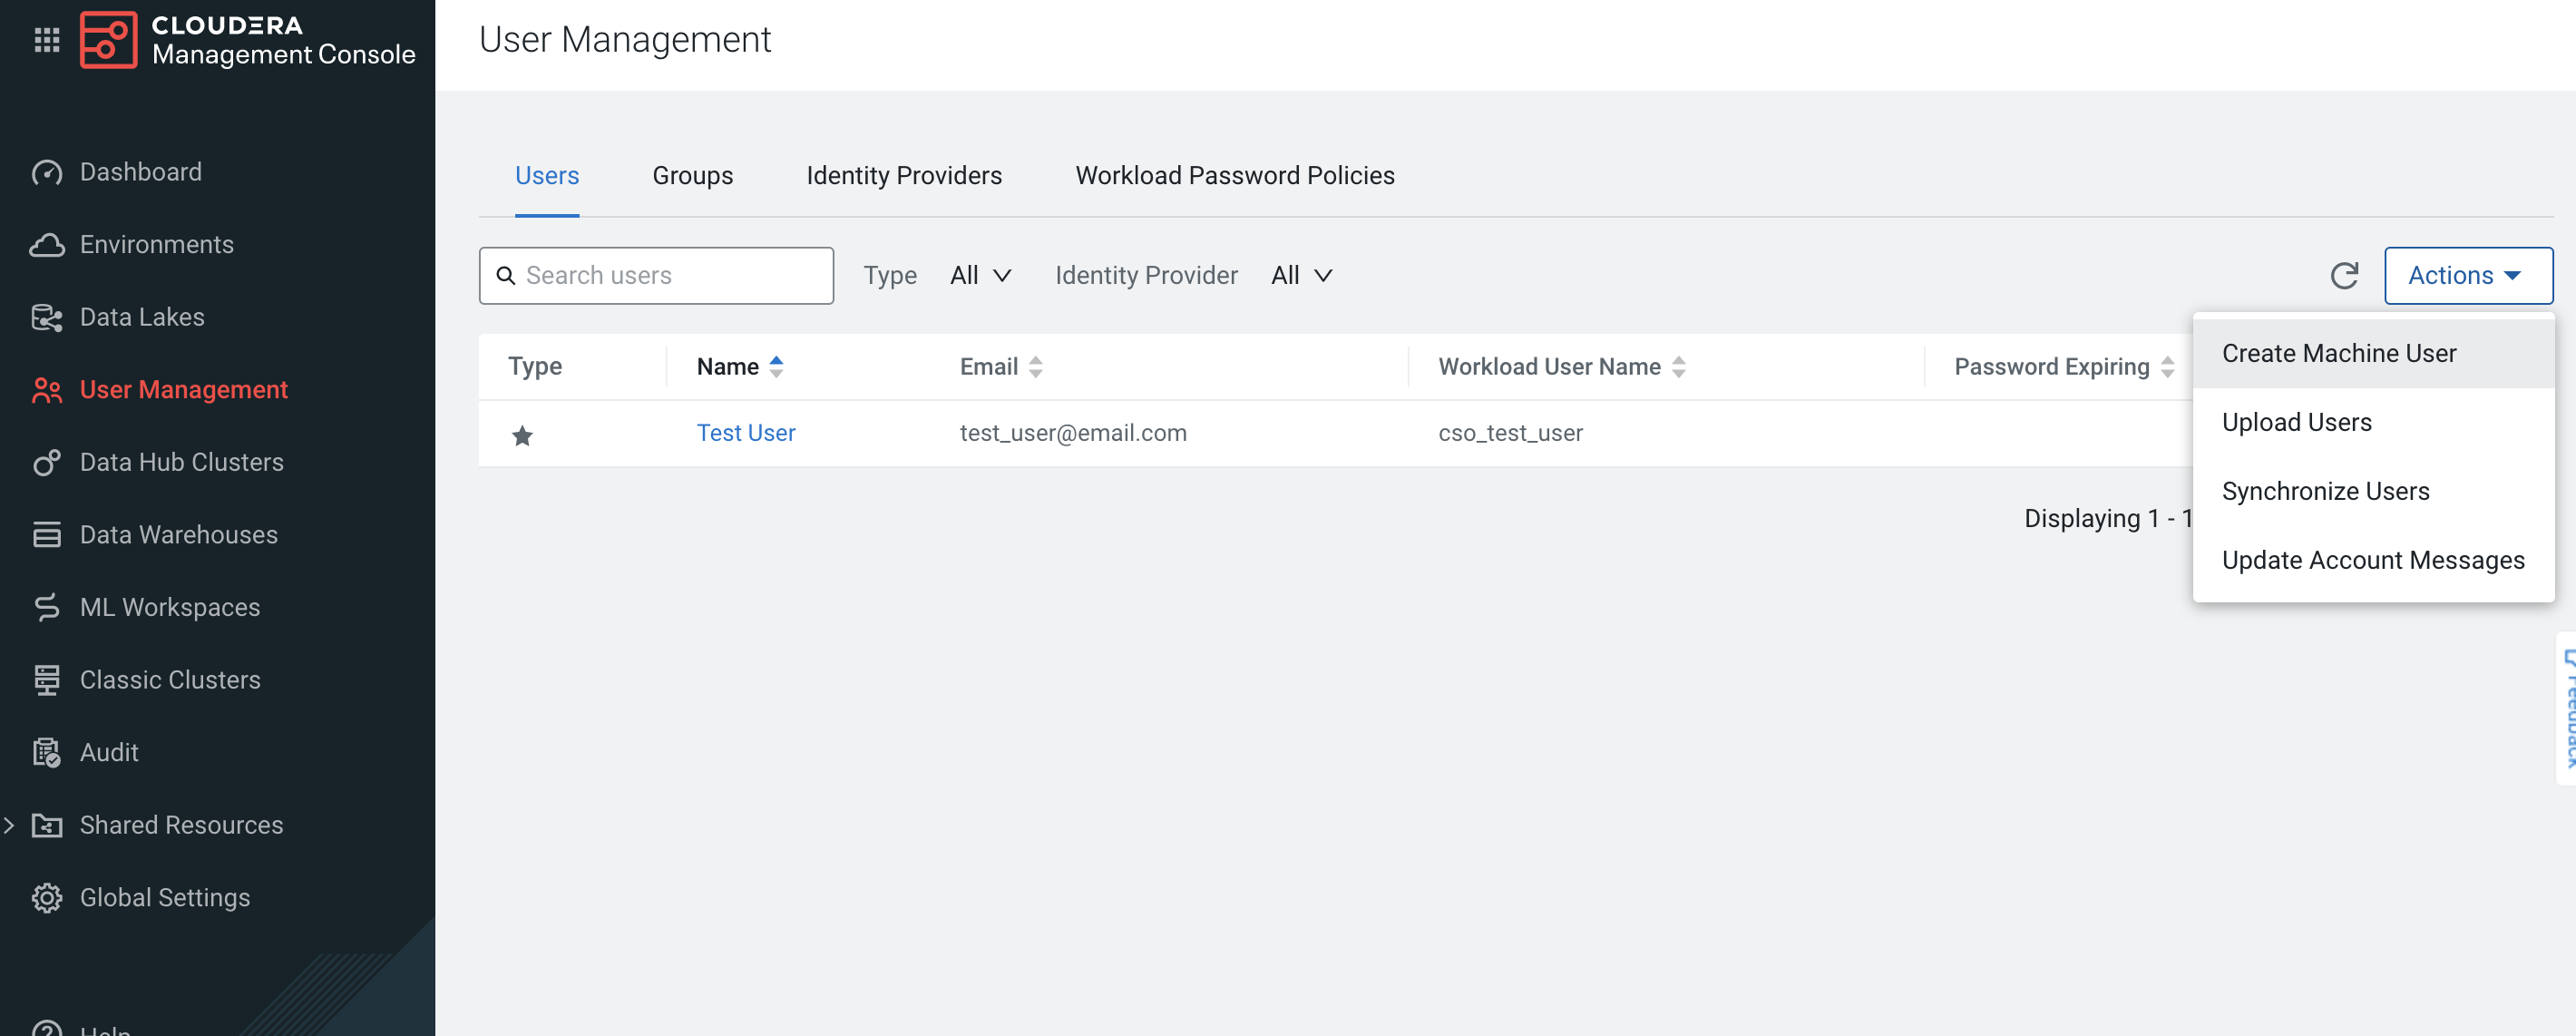
Click on Actions, then Create Machine User to create the machine user that queries the Cloudera Manager through the Datadog Agent.

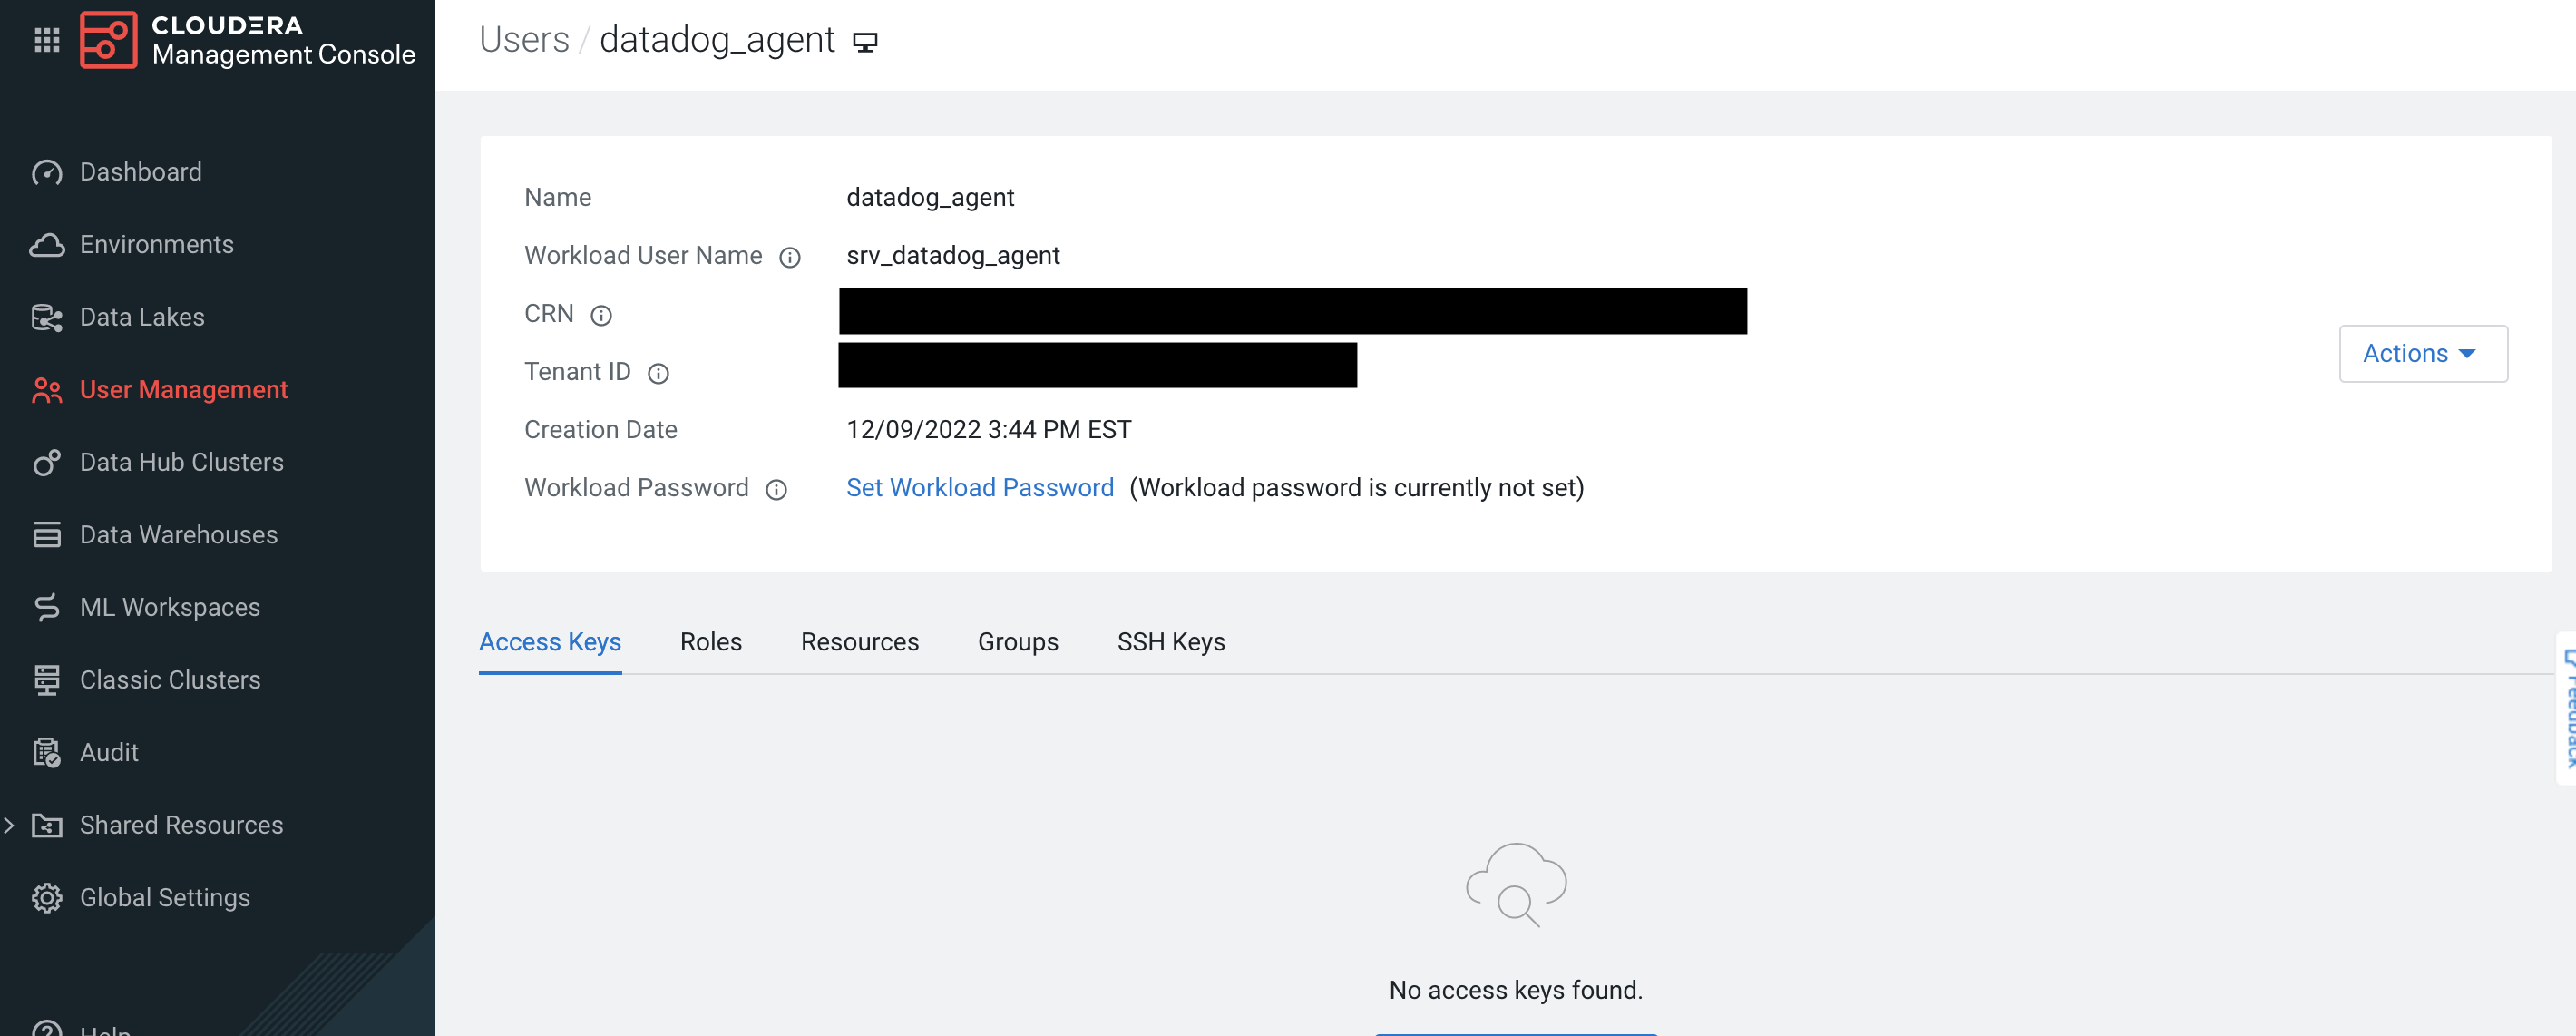
If the workload password hasn’t been set, click on Set Workload Password after the user is created.

Host
Edit the
cloudera.d/conf.yamlfile, in theconf.d/folder at the root of your Agent’s configuration directory to start collecting your Cloudera cluster and host data. See the sample cloudera.d/conf.yaml for all available configuration options.
Note: Theapi_urlshould contain the API version at the end.init_config: ## @param workload_username - string - required ## The Workload username. This value can be found in the `User Management` tab of the Management ## Console in the `Workload User Name`. # workload_username: <WORKLOAD_USERNAME> ## @param workload_password - string - required ## The Workload password. This value can be found in the `User Management` tab of the Management ## Console in the `Workload Password`. # workload_password: <WORKLOAD_PASSWORD> ## Every instance is scheduled independently of the others. # instances: ## @param api_url - string - required ## The URL endpoint for the Cloudera Manager API. This can be found under the Endpoints tab for ## your Data Hub to monitor. ## ## Note: The version of the Cloudera Manager API needs to be appended at the end of the URL. ## For example, using v48 of the API for Data Hub `cluster_1` should result with a URL similar ## to the following: ## `https://cluster1.cloudera.site/cluster_1/cdp-proxy-api/cm-api/v48` # - api_url: <API_URL>Restart the Agent to start collecting and sending Cloudera Data Hub cluster data to Datadog.
Containerized
For containerized environments, see the Autodiscovery Integration Templates for guidance on applying the parameters below.
| Parameter | Value |
|---|---|
<INTEGRATION_NAME> | cloudera |
<INIT_CONFIG> | {"workload_username": "<WORKLOAD_USERNAME>", 'workload_password": "<WORKLOAD_PASSWORD>"} |
<INSTANCE_CONFIG> | {"api_url": <API_URL>"} |
Clusters Discovery
You can configure how your clusters are discovered with the clusters configuration option with the following parameters:
limit: Maximum number of items to be autodiscovered.
Default value:None(all clusters will be processed)include: Mapping of regular expression keys and component config values to autodiscover.
Default value: empty mapexclude: List of regular expressions with the patterns of components to exclude from autodiscovery.
Default value: empty listinterval: Validity time in seconds of the last list of clusters obtained through the endpoint.
Default value:None(no cache used)
Examples:
Process a maximum of 5 clusters with names that start with my_cluster:
clusters:
  limit: 5
  include:
    - 'my_cluster.*'
Process a maximum of 20 clusters and exclude those with names that start with tmp_:
clusters:
  limit: 20
  include:
    - '.*'
  exclude:
    - 'tmp_.*'
Custom Queries
You can configure the Cloudera integration to collect custom metrics that are not be collected by default by running custom timeseries queries. These queries use the tsquery language to retrieve data from Cloudera Manager.
Example:
Collect JVM garbage collection rate and JVM free memory with cloudera_jvm as a custom tag:
custom_queries:
- query: select last(jvm_gc_rate) as jvm_gc_rate, last(jvm_free_memory) as jvm_free_memory
  tags: cloudera_jvm
Note: These queries can take advantage of metric expressions, resulting in queries such as total_cpu_user + total_cpu_system, 1000 * jvm_gc_time_ms / jvm_gc_count, and max(total_cpu_user). When using metric expressions, make sure to also include aliases for the metrics, otherwise the metric names may be incorrectly formatted. For example, SELECT last(jvm_gc_count) results in the metric cloudera.<CATEGORY>.last_jvm_gc_count. You can append an alias like in the following example: SELECT last(jvm_gc_count) as jvm_gc_count to generate the metric cloudera.<CATEGORY>.jvm_gc_count.
Validation
Run the Agent’s status subcommand and look for cloudera under the Checks section.
Data Collected
Metrics
| cloudera.cluster.cpu_percent_across_hosts (gauge) | Percent of the Host CPU Usage metric computed across all this entity's descendant Host entities Shown as percent |
| cloudera.cluster.total_bytes_receive_rate_across_network_interfaces (gauge) | The sum of the Bytes Received metric computed across all this entity's descendant Network Interface entities Shown as byte |
| cloudera.cluster.total_bytes_transmit_rate_across_network_interfaces (gauge) | The sum of the Bytes Transmitted metric computed across all this entity's descendant Network Interface entities Shown as byte |
| cloudera.cluster.total_read_bytes_rate_across_disks (gauge) | The sum of the Disk Bytes Read metric computed across all this entity's descendant Disk entities Shown as byte |
| cloudera.cluster.total_write_bytes_rate_across_disks (gauge) | The sum of the Disk Bytes Written metric computed across all this entity's descendant Disk entities Shown as byte |
| cloudera.disk.await_read_time (gauge) | The average disk await read time of the entity Shown as millisecond |
| cloudera.disk.await_time (gauge) | The average disk await time of the entity Shown as millisecond |
| cloudera.disk.await_write_time (gauge) | The average disk await write time of the entity Shown as millisecond |
| cloudera.disk.service_time (gauge) | The average disk service time of the entity Shown as millisecond |
| cloudera.host.alerts_rate (gauge) | The number of alerts per second Shown as event |
| cloudera.host.cpu_iowait_rate (gauge) | Total CPU iowait time |
| cloudera.host.cpu_irq_rate (gauge) | Total CPU IRQ time |
| cloudera.host.cpu_nice_rate (gauge) | Total CPU nice time |
| cloudera.host.cpu_soft_irq_rate (gauge) | Total CPU soft IRQ time |
| cloudera.host.cpu_steal_rate (gauge) | Stolen time, which is the time spent in other operating systems when running in a virtualized environment |
| cloudera.host.cpu_system_rate (gauge) | Total System CPU |
| cloudera.host.cpu_user_rate (gauge) | Total CPU user time |
| cloudera.host.events_critical_rate (gauge) | The number of critical events |
| cloudera.host.events_important_rate (gauge) | The number of important events |
| cloudera.host.health_bad_rate (gauge) | Percentage of Time with Bad Health |
| cloudera.host.health_concerning_rate (gauge) | Percentage of Time with Concerning Health |
| cloudera.host.health_disabled_rate (gauge) | Percentage of Time with Disabled Health |
| cloudera.host.health_good_rate (gauge) | Percentage of Time with Good Health |
| cloudera.host.health_unknown_rate (gauge) | Percentage of Time with Unknown Health |
| cloudera.host.load_1 (gauge) | Load Average over 1 minute |
| cloudera.host.load_15 (gauge) | Load Average over 15 minutes |
| cloudera.host.load_5 (gauge) | Load Average over 5 minutes |
| cloudera.host.num_cores (gauge) | Total number of cores |
| cloudera.host.num_physical_cores (gauge) | Total number of physical cores |
| cloudera.host.physical_memory_buffers (gauge) | The amount of physical memory devoted to temporary storage for raw disk blocks Shown as byte |
| cloudera.host.physical_memory_cached (gauge) | The amount of physical memory used for files read from the disk. This is commonly referred to as the pagecache Shown as byte |
| cloudera.host.physical_memory_total (gauge) | The total physical memory available Shown as byte |
| cloudera.host.physical_memory_used (gauge) | The total amount of memory being used, excluding buffers and cache Shown as byte |
| cloudera.host.swap_out_rate (gauge) | Memory swapped out to disk Shown as page |
| cloudera.host.swap_used (gauge) | Swap used Shown as byte |
| cloudera.host.total_bytes_receive_rate_across_network_interfaces (gauge) | The sum of the Bytes Received metric computed across all this entity's descendant Network Interface entities Shown as byte |
| cloudera.host.total_bytes_transmit_rate_across_network_interfaces (gauge) | The sum of the Bytes Transmitted metric computed across all this entity's descendant Network Interface entities Shown as byte |
| cloudera.host.total_phys_mem_bytes (gauge) | Total physical memory in bytes Shown as byte |
| cloudera.host.total_read_bytes_rate_across_disks (gauge) | The sum of the Disk Bytes Read metric computed across all this entity's descendant Disk entities Shown as byte |
| cloudera.host.total_read_ios_rate_across_disks (gauge) | The sum of the Disk Reads metric computed across all this entity's descendant Disk entities Shown as operation |
| cloudera.host.total_write_bytes_rate_across_disks (gauge) | The sum of the Disk Bytes Written metric computed across all this entity's descendant Disk entities Shown as byte |
| cloudera.host.total_write_ios_rate_across_disks (gauge) | The sum of the Disk Writes metric computed across all this entity's descendant Disk entities Shown as operation |
| cloudera.role.cpu_system_rate (gauge) | Total System CPU |
| cloudera.role.cpu_user_rate (gauge) | Total CPU user time |
| cloudera.role.mem_rss (gauge) | Resident memory used Shown as byte |
Events
The Cloudera integration collects events that are emitted from the /events endpoint from the Cloudera Manager API. The event levels are mapped as the following:
| Cloudera | Datadog |
|---|---|
UNKNOWN | error |
INFORMATIONAL | info |
IMPORTANT | info |
CRITICAL | error |
Service Checks
cloudera.can_connect
Returns OK if the check is able to connect to the Cloudera Manager API and collect metrics, CRITICAL otherwise.
Statuses: ok, critical
cloudera.cluster.health
Returns OK if the cluster is in good health or is starting, WARNING if the cluster is stopping or the health is concerning, CRITICAL if the cluster is down or in bad health, and UNKNOWN otherwise.
Statuses: ok, critical, warning, unknown
cloudera.host.health
Returns OK if the host is in good health or is starting, WARNING if the host is stopping or the health is concerning, CRITICAL if the host is down or in bad health, and UNKNOWN otherwise.
Statuses: ok, critical, warning, unknown
Troubleshooting
Collecting metrics of Datadog integrations on Cloudera hosts
To install the Datadog Agent on a Cloudera host, make sure that the security group associated with the host allows SSH access.
Then, you need to use the root user cloudbreak when accessing the host with the SSH key generated during the environment creation:
sudo ssh -i "/path/to/key.pem" cloudbreak@<HOST_IP_ADDRESS>
The workload username and password can be used to access Cloudera hosts through SSH, although only the cloudbreak user can install the Datadog Agent.
Trying to use any user that is not cloudbreak may result in the following error:
<NON_CLOUDBREAK_USER> is not allowed to run sudo on <CLOUDERA_HOSTNAME>. This incident will be reported.
Config errors when collecting Datadog metrics
If you see something similar to the following in the Agent status when collecting metrics from your Cloudera host:
  Config Errors
  ==============
    zk
    --
      open /etc/datadog-agent/conf.d/zk.d/conf.yaml: permission denied
You need to change the ownership of the conf.yaml to dd-agent:
[cloudbreak@<CLOUDERA_HOSTNAME> ~]$ sudo chown -R dd-agent:dd-agent /etc/datadog-agent/conf.d/zk.d/conf.yaml
Need help? Contact Datadog support.
Further Reading
Additional helpful documentation, links, and articles:
