- Essentials
- Getting Started
- Datadog
- Datadog Site
- DevSecOps
- Serverless for AWS Lambda
- Agent
- Integrations
- Containers
- Dashboards
- Monitors
- Logs
- APM Tracing
- Profiler
- Tags
- API
- Service Catalog
- Session Replay
- Continuous Testing
- Synthetic Monitoring
- Incident Management
- Database Monitoring
- Cloud Security Management
- Cloud SIEM
- Application Security Management
- Workflow Automation
- CI Visibility
- Test Visibility
- Intelligent Test Runner
- Code Analysis
- Learning Center
- Support
- Glossary
- Standard Attributes
- Guides
- Agent
- Integrations
- OpenTelemetry
- Developers
- Authorization
- DogStatsD
- Custom Checks
- Integrations
- Create an Agent-based Integration
- Create an API Integration
- Create a Log Pipeline
- Integration Assets Reference
- Build a Marketplace Offering
- Create a Tile
- Create an Integration Dashboard
- Create a Recommended Monitor
- Create a Cloud SIEM Detection Rule
- OAuth for Integrations
- Install Agent Integration Developer Tool
- Service Checks
- IDE Plugins
- Community
- Guides
- API
- Datadog Mobile App
- CoScreen
- Cloudcraft
- In The App
- Dashboards
- Notebooks
- DDSQL Editor
- Sheets
- Monitors and Alerting
- Infrastructure
- Metrics
- Watchdog
- Bits AI
- Service Catalog
- API Catalog
- Error Tracking
- Service Management
- Infrastructure
- Application Performance
- APM
- Continuous Profiler
- Database Monitoring
- Data Streams Monitoring
- Data Jobs Monitoring
- Digital Experience
- Real User Monitoring
- Product Analytics
- Synthetic Testing and Monitoring
- Continuous Testing
- Software Delivery
- CI Visibility
- CD Visibility
- Test Visibility
- Intelligent Test Runner
- Code Analysis
- Quality Gates
- DORA Metrics
- Security
- Security Overview
- Cloud SIEM
- Cloud Security Management
- Application Security Management
- AI Observability
- Log Management
- Observability Pipelines
- Log Management
- Administration
PlanetScale
Overview
PlanetScale can push metrics into Datadog to assist your team with understanding database usage and performance.
Setup
Follow the steps below to configure your PlanetScale organization to push metrics into Datadog.
- Create a Datadog API key in your Datadog Organization Settings.
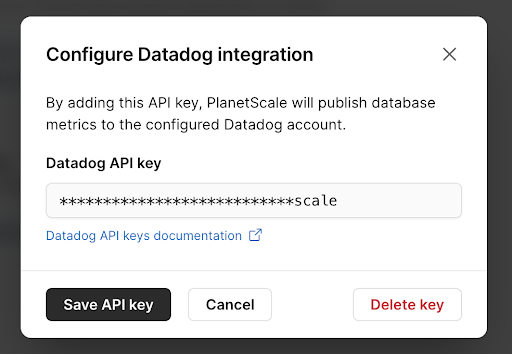
- Supply PlanetScale with the Datadog API key in your PlanetScale Organization Settings.

Data Collected
Metrics
| planetscale.connections (gauge) | Number of active connections to a database branch Shown as connection |
| planetscale.rows_read (count) | Number of rows read from a database branch Shown as row |
| planetscale.rows_written (count) | Number of rows written to a database branch Shown as row |
| planetscale.tables.cumulative_query_time (count) | Cumulative active query time in a database branch by table and statement Shown as nanosecond |
| planetscale.tables.queries (count) | Number of queries issued to a database branch by table and statement Shown as query |
| planetscale.tables.rows_deleted (count) | Number of rows deleted from a database branch by table Shown as row |
| planetscale.tables.rows_inserted (count) | Number of rows inserted into a database branch by table Shown as row |
| planetscale.tables.rows_selected (count) | Number of rows selected in a database branch by table Shown as row |
| planetscale.tables.rows_updated (count) | Number of rows updated in a database branch by table Shown as row |
| planetscale.tables.storage (gauge) | Total bytes stored in a database branch by table Shown as byte |
Service Checks
Planetscale does not include any service checks.
Events
Planetscale does not include any events.
Support
Need help? Contact Datadog support.
