- Essentials
- Getting Started
- Datadog
- Datadog Site
- DevSecOps
- Serverless for AWS Lambda
- Agent
- Integrations
- Containers
- Dashboards
- Monitors
- Logs
- APM Tracing
- Profiler
- Tags
- API
- Service Catalog
- Session Replay
- Continuous Testing
- Synthetic Monitoring
- Incident Management
- Database Monitoring
- Cloud Security Management
- Cloud SIEM
- Application Security Management
- Workflow Automation
- CI Visibility
- Test Visibility
- Intelligent Test Runner
- Code Analysis
- Learning Center
- Support
- Glossary
- Standard Attributes
- Guides
- Agent
- Integrations
- OpenTelemetry
- Developers
- Authorization
- DogStatsD
- Custom Checks
- Integrations
- Create an Agent-based Integration
- Create an API Integration
- Create a Log Pipeline
- Integration Assets Reference
- Build a Marketplace Offering
- Create a Tile
- Create an Integration Dashboard
- Create a Recommended Monitor
- Create a Cloud SIEM Detection Rule
- OAuth for Integrations
- Install Agent Integration Developer Tool
- Service Checks
- IDE Plugins
- Community
- Guides
- API
- Datadog Mobile App
- CoScreen
- Cloudcraft
- In The App
- Dashboards
- Notebooks
- DDSQL Editor
- Sheets
- Monitors and Alerting
- Infrastructure
- Metrics
- Watchdog
- Bits AI
- Service Catalog
- API Catalog
- Error Tracking
- Service Management
- Infrastructure
- Application Performance
- APM
- Continuous Profiler
- Database Monitoring
- Data Streams Monitoring
- Data Jobs Monitoring
- Digital Experience
- Real User Monitoring
- Product Analytics
- Synthetic Testing and Monitoring
- Continuous Testing
- Software Delivery
- CI Visibility
- CD Visibility
- Test Visibility
- Intelligent Test Runner
- Code Analysis
- Quality Gates
- DORA Metrics
- Security
- Security Overview
- Cloud SIEM
- Cloud Security Management
- Application Security Management
- AI Observability
- Log Management
- Observability Pipelines
- Log Management
- Administration
Postman
Supported OS
Overview
Postman is an API platform that simplifies the steps of building an API and streamlines collaboration so you can create better APIs-faster.
This integration helps you stay on top of your monitors’ health. It enables you to:
Analyze the metrics of Postman Monitoring runs in Datadog
Generate events for successful and failed monitoring runs.
Setup
You can find detailed instructions in Postman’s documentation. Postman Integrations require a Postman Team, Business, or Enterprise plan.
Configuration
- Generate a Datadog API key.
- Sign in to your Postman account and navigate to the Datadog integration.
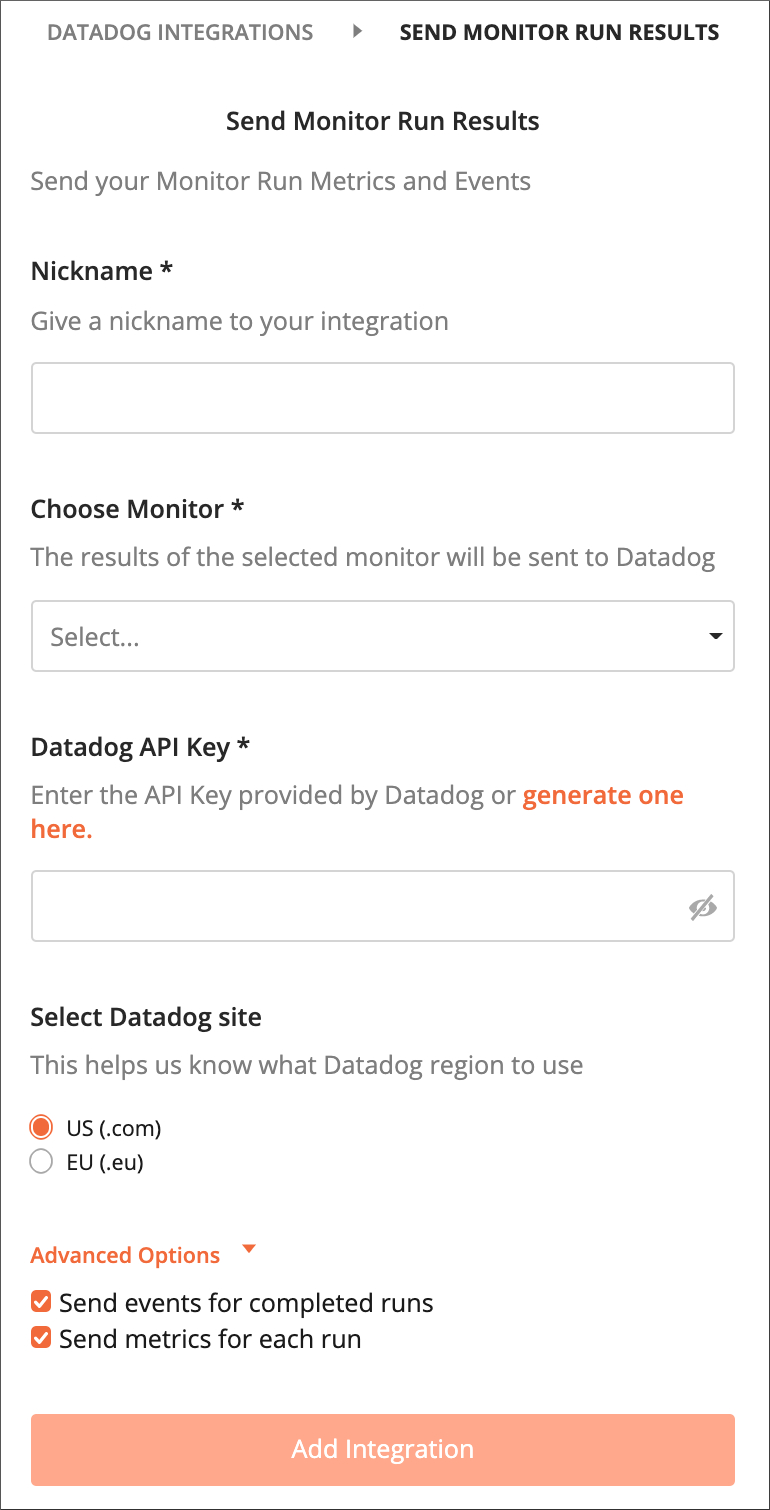
- Select “Add Integration.”
- To send your monitor metrics and events to Datadog:
- Name your new integration.
- Select the monitor whose data you would like to send to Datadog.
- Enter your Datadog API key.
- Select the Datadog region you would like to use.
- Optionally choose if you want to send events, metrics or both for each run.
- Then select “Add Integration” to finish setting up the integration.

Data Collected
Metrics
| postman.monitor.run.errors (gauge) | The total number of errors across all requests in a monitoring run |
| postman.monitor.run.failed_tests (gauge) | The total number of failed tests across all requests in a monitoring run |
| postman.monitor.run.passed_tests (gauge) | Total number of passed tests across all requests in a monitoring run |
| postman.monitor.run.request_count (gauge) | Total number of requests in a monitoring run |
| postman.monitor.run.total_latency (gauge) | The total latency time for all requests in a monitoring run |
| postman.monitor.request.bytes (gauge) | Total bytes sent and received for each request in a monitoring run |
| postman.monitor.request.failed_tests (gauge) | Number of failed tests for each request in a monitoring run |
| postman.monitor.request.passed_tests (gauge) | Number of passed tests for each request in a monitoring run |
| postman.monitor.request.latency (gauge) | The latency for each request in a monitoring run |
| postman.monitor.run.http_status_2xx (gauge) | Total number of requests in a monitoring run that return an HTTP status code in the 200 range |
| postman.monitor.run.http_status_4xx (gauge) | Total number of requests in a monitoring run that return an HTTP status code in the 400 range |
| postman.monitor.run.http_status_5xx (gauge) | Total number of requests in a monitoring run that return an HTTP status code in the 500 range |
Service Checks
Postman does not include any service checks.
Events
An event is generated each time a monitor runs in Postman. The severity of the event is based on the tests in the Postman monitor:
| Severity | Description |
|---|---|
Low | If all the tests pass |
Normal | If some tests fail, or an error occurs in the execution of any event. |
Troubleshooting
Need help? Contact Postman Support.
