- Essentials
- Getting Started
- Datadog
- Datadog Site
- DevSecOps
- Serverless for AWS Lambda
- Agent
- Integrations
- Containers
- Dashboards
- Monitors
- Logs
- APM Tracing
- Profiler
- Tags
- API
- Service Catalog
- Session Replay
- Continuous Testing
- Synthetic Monitoring
- Incident Management
- Database Monitoring
- Cloud Security Management
- Cloud SIEM
- Application Security Management
- Workflow Automation
- CI Visibility
- Test Visibility
- Test Impact Analysis
- Code Analysis
- Learning Center
- Support
- Glossary
- Standard Attributes
- Guides
- Agent
- Integrations
- OpenTelemetry
- Developers
- Authorization
- DogStatsD
- Custom Checks
- Integrations
- Create an Agent-based Integration
- Create an API Integration
- Create a Log Pipeline
- Integration Assets Reference
- Build a Marketplace Offering
- Create a Tile
- Create an Integration Dashboard
- Create a Recommended Monitor
- Create a Cloud SIEM Detection Rule
- OAuth for Integrations
- Install Agent Integration Developer Tool
- Service Checks
- IDE Plugins
- Community
- Guides
- Administrator's Guide
- API
- Datadog Mobile App
- CoScreen
- Cloudcraft
- In The App
- Dashboards
- Notebooks
- DDSQL Editor
- Sheets
- Monitors and Alerting
- Infrastructure
- Metrics
- Watchdog
- Bits AI
- Service Catalog
- API Catalog
- Error Tracking
- Service Management
- Infrastructure
- Application Performance
- APM
- Continuous Profiler
- Database Monitoring
- Data Streams Monitoring
- Data Jobs Monitoring
- Digital Experience
- Real User Monitoring
- Product Analytics
- Synthetic Testing and Monitoring
- Continuous Testing
- Software Delivery
- CI Visibility
- CD Visibility
- Test Optimization
- Code Analysis
- Quality Gates
- DORA Metrics
- Security
- Security Overview
- Cloud SIEM
- Cloud Security Management
- Application Security Management
- AI Observability
- Log Management
- Observability Pipelines
- Log Management
- Administration
Create an Integration-Recommended Monitor
Overview
Datadog Monitors track key metrics, so you can efficiently monitor your infrastructure and integrations. Datadog provides a set of out-of-the-box monitors for many features and integrations. View these monitors in your Monitors Template list.
Create an out-of-the-box monitor to help users find value in your Datadog integration. This guide provides steps for creating an integration-recommended monitor and best practices to follow during the creation process.
To create a Datadog integration, see Create a New Integration.
Steps to create a recommended monitor
Build a monitor JSON Schema
Follow the best practices listed in this guide to configure your monitor.
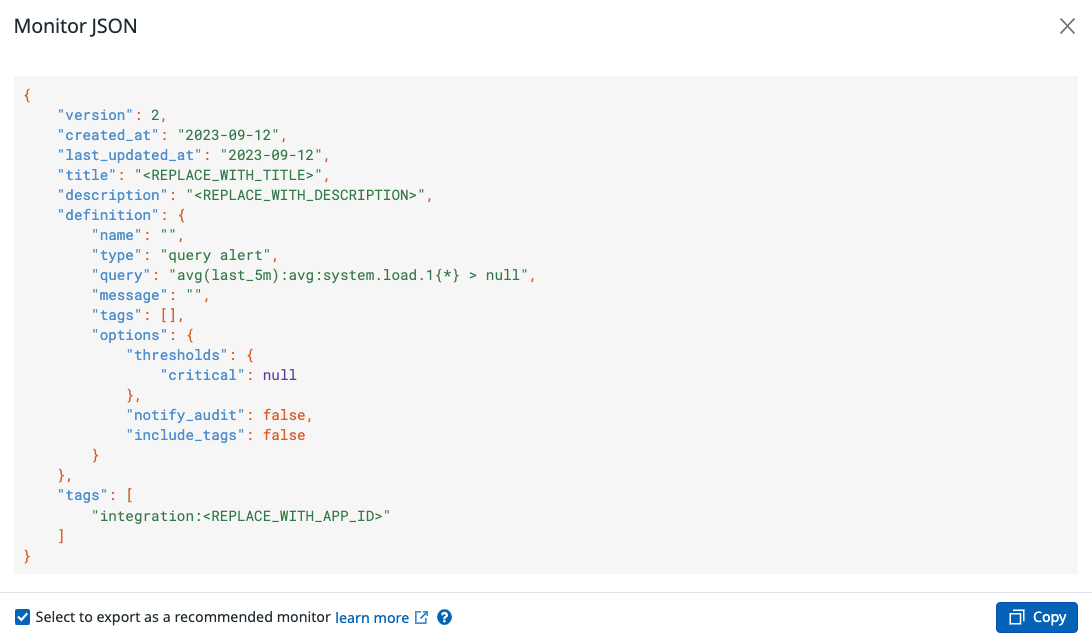
Click Export Monitor.
Check Select to export as a recommended monitor.
Click Copy to use the JSON schema of your configured monitor.
Save the copied schema to a JSON file and name it according to your monitor title. For example,
your_integration_name_alert.json.In the monitor JSON file, fill out the Title, Description, and Tags. For more information, see Configuration best practices.
Open a pull request
Save the monitor JSON file to your integration’s
assets/monitorsfolder. Add the asset to yourmanifest.jsonfile. See Integrations Assets Reference for more information about your integration’s file structure and manifest file.Open a pull request (PR) to add your recommended monitor JSON file and updated manifest file to the corresponding integration folder either in the
integrations-extrasGitHub repository orMarketplaceGitHub repository.After it’s approved, Datadog merges the PR and your integration-recommended monitor is pushed to production.
Verify your monitor in production
To see the out-of-the-box monitor, the relevant integration tile must be Installed in Datadog.
Find your monitor in the Monitors Template list. Ensure logos render correctly on the Monitors Template lists page.
Configuration best practices
In addition to the monitor definition, the Title, Description, and Tags fields are required for recommended monitors. Set tags to “integration:<app_id>”, see other available monitor tags here. For more information, see the documentation on configuring a monitor.
Title
The title allows users to quickly understand the underlying failure mode the alert is covering.
- Use the active voice and start with an object followed by a verb.
- Do not use template variables.
| Needs revision | Better | Best |
|---|---|---|
| High Unacknowledged Messages reported on {{host.name}} | High Unacknowledged Messages reported | Unacknowledged Messages are higher than usual |
Description
Provides extra context around the failure mode and also about the impact this mode can have on the system. It should allow users to understand at a glance whether it is relevant or not for them to create a monitor out of it.
- This is not a copy of the title.
- Define the problem stated by the title.
- Answer why this is an issue worth alerting on.
- Describe the impact of the problem.
| Needs revision | Better | Best |
|---|---|---|
| Notify your team when unacked message are high. | Unacked messages are those that have been delivered to a consumer but have not been acknowledged as processed or handled. This monitor tracks the ratio of unacked messages. | Unacked messages are those that have been delivered to a consumer but have not been acknowledged as processed or handled. This monitor tracks the ratio of unacked messages to avoid potential bottlenecks which could lead to delays in message processing. |
Further Reading
Additional helpful documentation, links, and articles:

