- Essentials
- Getting Started
- Datadog
- Datadog Site
- DevSecOps
- Serverless for AWS Lambda
- Agent
- Integrations
- Containers
- Dashboards
- Monitors
- Logs
- APM Tracing
- Profiler
- Tags
- API
- Service Catalog
- Session Replay
- Continuous Testing
- Synthetic Monitoring
- Incident Management
- Database Monitoring
- Cloud Security Management
- Cloud SIEM
- Application Security Management
- Workflow Automation
- CI Visibility
- Test Visibility
- Test Impact Analysis
- Code Analysis
- Learning Center
- Support
- Glossary
- Standard Attributes
- Guides
- Agent
- Integrations
- OpenTelemetry
- Developers
- Authorization
- DogStatsD
- Custom Checks
- Integrations
- Create an Agent-based Integration
- Create an API Integration
- Create a Log Pipeline
- Integration Assets Reference
- Build a Marketplace Offering
- Create a Tile
- Create an Integration Dashboard
- Create a Recommended Monitor
- Create a Cloud SIEM Detection Rule
- OAuth for Integrations
- Install Agent Integration Developer Tool
- Service Checks
- IDE Plugins
- Community
- Guides
- Administrator's Guide
- API
- Datadog Mobile App
- CoScreen
- Cloudcraft
- In The App
- Dashboards
- Notebooks
- DDSQL Editor
- Sheets
- Monitors and Alerting
- Infrastructure
- Metrics
- Watchdog
- Bits AI
- Service Catalog
- API Catalog
- Error Tracking
- Service Management
- Infrastructure
- Application Performance
- APM
- Continuous Profiler
- Database Monitoring
- Data Streams Monitoring
- Data Jobs Monitoring
- Digital Experience
- Real User Monitoring
- Product Analytics
- Synthetic Testing and Monitoring
- Continuous Testing
- Software Delivery
- CI Visibility
- CD Visibility
- Test Optimization
- Code Analysis
- Quality Gates
- DORA Metrics
- Security
- Security Overview
- Cloud SIEM
- Cloud Security Management
- Application Security Management
- AI Observability
- Log Management
- Observability Pipelines
- Log Management
- Administration
OceanBase Cloud
Supported OS


Overview of the OceanBase Cloud Datadog dashboard
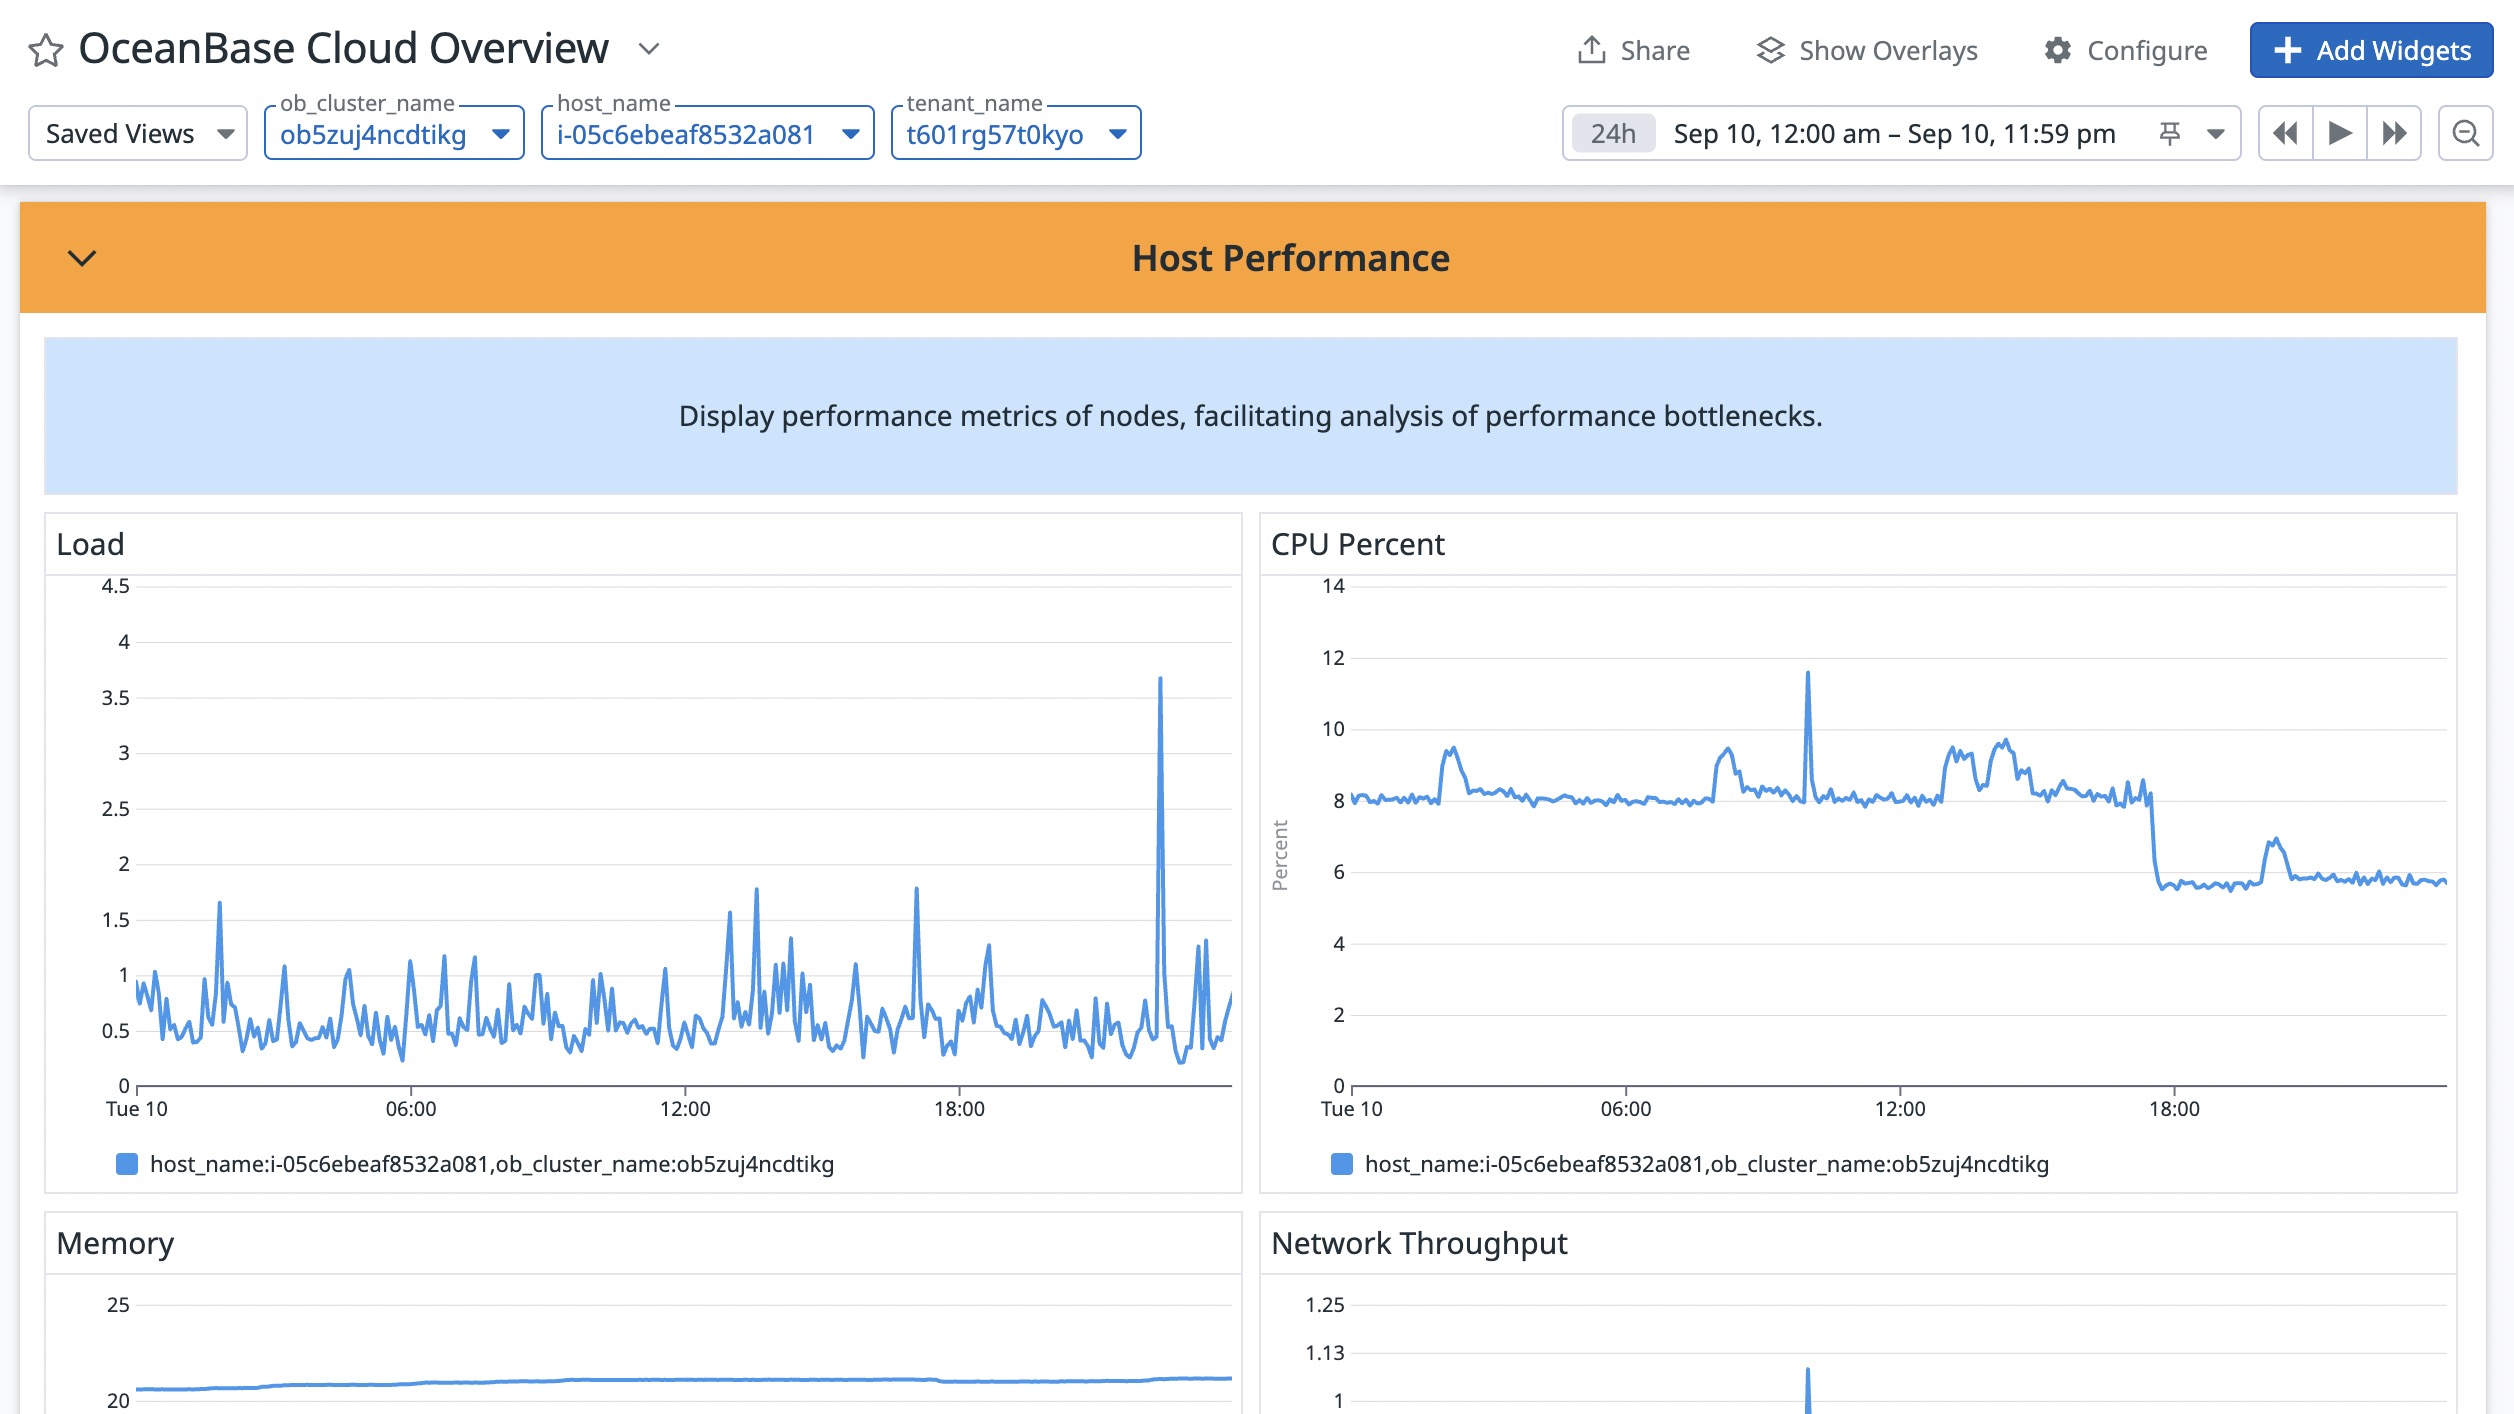
Host performance metrics from the OceanBase Cloud Datadog dashboard
SQL performance metrics from the OceanBase Cloud Datadog dashboard
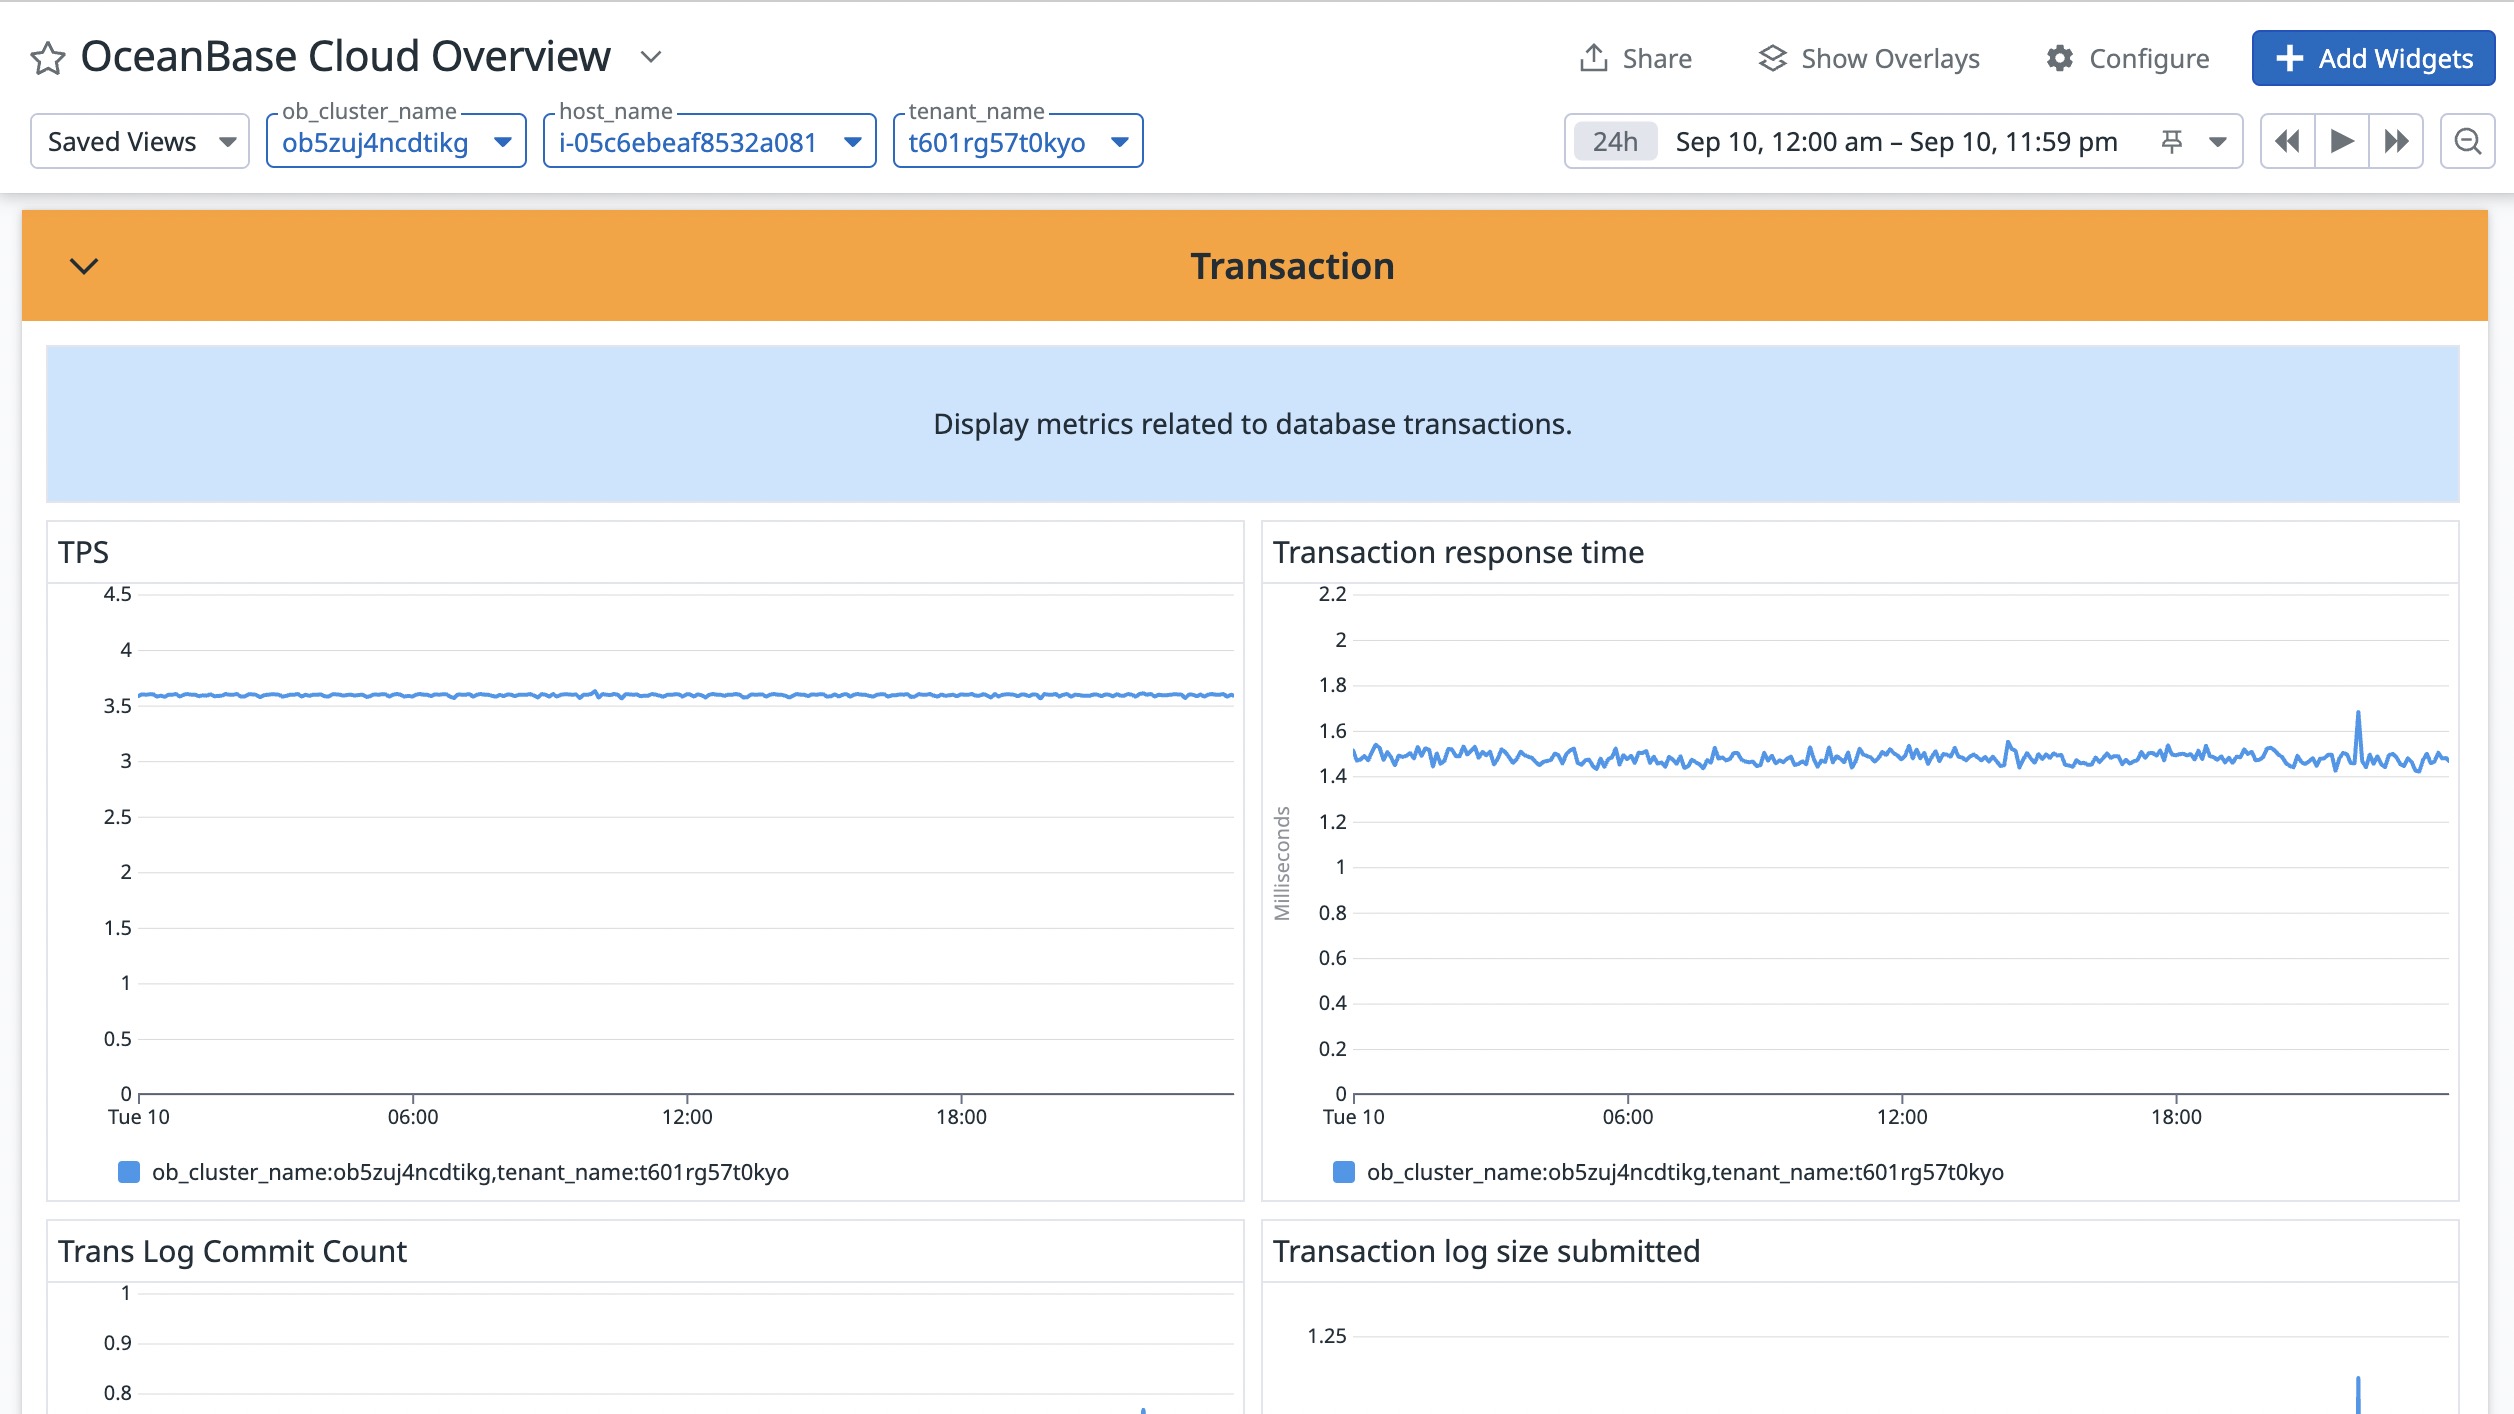
Transaction metrics from the OceanBase Cloud Datadog dashboard
Overview
OceanBase Database is a distributed relational database. OceanBase Database adopts an independently developed integrated architecture, which encompasses both the scalability of a distributed architecture and the performance advantage of a centralized architecture.
OceanBase Cloud provides fully managed database services with elastic scalability, ultra-fast performance, and high compatibility on global cloud infrastructure.
With the Oceanbase Cloud integration, users can collect various monitoring data for database clusters created on OceanBase Cloud in Datadog, including operating status, cluster performance, and cluster health.
Setup
To set up the OceanBase Cloud Datadog integration for your cluster, please refer to the following steps
- Log in to the Datadog console.
a. Choose the right site from Datadog sites.
b. Log in using your Dotadog credentials. - Log in to the OceanBase Cloud console using your OceanBase Cloud credentials, navigate to the Integrations page, and search for the Datadog integration.
- Click Connect. You will be redirected to the Datadog authorization page. If you have not logged in to Datadog before this step, you will need to select the appropriate site and log in on the opened authorization page.
- Click Authorize. You will then be redirected back to the OceanBase Cloud console. A notification will appear if the authorization is successful. Contact OceanBase Cloud technical support if an error occurs.
- Search for OceanBase in the Datadog console, and click Install. The monitoring data for your OceanBase Cloud instance will appear in a few minutes on the Datadog Dashboards page.
Uninstallation
- Log in to the OceanBase Cloud console, go to OceanBase Cloud Integrations, and search the Datadog product.
- Click remove button, a notification will be displayed if successful.
Once this integration has been uninstalled, any previous authorizations are revoked. Additionally, ensure that all API keys associated with this integration have been disabled by searching for the integration name on the API Keys page.
Data Collected
Metrics
| oceanbase_cloud.load1 (gauge) | Average load over the past one minute |
| oceanbase_cloud.cpu_percent (gauge) | CPU Percent Shown as percent |
| oceanbase_cloud.memory_used (gauge) | Used physical memory percent Shown as percent |
| oceanbase_cloud.net_throughput (gauge) | Network throughput Shown as mebibyte |
| oceanbase_cloud.ob_data_disk_percent (gauge) | OB Data Disk Usage Shown as percent |
| oceanbase_cloud.ob_clog_disk_percent (gauge) | OB Clog Disk Usage Shown as percent |
| oceanbase_cloud.ob_process_exists (gauge) | OB process existence status |
| oceanbase_cloud.sql_all_count (gauge) | Number of SQL statements processed per second Shown as execution |
| oceanbase_cloud.sql_all_rt (gauge) | The average processing time of each SQL statement Shown as millisecond |
| oceanbase_cloud.all_session (gauge) | Number of current sessions |
| oceanbase_cloud.request_queue_time (gauge) | Time spent waiting in the request queue Shown as microsecond |
| oceanbase_cloud.transaction_count (gauge) | Transactions per second Shown as transaction |
| oceanbase_cloud.transaction_rt (gauge) | Transaction response time Shown as millisecond |
| oceanbase_cloud.trans_commit_log_count (gauge) | Number of transaction logs submitted per second |
| oceanbase_cloud.clog_trans_log_total_size (gauge) | Transaction log size submitted per second Shown as byte |
Service Checks
The OceanBase Cloud integration does not include any service checks.
Events
The OceanBase Cloud integration does not include any events.
Troubleshooting
Need help? Contact OceanBase support.
