- Essentials
- Getting Started
- Datadog
- Datadog Site
- DevSecOps
- Serverless for AWS Lambda
- Agent
- Integrations
- Containers
- Dashboards
- Monitors
- Logs
- APM Tracing
- Profiler
- Tags
- API
- Service Catalog
- Session Replay
- Continuous Testing
- Synthetic Monitoring
- Incident Management
- Database Monitoring
- Cloud Security Management
- Cloud SIEM
- Application Security Management
- Workflow Automation
- CI Visibility
- Test Visibility
- Test Impact Analysis
- Code Analysis
- Learning Center
- Support
- Glossary
- Standard Attributes
- Guides
- Agent
- Integrations
- OpenTelemetry
- Developers
- Authorization
- DogStatsD
- Custom Checks
- Integrations
- Create an Agent-based Integration
- Create an API Integration
- Create a Log Pipeline
- Integration Assets Reference
- Build a Marketplace Offering
- Create a Tile
- Create an Integration Dashboard
- Create a Recommended Monitor
- Create a Cloud SIEM Detection Rule
- OAuth for Integrations
- Install Agent Integration Developer Tool
- Service Checks
- IDE Plugins
- Community
- Guides
- Administrator's Guide
- API
- Datadog Mobile App
- CoScreen
- Cloudcraft
- In The App
- Dashboards
- Notebooks
- DDSQL Editor
- Sheets
- Monitors and Alerting
- Infrastructure
- Metrics
- Watchdog
- Bits AI
- Service Catalog
- API Catalog
- Error Tracking
- Service Management
- Infrastructure
- Application Performance
- APM
- Continuous Profiler
- Database Monitoring
- Data Streams Monitoring
- Data Jobs Monitoring
- Digital Experience
- Real User Monitoring
- Product Analytics
- Synthetic Testing and Monitoring
- Continuous Testing
- Software Delivery
- CI Visibility
- CD Visibility
- Test Optimization
- Code Analysis
- Quality Gates
- DORA Metrics
- Security
- Security Overview
- Cloud SIEM
- Cloud Security Management
- Application Security Management
- AI Observability
- Log Management
- Observability Pipelines
- Log Management
- Administration
Watchdog Insights for Logs
Overview
Datadog Log Management offers Watchdog Insights to help you resolve incidents faster with contextual insights in the Log Explorer. Watchdog Insights complement your expertise and instincts by surfacing suspect anomalies, outliers, and potential performance bottlenecks impacting a subset of users.
Navigation
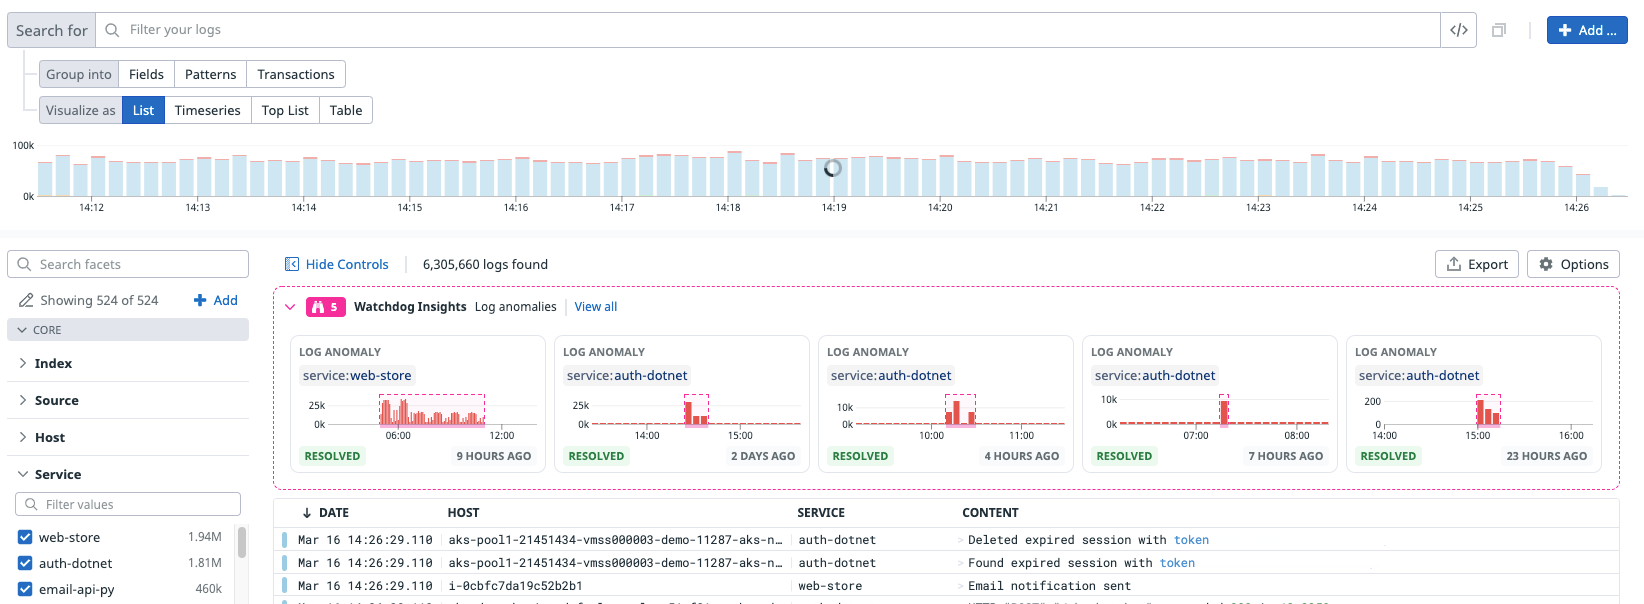
The Watchdog Insights banner appears in the Log Explorer and displays insights about the current query:
To see an overview of all insights, expand the Watchdog Insight banner:
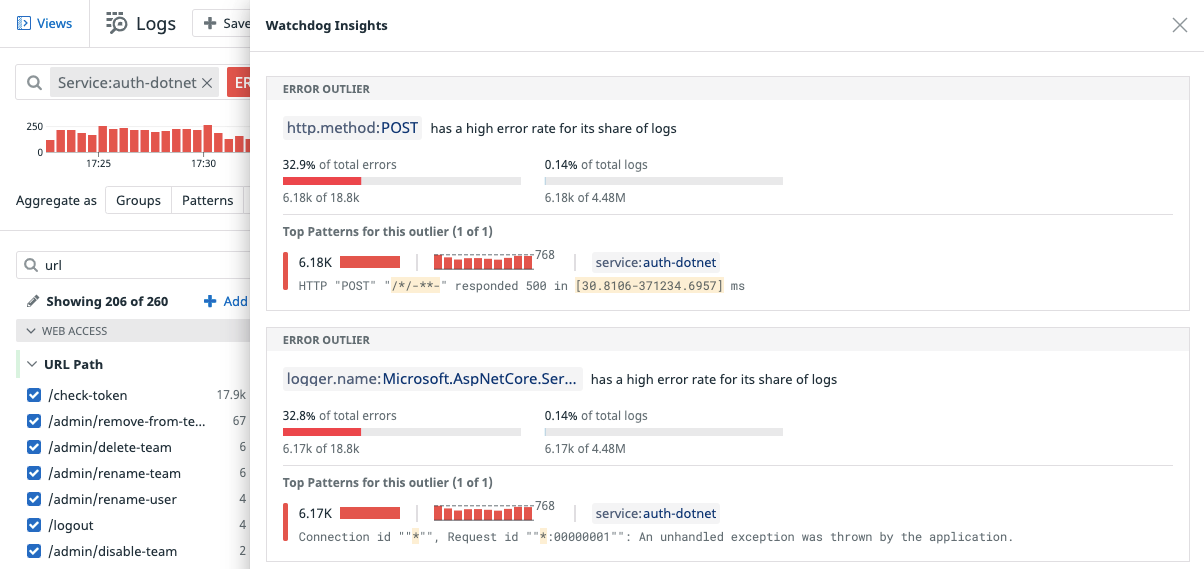
To access the full Watchdog Insights side panel, click View all:
Every insight comes with embedded interactions and a side panel with troubleshooting information. The insight interactions and side panel vary based on the Watchdog Insight type.
Insight Types
Watchdog Insights surfaces anomalies and outliers detected on specific tags, enabling you to investigate the root cause of an issue. Insights are discovered from APM, Continuous Profiler, Log Management, and infrastructure data that include the service tag. The two types of insights specific to Log Management are:
Log Anomaly Detection
Ingested logs are analyzed at the intake level where Watchdog performs aggregations on detected patterns as well as environment, service, source and status tags.
These aggregated logs are scanned for anomalous behaviors, such as the following:
- An emergence of logs with a warning or error status.
- A sudden increase of logs with a warning or error status.
The logs surface as Insights in the Log Explorer, matching the search context and any restrictions applied to your role.
Click on a specific insight to see the full description of the detected anomaly as well as the list of patterns contributing to it.
Anomalies that Watchdog determines to be particularly severe are also surfaced in the Watchdog alerts feed and can be alerted on by setting up a Watchdog logs monitor. A severe anomaly is defined as:
- containing error logs
- lasting at least 10 minutes (to avoid transient errors)
- having a significant increase (to avoid small increases)
For more information about searching logs in the Log Explorer, see Log Search Syntax and Custom Time Frames.
Error Outliers
Error outliers display fields such as faceted tags or attributes containing characteristics of errors that match the current query. Statistically overrepresented key:value pairs among errors provide hints into the root cause of problems.
Typical examples of error outliers include env:staging, docker_image:acme:3.1, and http.useragent_details.browser.family:curl.
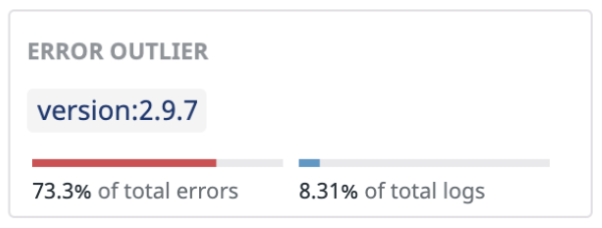
In the banner card view, you can see:
- The field name.
- The proportion of errors and overall logs that the field contributes to.
In the side panel card view, you can see the main log pattern of error logs with the field.
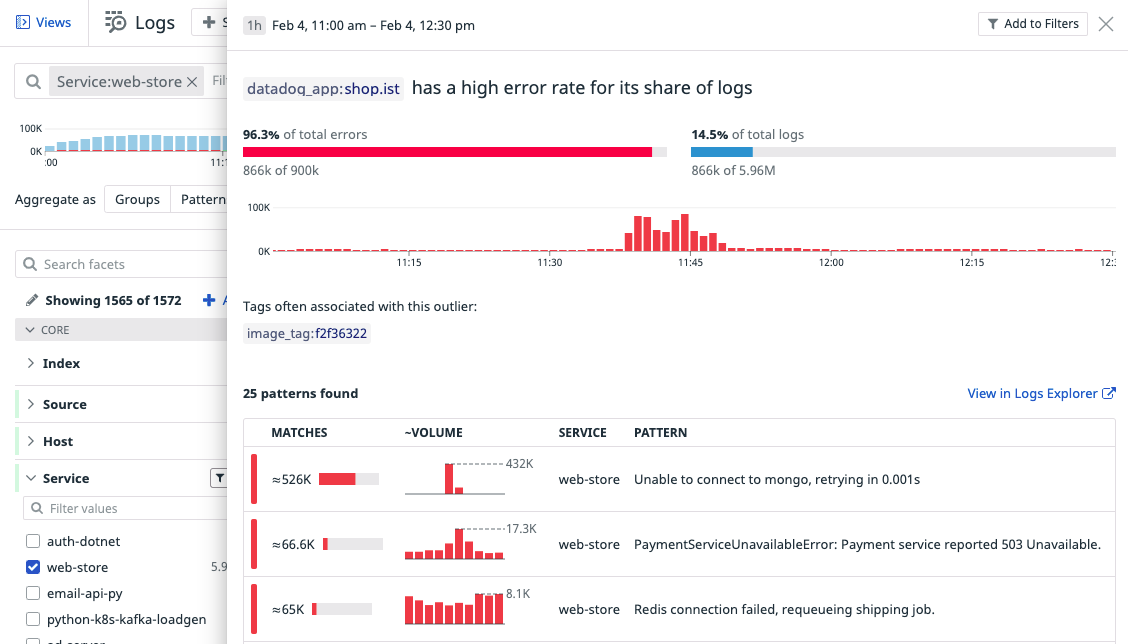
In the full side panel view, you can see:
- The timeseries of error logs that contain the field.
- Tags that are often associated with the error logs.
- A comprehensive list of log patterns.
Further Reading
Additional helpful documentation, links, and articles:


