- Essentials
- Getting Started
- Datadog
- Datadog Site
- DevSecOps
- Serverless for AWS Lambda
- Agent
- Integrations
- Containers
- Dashboards
- Monitors
- Logs
- APM Tracing
- Profiler
- Tags
- API
- Service Catalog
- Session Replay
- Continuous Testing
- Synthetic Monitoring
- Incident Management
- Database Monitoring
- Cloud Security Management
- Cloud SIEM
- Application Security Management
- Workflow Automation
- CI Visibility
- Test Visibility
- Test Impact Analysis
- Code Analysis
- Learning Center
- Support
- Glossary
- Standard Attributes
- Guides
- Agent
- Integrations
- OpenTelemetry
- Developers
- Authorization
- DogStatsD
- Custom Checks
- Integrations
- Create an Agent-based Integration
- Create an API Integration
- Create a Log Pipeline
- Integration Assets Reference
- Build a Marketplace Offering
- Create a Tile
- Create an Integration Dashboard
- Create a Recommended Monitor
- Create a Cloud SIEM Detection Rule
- OAuth for Integrations
- Install Agent Integration Developer Tool
- Service Checks
- IDE Plugins
- Community
- Guides
- Administrator's Guide
- API
- Datadog Mobile App
- CoScreen
- Cloudcraft
- In The App
- Dashboards
- Notebooks
- DDSQL Editor
- Sheets
- Monitors and Alerting
- Infrastructure
- Metrics
- Watchdog
- Bits AI
- Service Catalog
- API Catalog
- Error Tracking
- Service Management
- Infrastructure
- Application Performance
- APM
- Continuous Profiler
- Database Monitoring
- Data Streams Monitoring
- Data Jobs Monitoring
- Digital Experience
- Real User Monitoring
- Product Analytics
- Synthetic Testing and Monitoring
- Continuous Testing
- Software Delivery
- CI Visibility
- CD Visibility
- Test Optimization
- Code Analysis
- Quality Gates
- DORA Metrics
- Security
- Security Overview
- Cloud SIEM
- Cloud Security Management
- Application Security Management
- AI Observability
- Log Management
- Observability Pipelines
- Log Management
- Administration
Testing and Deployment Dashboards
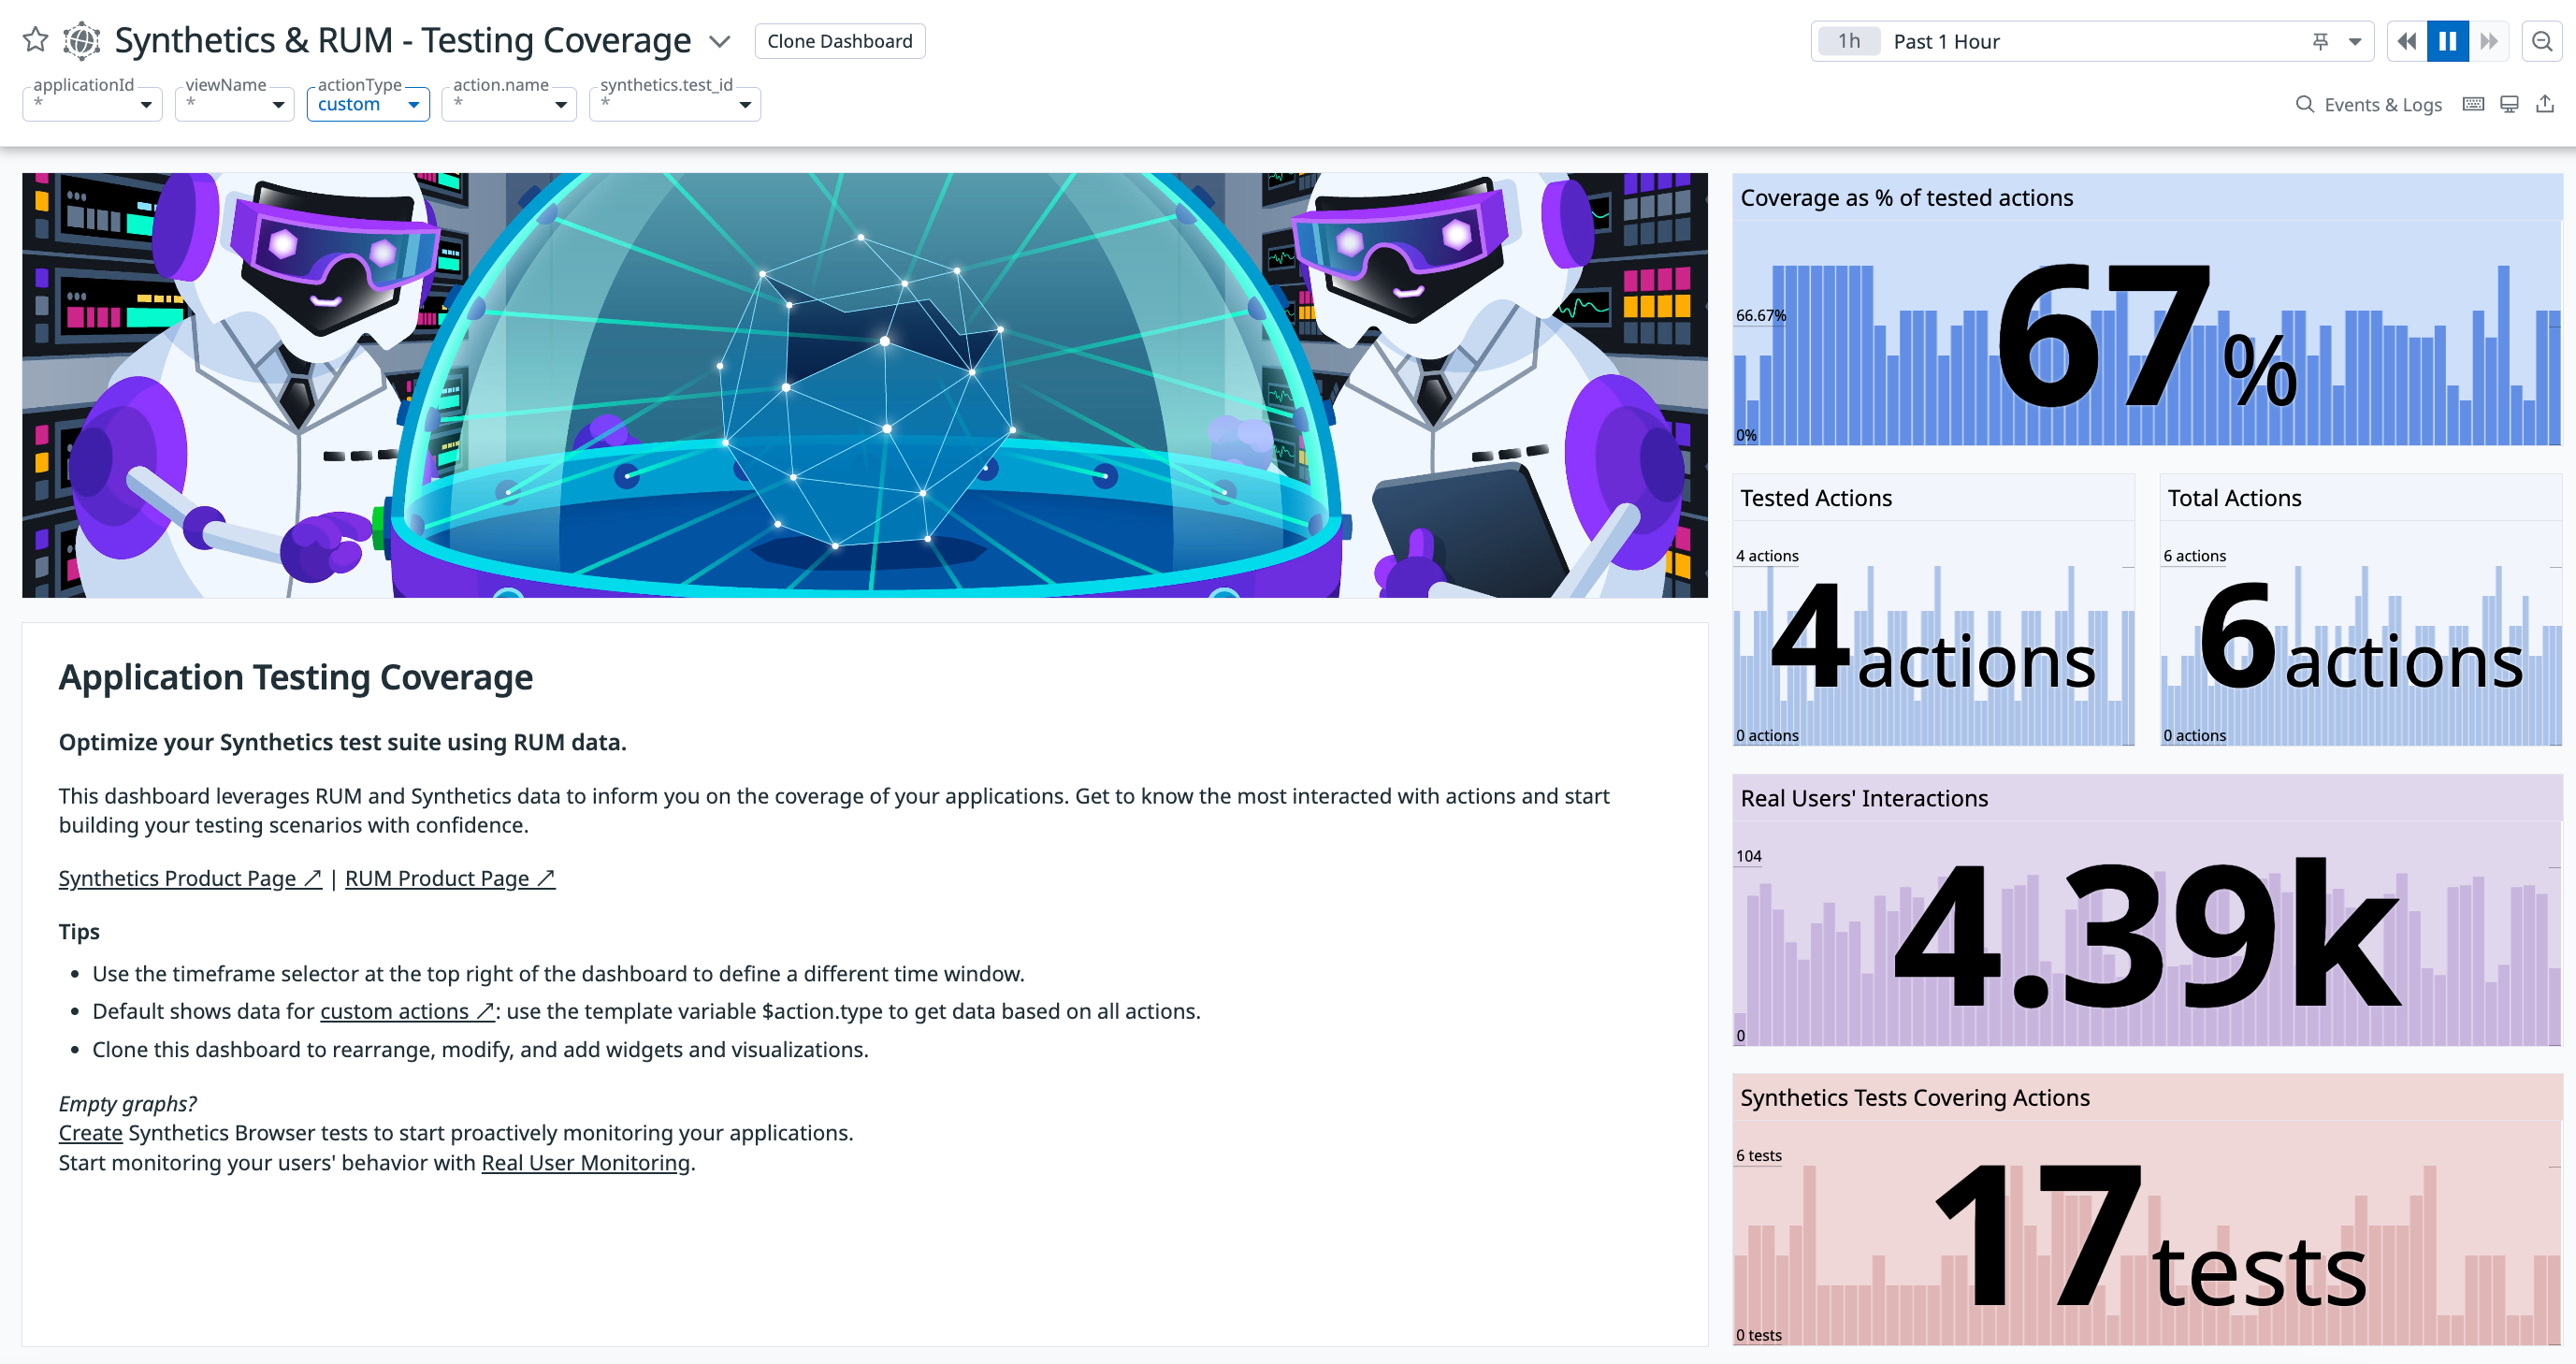
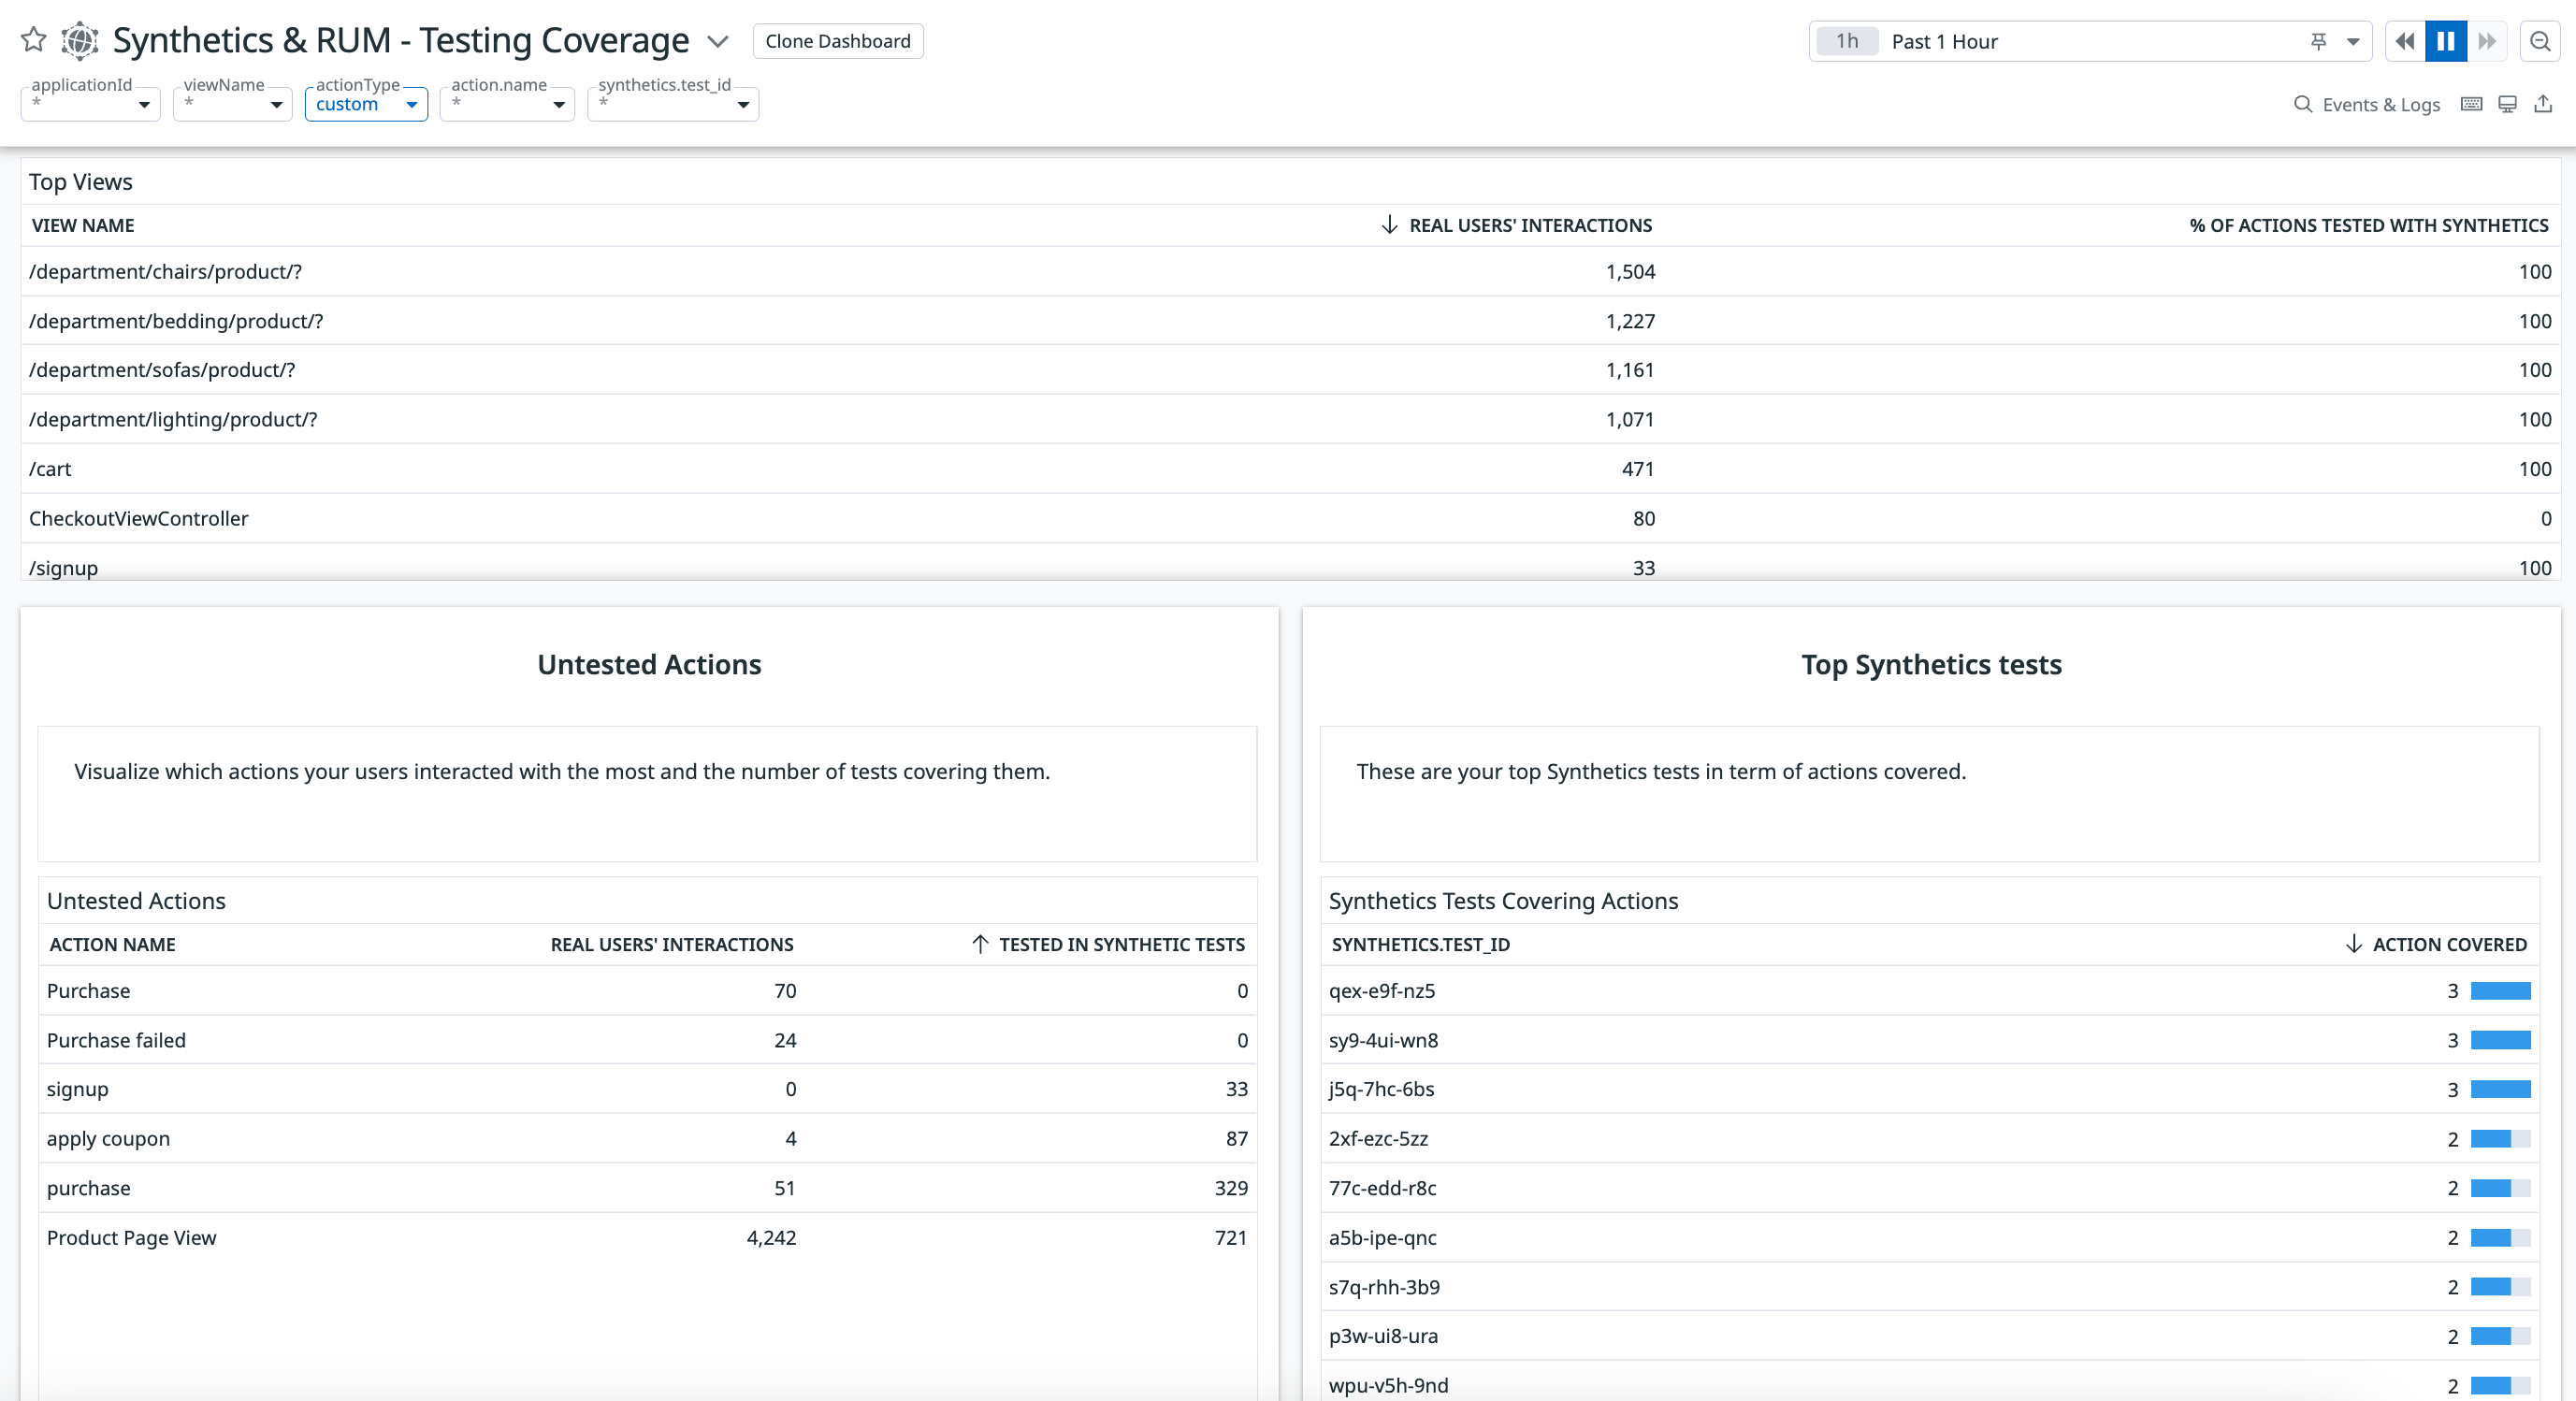
Testing coverage
The Synthetics & RUM application testing coverage dashboard uses data collected from RUM and results from Synthetic browser tests to provide insights about the overall testing coverage for your application.
You can use this dashboard to answer the following questions:
- What is and what is not being tested in your application?
- How do you identify the most popular sections of your application to continuously monitor?
- How do you find the most popular user actions in your application to add browser test coverage?
It shows:
- Percentage of tested actions: Scan your application’s overall testing coverage.
- Untested actions: Explore the most popular untested user actions with the count of real user interactions and the number of actions covered in browser tests.
For more information about the data displayed, see RUM Browser Data Collected.
Web deployment tracking
The RUM Web App Deployment Tracking dashboard helps you identify when a recent deployment is causing performance issues or new errors within your application. To use this feature, make sure that you add RUM versions to your application. This dashboard shows:
- Core web vitals: For all views, three browser performance metrics are highlighted: Largest Contentful Paint, First Input Delay, and Cumulative Layout Shift. Other performance metrics, such as Load Time, are also available.
- Errors: See a count of errors, percentage of views with errors, and explore ongoing issues.
- Browser performance metrics: Compare performance metrics like loading time, sessions, errors, and load times across different services and versions.
Mobile deployment tracking
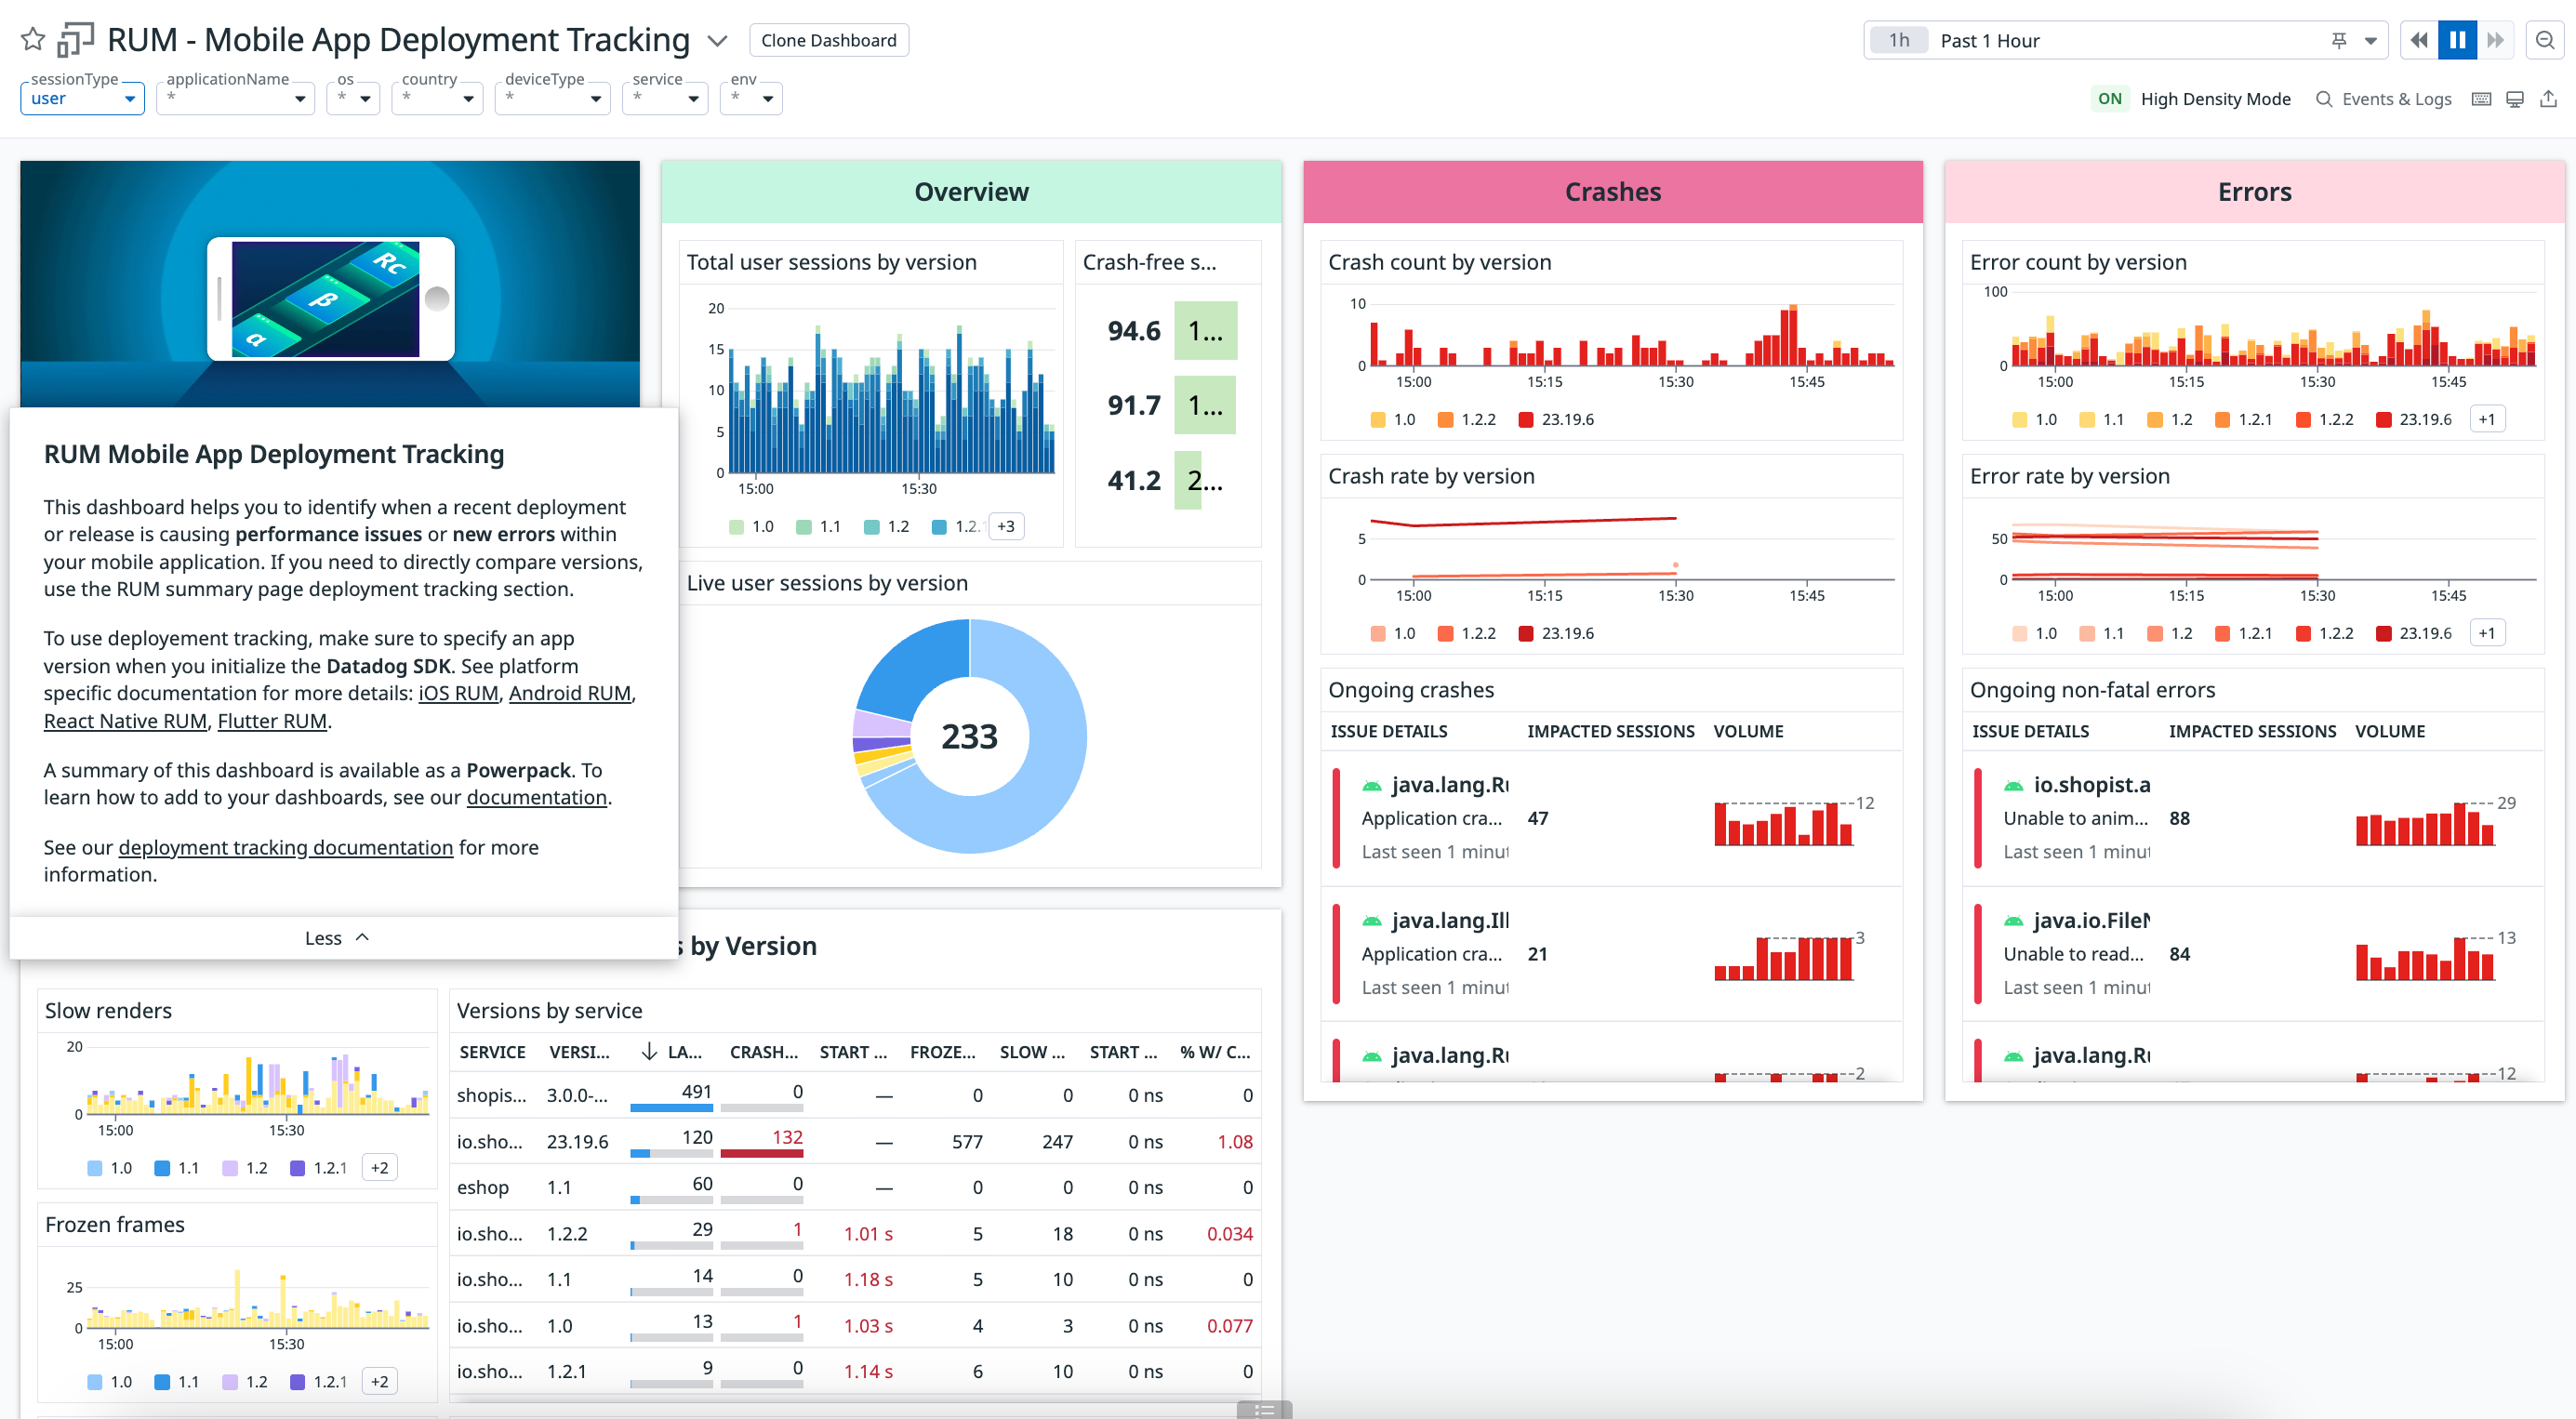
The RUM Mobile App Deployment Tracking dashboard helps you to identify when a recent deployment or release is causing performance issues or new errors within your mobile application. If you need to directly compare versions, use the RUM summary page deployment tracking section.
To use deployment tracking, make sure to specify an app version when you initialize the Datadog SDK.
This dashboard shows:
- Crashes: Review crash count by version, crash rate by version, and explore ongoing crashes.
- Errors: Review error count by version, error rate by version, and explore ongoing errors.
- Mobile vitals by version: For all versions, four mobile performance metrics are highlighted: slow renders, frozen frames, application start time, and memory usage.
For more information about the data displayed, see our documentation for each platform: iOS RUM, Android RUM, React Native RUM, and Flutter RUM.
Further Reading
Additional helpful documentation, links, and articles:


