- Essentials
- Getting Started
- Datadog
- Datadog Site
- DevSecOps
- Serverless for AWS Lambda
- Agent
- Integrations
- Containers
- Dashboards
- Monitors
- Logs
- APM Tracing
- Profiler
- Tags
- API
- Service Catalog
- Session Replay
- Continuous Testing
- Synthetic Monitoring
- Incident Management
- Database Monitoring
- Cloud Security Management
- Cloud SIEM
- Application Security Management
- Workflow Automation
- CI Visibility
- Test Visibility
- Test Impact Analysis
- Code Analysis
- Learning Center
- Support
- Glossary
- Standard Attributes
- Guides
- Agent
- Integrations
- OpenTelemetry
- Developers
- Authorization
- DogStatsD
- Custom Checks
- Integrations
- Create an Agent-based Integration
- Create an API Integration
- Create a Log Pipeline
- Integration Assets Reference
- Build a Marketplace Offering
- Create a Tile
- Create an Integration Dashboard
- Create a Recommended Monitor
- Create a Cloud SIEM Detection Rule
- OAuth for Integrations
- Install Agent Integration Developer Tool
- Service Checks
- IDE Plugins
- Community
- Guides
- Administrator's Guide
- API
- Datadog Mobile App
- CoScreen
- Cloudcraft
- In The App
- Dashboards
- Notebooks
- DDSQL Editor
- Sheets
- Monitors and Alerting
- Infrastructure
- Metrics
- Watchdog
- Bits AI
- Service Catalog
- API Catalog
- Error Tracking
- Service Management
- Infrastructure
- Application Performance
- APM
- Continuous Profiler
- Database Monitoring
- Data Streams Monitoring
- Data Jobs Monitoring
- Digital Experience
- Real User Monitoring
- Product Analytics
- Synthetic Testing and Monitoring
- Continuous Testing
- Software Delivery
- CI Visibility
- CD Visibility
- Test Optimization
- Code Analysis
- Quality Gates
- DORA Metrics
- Security
- Security Overview
- Cloud SIEM
- Cloud Security Management
- Application Security Management
- AI Observability
- Log Management
- Observability Pipelines
- Log Management
- Administration
Timeline
Overview
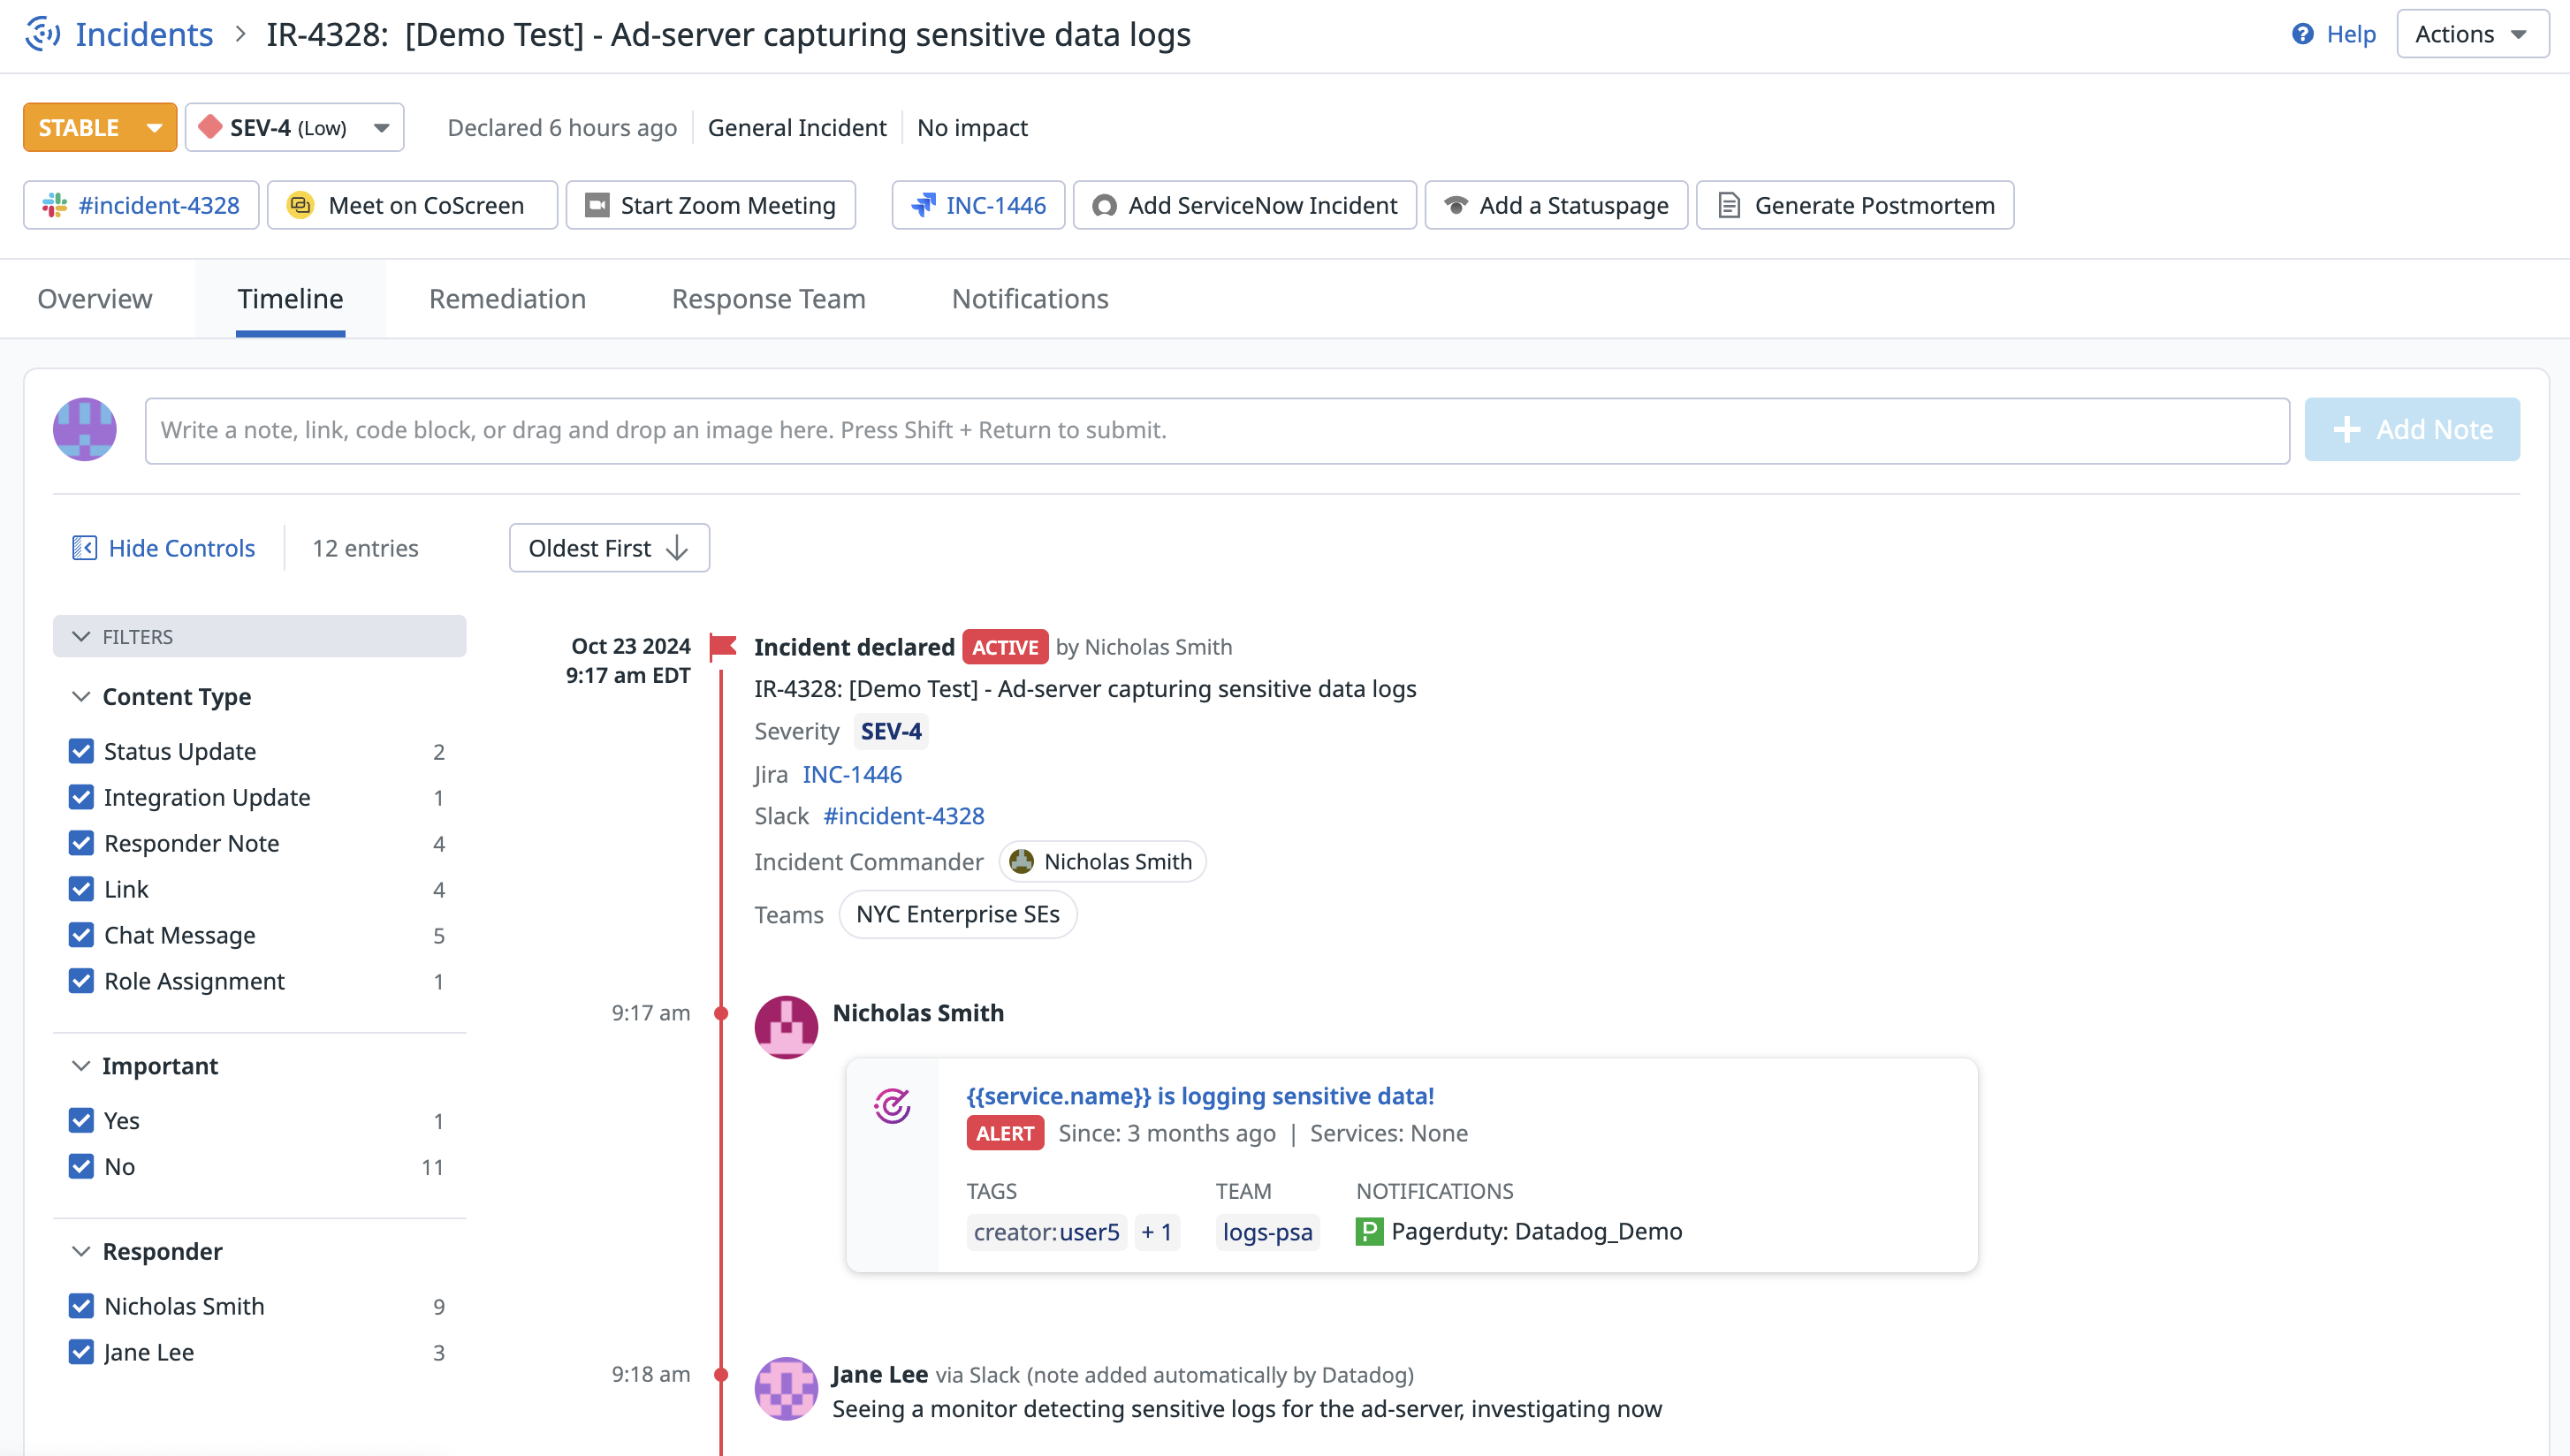
The Incident Timeline is the primary source of information for the work done during an incident. As actions are performed, new cells are added to the timeline in chronological order to capture the changes made, the person who made the change, and the time the changes were made.
By default, timeline cells are sorted in oldest first order, but you can change it to newest first using the button at the top of the timeline.
Content types
Each cell has its own content type that indicates the kind of information the cell contains:
| Content type | Description |
|---|---|
| Responder note | A note manually written by an incident responder. Responder notes have the following sub-types: - Graph: The responder note contains one or more Datadog graphs - Link: The responder note contains a hyperlink - Code: The responder note contains text wrapped in Markdown syntax for code blocks |
| Incident update | Any changes made to an incident’s properties (including status and severity) or its impact. |
| Integration update | Any changes made through the Incident Management product’s integrations. |
| Task | Any changes made to incident tasks in the Remediation section of the Incident Details page. |
| Notification sent | An update when a manual notification is sent by an incident responder. |
Responder notes
Add responder notes directly to the timeline using the text box underneath the section tabs of the Incident Details page. You can also add responder notes to the timeline from Slack. You can customize the timestamp of the responder note at creation time to capture important information that was relevant at an earlier point in time in the chronological order of the timeline.
For responder notes you author, you can edit the content or timestamp, or delete the note entirely. You can also copy a link to a specific cell to share with teammates.
Graph cells
Graph definitions are stored using share URLs for graphs if enabled in your Organization Settings. For 24 hours after a graph cell is added to the timeline, it has the same full interactive hover states found in Dashboards, Notebooks, and other pages. After 24 hours in the timeline, the graph is replaced with static images capturing what the graph was displaying. This is to ensure that graphs with data that has short retention have backups you can view after the live data for the graphs expires.
Images
To upload an image to be hosted by Datadog, drop an image file into the text box field above the timeline. This adds the image as an individual cell in the timeline.
You can also add an image to an existing cell:
- Click the pencil icon to edit a cell.
- Click the image icon and locate the image in your file directory.
- You can use any of the following options to upload an image to be hosted by Datadog:
- Drop an image file into the upload area.
- Click Choose File and locate the image in your file directory.
- Paste a publicly accessible URL for the image.
Further reading
Additional helpful documentation, links, and articles:


