- Principales informations
- Getting Started
- Datadog
- Site Datadog
- DevSecOps
- Serverless for AWS Lambda
- Agent
- Intégrations
- Conteneurs
- Dashboards
- Monitors
- Logs
- Tracing
- Profileur
- Tags
- API
- Service Catalog
- Session Replay
- Continuous Testing
- Surveillance Synthetic
- Incident Management
- Database Monitoring
- Cloud Security Management
- Cloud SIEM
- Application Security Management
- Workflow Automation
- CI Visibility
- Test Visibility
- Intelligent Test Runner
- Code Analysis
- Learning Center
- Support
- Glossary
- Standard Attributes
- Guides
- Agent
- Intégrations
- OpenTelemetry
- Développeurs
- Authorization
- DogStatsD
- Checks custom
- Intégrations
- Create an Agent-based Integration
- Create an API Integration
- Create a Log Pipeline
- Integration Assets Reference
- Build a Marketplace Offering
- Create a Tile
- Create an Integration Dashboard
- Create a Recommended Monitor
- Create a Cloud SIEM Detection Rule
- OAuth for Integrations
- Install Agent Integration Developer Tool
- Checks de service
- IDE Plugins
- Communauté
- Guides
- API
- Application mobile
- CoScreen
- Cloudcraft
- In The App
- Dashboards
- Notebooks
- DDSQL Editor
- Alertes
- Infrastructure
- Métriques
- Watchdog
- Bits AI
- Service Catalog
- API Catalog
- Error Tracking
- Service Management
- Infrastructure
- Universal Service Monitoring
- Conteneurs
- Sans serveur
- Surveillance réseau
- Cloud Cost
- Application Performance
- APM
- Profileur en continu
- Database Monitoring
- Agent Integration Overhead
- Setup Architectures
- Configuration de Postgres
- Configuration de MySQL
- Configuration de SQL Server
- Setting Up Oracle
- Setting Up MongoDB
- Connecting DBM and Traces
- Données collectées
- Exploring Database Hosts
- Explorer les métriques de requête
- Explorer des échantillons de requêtes
- Dépannage
- Guides
- Data Streams Monitoring
- Data Jobs Monitoring
- Digital Experience
- RUM et Session Replay
- Product Analytics
- Surveillance Synthetic
- Continuous Testing
- Software Delivery
- CI Visibility
- CD Visibility
- Test Visibility
- Exécuteur de tests intelligent
- Code Analysis
- Quality Gates
- DORA Metrics
- Securité
- Security Overview
- Cloud SIEM
- Cloud Security Management
- Application Security Management
- AI Observability
- Log Management
- Pipelines d'observabilité
- Log Management
- Administration
Investigate Sensitive Data Issues
Cette page n'est pas encore disponible en français, sa traduction est en cours.
Si vous avez des questions ou des retours sur notre projet de traduction actuel, n'hésitez pas à nous contacter.
Si vous avez des questions ou des retours sur notre projet de traduction actuel, n'hésitez pas à nous contacter.
Overview
Sensitive Data Scanner is a stream-based, pattern matching service used to identify, tag, and optionally redact or hash sensitive data. When a sensitive data issue is found, you might have the following questions:
- What sensitive data has been exposed?
- What is the priority of the sensitive data exposure?
- How severe is the issue in terms of spread and volume?
- Where did the sensitive data come from?
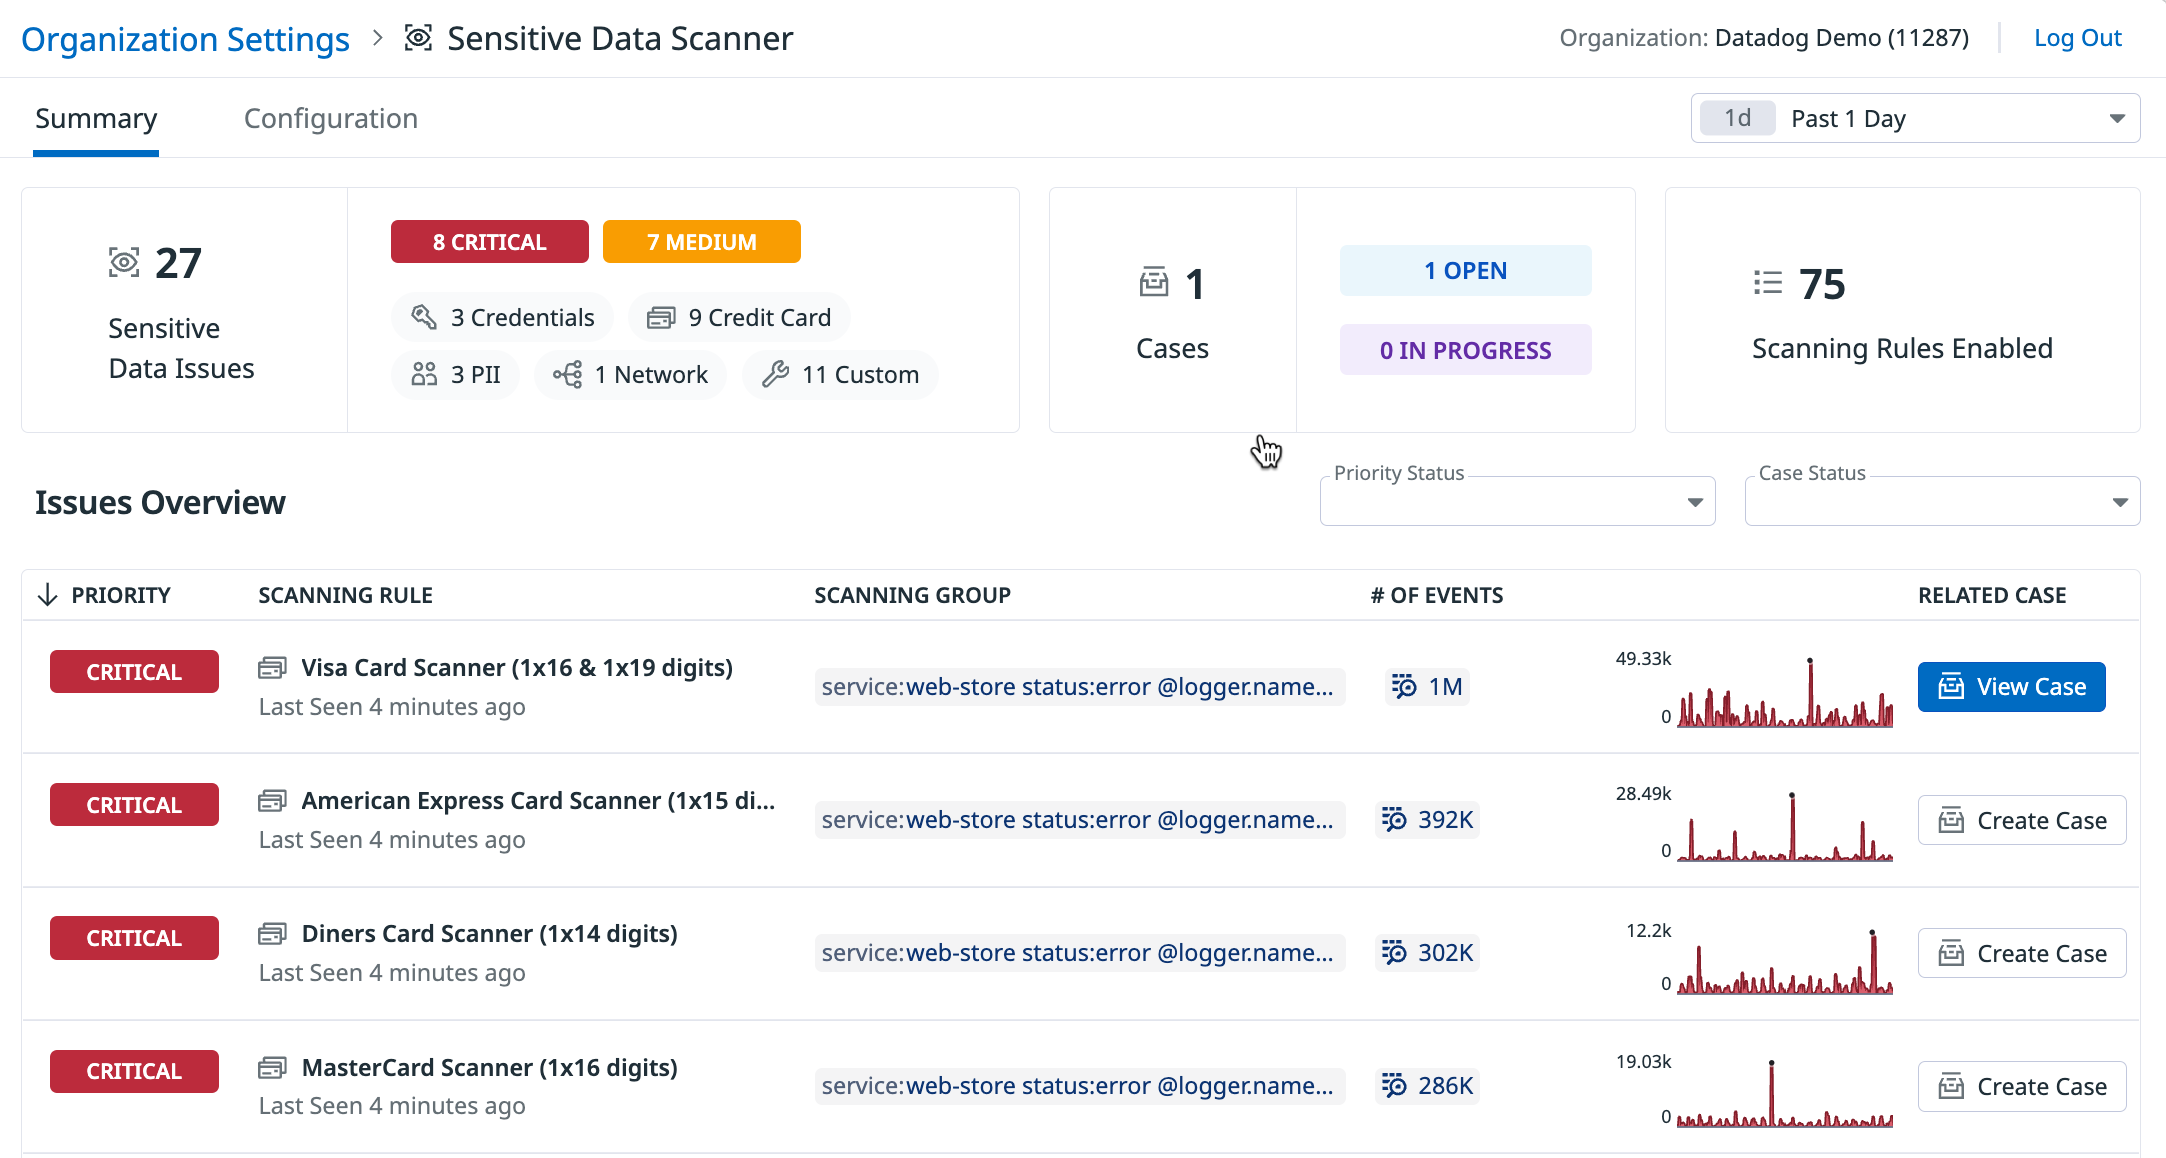
The Sensitive Data Scanner’s Summary page categorizes and prioritizes sensitive data issues so that you can investigate, collaborate, and document your findings, and answer those questions.
Triage sensitive data issues
Use the Summary page to see all sensitive data issues within the selected timeframe and start investigating issues.
In the Sensitive Data Issues section, filter by a priority level to see only issues with that priority level in the Issues Overview section. In the Cases section, filter by a case status to see issues associated to cases with that status in the Issues Overview section.
To investigate an issue:
- Click on the issue in the Issues Overview.
- In the issue panel, click View Recent Changes to navigate to Audit Trail and see if there are any recent configuration changes that caused the sensitive data issue.
- Click View All Logs to see in Log Explorer all logs matching the query.
Click View All APM Spans to see in Trace Explorer all traces matching the query.
Click View All RUM Events to see in RUM Explorer all RUM events matching the query.
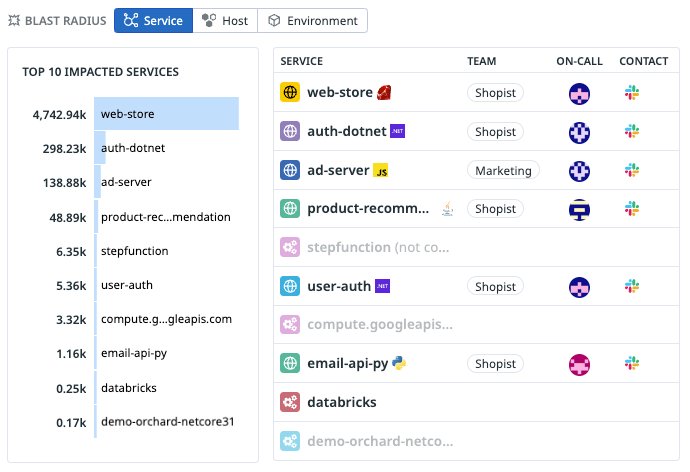
Click View All Events to see in Events Explorer all events matching the query. - In the Blast Radius section:
a. View the Top 10 services, hosts, and environments impacted by this sensitive data issue.
b. Click on a service to see more information about the service in the Service Catalog.
c. Click on a host to see more information about the host in the Infrastructure List page.If you want to modify the Scanning Rule that was used to detect the sensitive data issue, click Modify Rule at the top of the panel.
Additionally, you can also:
- Use Case Management to track, triage, and investigate the issue, click Create Case at the top of the panel. Associated cases are surfaced in the Summary page.
- Use Incident Management to create an incident, you can add the issue to an existing incident or declare a new incident. Click the Declare Incident dropdown menu to add the issue to an existing incident. Click Declare Incident to declare a new incident.
- Use Audit Trail to see who may have accessed this sensitive data within Datadog, View in Audit Trail in the Users who accessed these events section.
Further Reading
Documentation, liens et articles supplémentaires utiles:


