- Essentials
- Getting Started
- Datadog
- Datadog Site
- DevSecOps
- Serverless for AWS Lambda
- Agent
- Integrations
- Containers
- Dashboards
- Monitors
- Logs
- APM Tracing
- Profiler
- Tags
- API
- Service Catalog
- Session Replay
- Continuous Testing
- Synthetic Monitoring
- Incident Management
- Database Monitoring
- Cloud Security Management
- Cloud SIEM
- Application Security Management
- Workflow Automation
- CI Visibility
- Test Visibility
- Test Impact Analysis
- Code Analysis
- Learning Center
- Support
- Glossary
- Standard Attributes
- Guides
- Agent
- Integrations
- OpenTelemetry
- Developers
- Authorization
- DogStatsD
- Custom Checks
- Integrations
- Create an Agent-based Integration
- Create an API Integration
- Create a Log Pipeline
- Integration Assets Reference
- Build a Marketplace Offering
- Create a Tile
- Create an Integration Dashboard
- Create a Recommended Monitor
- Create a Cloud SIEM Detection Rule
- OAuth for Integrations
- Install Agent Integration Developer Tool
- Service Checks
- IDE Plugins
- Community
- Guides
- Administrator's Guide
- API
- Datadog Mobile App
- CoScreen
- Cloudcraft
- In The App
- Dashboards
- Notebooks
- DDSQL Editor
- Sheets
- Monitors and Alerting
- Infrastructure
- Metrics
- Watchdog
- Bits AI
- Service Catalog
- API Catalog
- Error Tracking
- Service Management
- Infrastructure
- Application Performance
- APM
- Continuous Profiler
- Database Monitoring
- Data Streams Monitoring
- Data Jobs Monitoring
- Digital Experience
- Real User Monitoring
- Product Analytics
- Synthetic Testing and Monitoring
- Continuous Testing
- Software Delivery
- CI Visibility
- CD Visibility
- Test Optimization
- Code Analysis
- Quality Gates
- DORA Metrics
- Security
- Security Overview
- Cloud SIEM
- Cloud Security Management
- Application Security Management
- AI Observability
- Log Management
- Observability Pipelines
- Log Management
- Administration
Path View
Network Path for Datadog Network Performance Monitoring is not supported for your selected Datadog site ().
Network Path for Datadog Network Performance Monitoring is in Preview. Reach out to your Datadog representative to sign up.
Overview
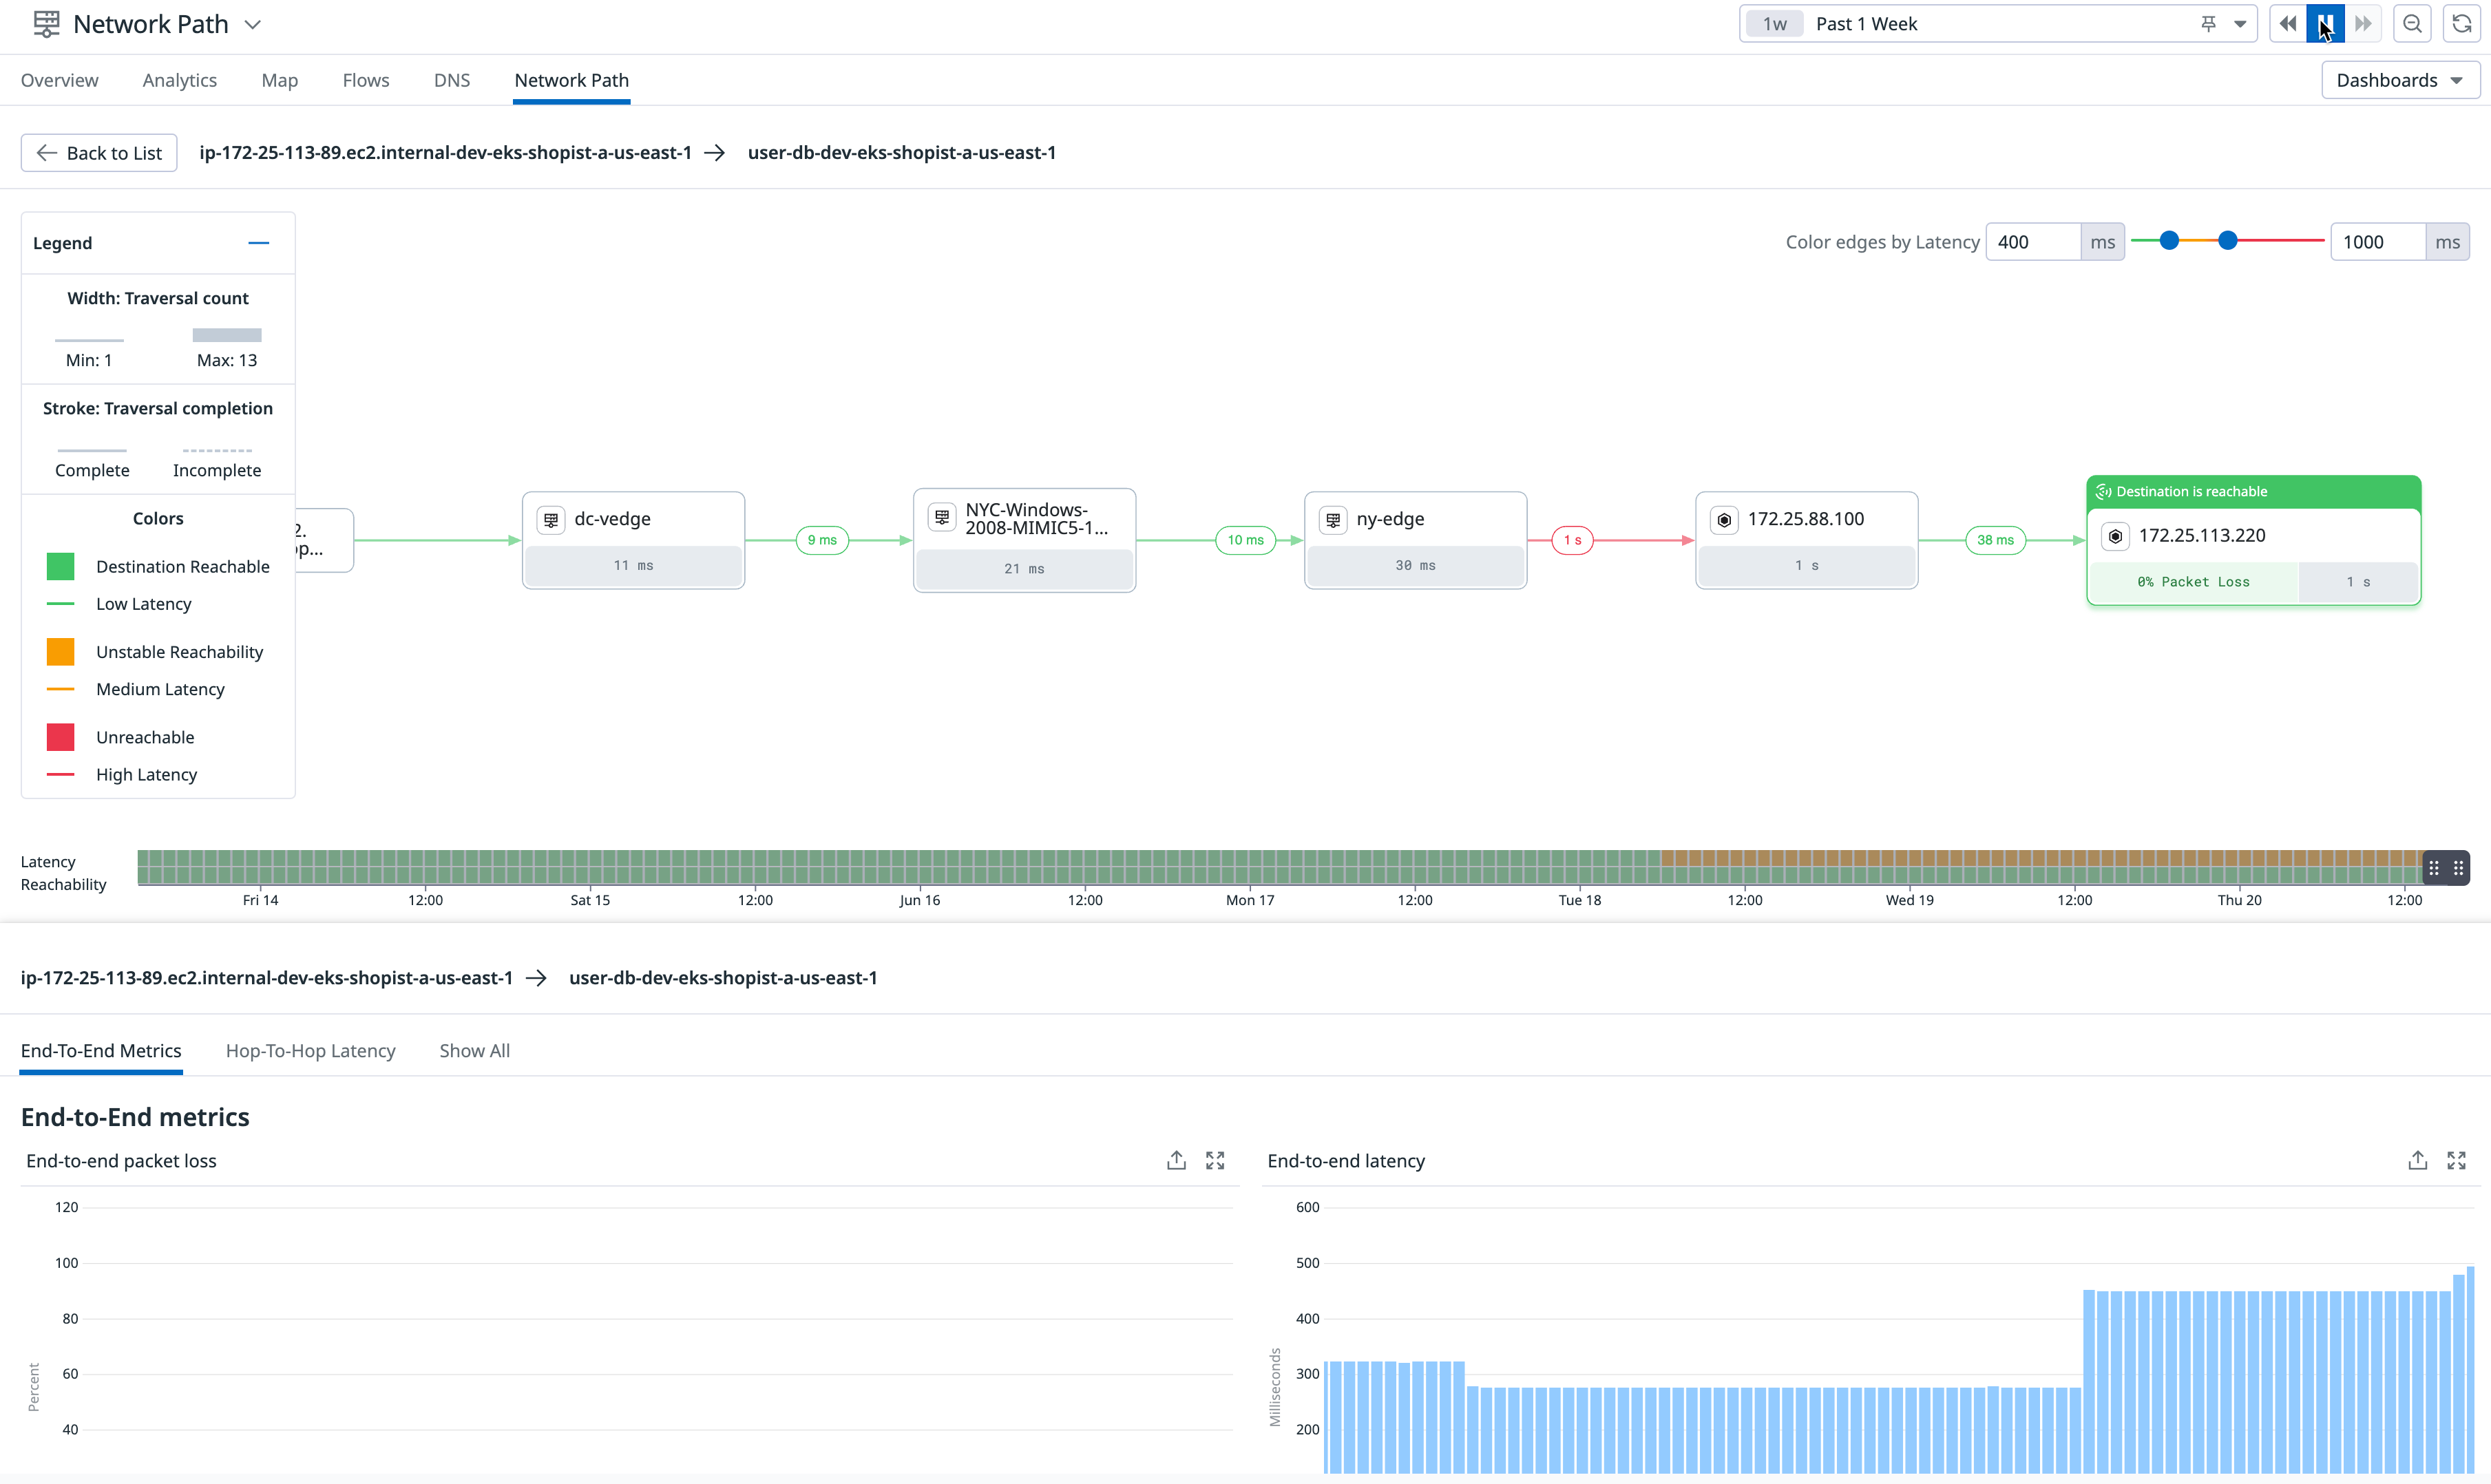
The Path View section in Network Path allows for detailed examination of a particular route, assisting in resolving potential problems that might occur from the source to the destination. It offers comprehensive data on both end-to-end latency and packet loss throughout the route.
To access the path view page, click into a path from the List view. On this page, you have the ability to change the latency threshold colors, and view the status of each hop.
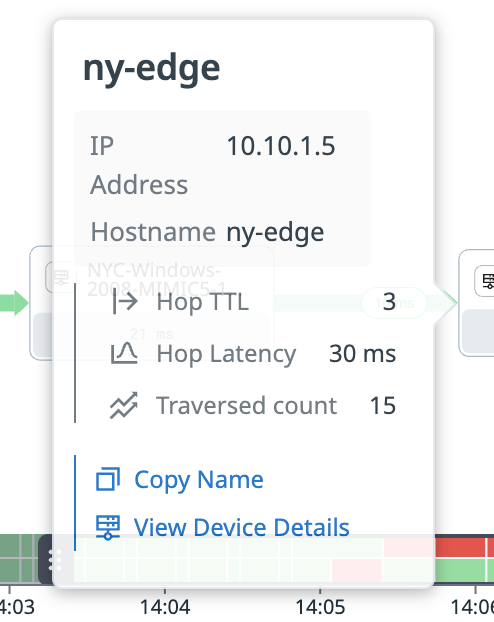
Click any path from the hop between the source to the destination to observe additional details such as Hop TTL, Hop Latency, and Traversed count. Then, click View Device Details to navigate to the Device details in NDM for the selected device.
Legend
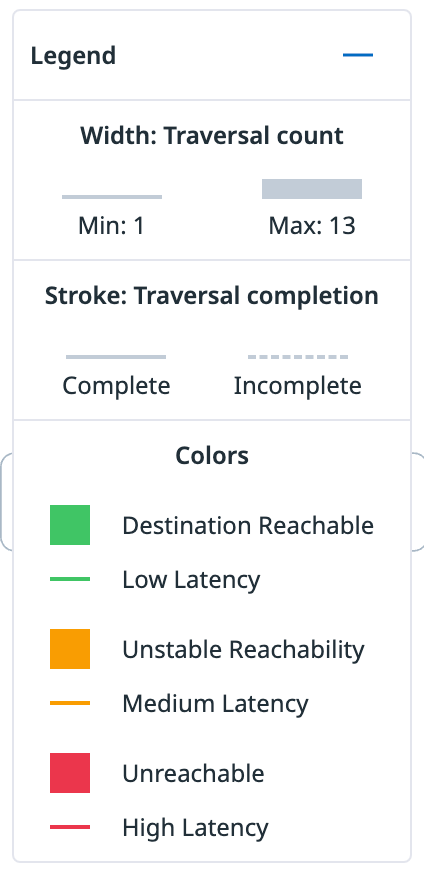
The legend provides additional details about the status of each hop.
- Traversal count
- Number of
traceroutesthat have ran through the hop. - Traversal completion
- Represents whether or not the
traceroutewas able to successfully reach the destination. - Reachability
- The level of packet loss the destination is experiencing.
- Latency
- How long the
traceroutetook to get from a source to its destination.
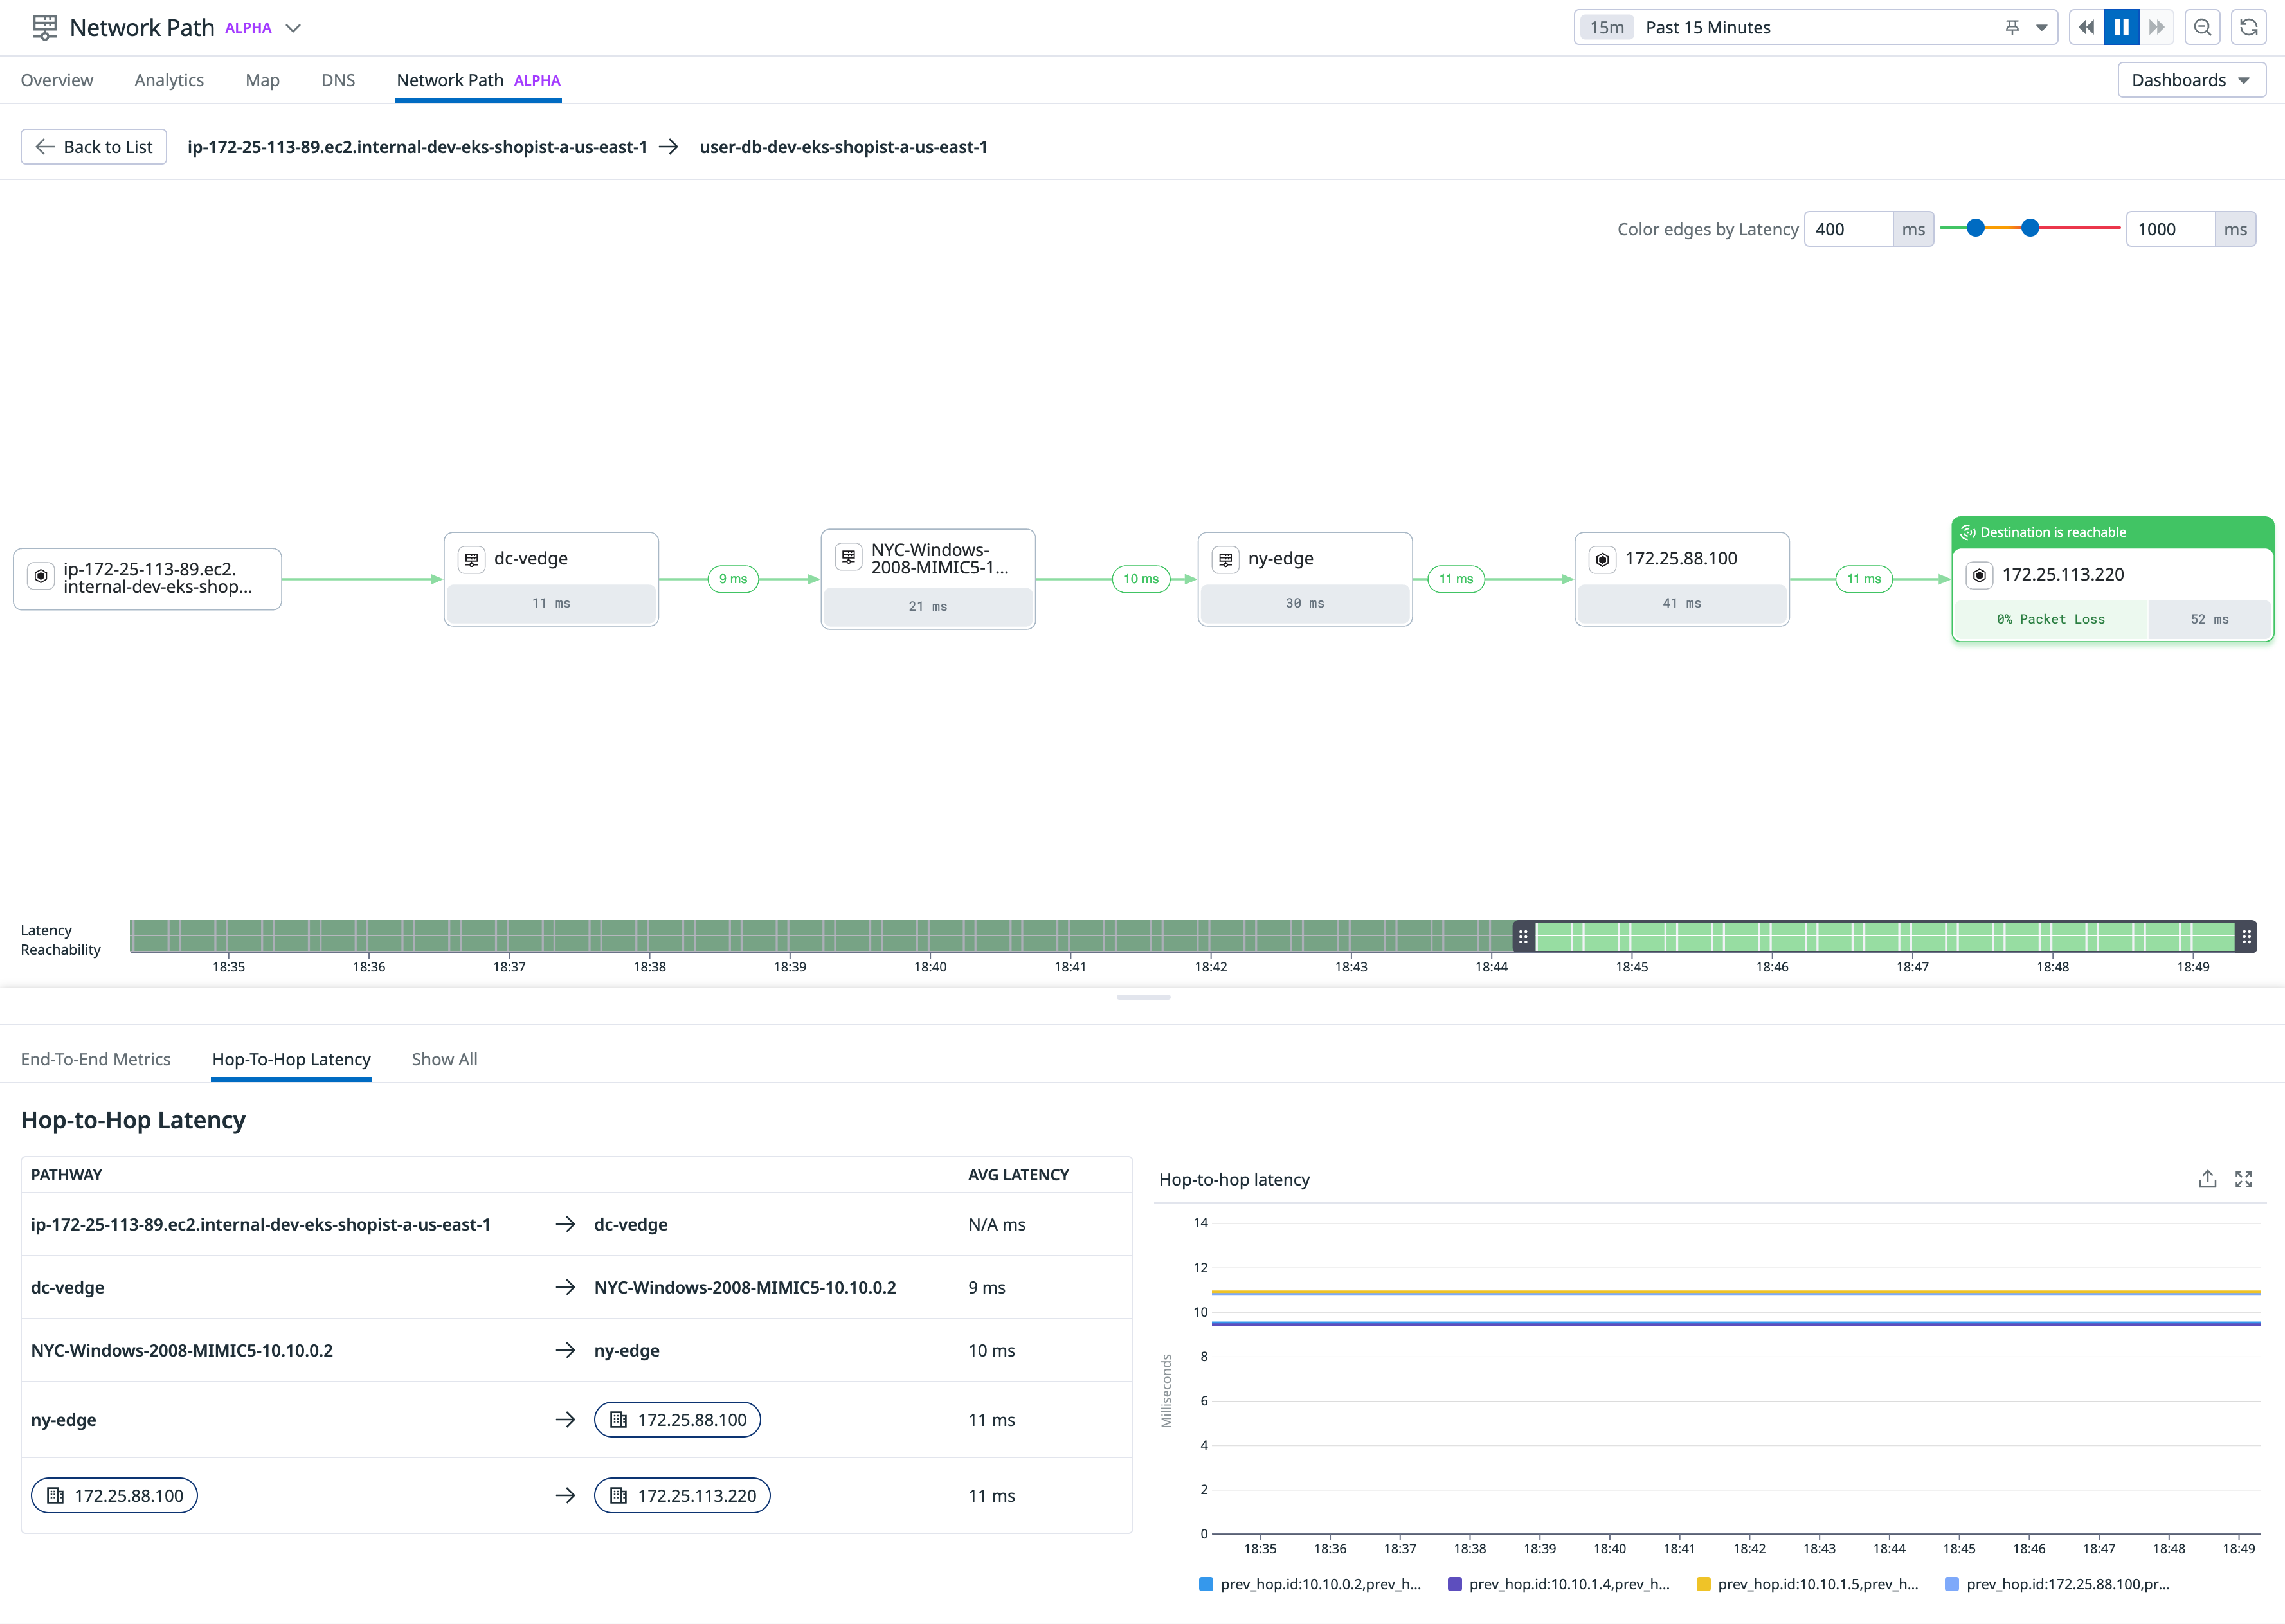
Note: Hop-to-hop latency may show N/A for hops that were incomplete.
Health bar
Drag the latency reachability health bar to observe a snapshot of the end-to-end latency and end-to-end packet loss for a specific time interval along the path.
Note: Changing the health bar does not affect the global time range at the top of the page.
Graphs
The lower section of the path view page provides additional insights about each path through a series of graphs.
End-to-end metrics graph
The end-to-end metrics graph presents a visual representation of both the end-to-end latency and end-to-end packet loss for each path, allowing you to compare and analyze them effectively.
Hop-to-hop latency graph
The hop-to-hop latency graph provides a detailed view of the latency for each hop along the path, making it easier to identify potential bottlenecks or problem areas.
Further Reading
Additional helpful documentation, links, and articles:


