- Essentials
- Getting Started
- Datadog
- Datadog Site
- DevSecOps
- Serverless for AWS Lambda
- Agent
- Integrations
- Containers
- Dashboards
- Monitors
- Logs
- APM Tracing
- Profiler
- Tags
- API
- Service Catalog
- Session Replay
- Continuous Testing
- Synthetic Monitoring
- Incident Management
- Database Monitoring
- Cloud Security Management
- Cloud SIEM
- Application Security Management
- Workflow Automation
- CI Visibility
- Test Visibility
- Test Impact Analysis
- Code Analysis
- Learning Center
- Support
- Glossary
- Standard Attributes
- Guides
- Agent
- Integrations
- OpenTelemetry
- Developers
- Authorization
- DogStatsD
- Custom Checks
- Integrations
- Create an Agent-based Integration
- Create an API Integration
- Create a Log Pipeline
- Integration Assets Reference
- Build a Marketplace Offering
- Create a Tile
- Create an Integration Dashboard
- Create a Recommended Monitor
- Create a Cloud SIEM Detection Rule
- OAuth for Integrations
- Install Agent Integration Developer Tool
- Service Checks
- IDE Plugins
- Community
- Guides
- Administrator's Guide
- API
- Datadog Mobile App
- CoScreen
- Cloudcraft
- In The App
- Dashboards
- Notebooks
- DDSQL Editor
- Sheets
- Monitors and Alerting
- Infrastructure
- Metrics
- Watchdog
- Bits AI
- Service Catalog
- API Catalog
- Error Tracking
- Service Management
- Infrastructure
- Application Performance
- APM
- Continuous Profiler
- Database Monitoring
- Data Streams Monitoring
- Data Jobs Monitoring
- Digital Experience
- Real User Monitoring
- Product Analytics
- Synthetic Testing and Monitoring
- Continuous Testing
- Software Delivery
- CI Visibility
- CD Visibility
- Test Optimization
- Code Analysis
- Quality Gates
- DORA Metrics
- Security
- Security Overview
- Cloud SIEM
- Cloud Security Management
- Application Security Management
- AI Observability
- Log Management
- Observability Pipelines
- Log Management
- Administration
Azure App Service - Linux Code
Overview
This instrumentation method provides the following additional monitoring capabilities for Linux Azure App Service workloads:
- Fully distributed APM tracing using automatic instrumentation.
- Customized APM service and trace views showing relevant Azure App Service metrics and metadata.
- Support for manual APM instrumentation to customize spans.
Trace_IDinjection into application logs.- Support for submitting custom metrics using DogStatsD.
This solution uses the startup command setting and Application Settings for Linux Azure App Service to instrument the application and manage its configuration. Java, Node, .NET, PHP, and Python are supported.
Setup
Set application settings
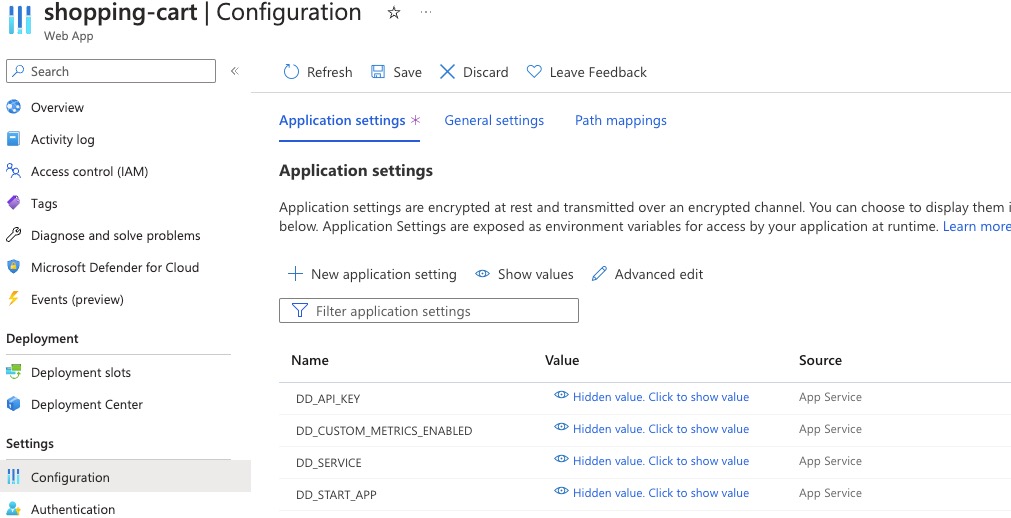
To instrument your application, begin by adding the following key-value pairs under App settings in your Azure “Environment variables” settings.
DD_API_KEYis your Datadog API key.DD_CUSTOM_METRICS_ENABLED(optional) enables custom metrics.DD_SITEis the Datadog site parameter. Your site is. This value defaults todatadoghq.com.DD_SERVICEis the service name used for this program. Defaults to the name field value inpackage.json.DD_START_APPis the command used to start your application. For example,node ./bin/www(unnecessary for applications running in Tomcat).DD_PROFILING_ENABLED(optional) Enables the Continuous Profiler, specific to .NET.
Identifying your startup command
Linux Azure App Service Web Apps built using the code deployment option on built-in runtimes depend on a startup command that varies by language. The default values are outlined in Azure’s documentation. Examples are included below.
Set these values in the DD_START_APP environment variable. Examples below are for an application named datadog-demo, where relevant.
| Runtime | DD_START_APP Example Value | Description |
|---|---|---|
| Node.js | node ./bin/www | Runs the Node PM2 configuration file, or your script file. |
| .NET Core | dotnet datadog-demo.dll | Runs a .dll file that uses your Web App name by default.Note: The .dll file name in the command should match the file name of your .dll file. In certain cases, this might not match your Web App. |
| PHP | cp /home/site/wwwroot/default /etc/nginx/sites-available/default && service nginx reload | Copies script to correct location and starts application. |
| Python | gunicorn --bind=0.0.0.0 --timeout 600 quickstartproject.wsgi | Custom startup script. This example shows a Gunicorn command for starting a Django app. |
| Java | java -jar /home/site/wwwroot/datadog-demo.jar | The command to start your app. This is not required for applications running in Tomcat. |
Note: The application restarts when new settings are saved.
Set General Settings
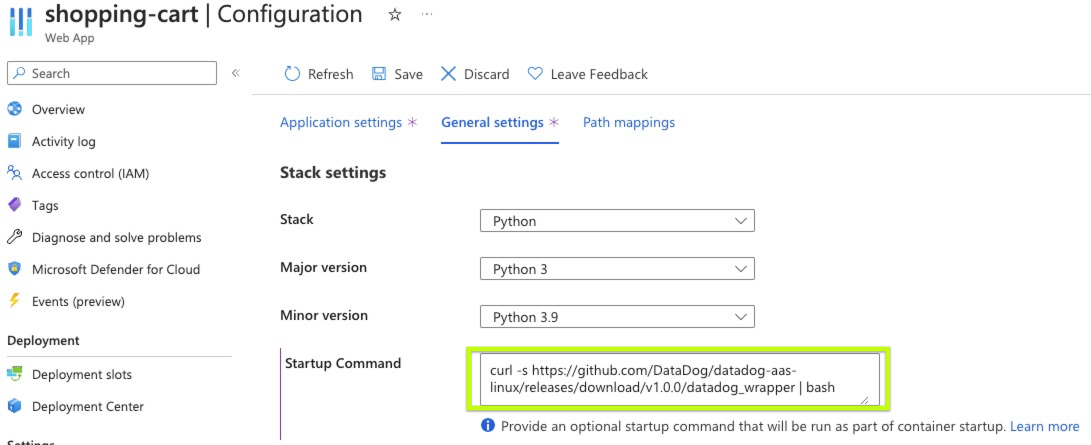
Go to General settings and add the following to the Startup Command field:
curl -s https://raw.githubusercontent.com/DataDog/datadog-aas-linux/v1.10.9/datadog_wrapper | bash
Download the datadog_wrapper file from the releases and upload it to your application with the Azure CLI command:
az webapp deploy --resource-group <group-name> --name <app-name> --src-path <path-to-datadog-wrapper> --type=startup
Viewing traces
When new Application Settings are saved, Azure restarts the application. However, if a startup command is added and saved, a restart may be required.
After the application restarts, you can view traces by searching for the service name (DD_SERVICE) in the APM Service page of Datadog.
Custom metrics
To enable custom metrics for your application with DogStatsD, add DD_CUSTOM_METRICS_ENABLED and set it as true in your Application Settings.
To configure your application to submit metrics, follow the appropriate steps for your runtime.
Deployment
To update your Datadog instrumentation with zero downtime, use deployment slots. You can create a workflow that uses GitHub Action for Azure CLI.
See the sample GitHub workflow.
Troubleshooting
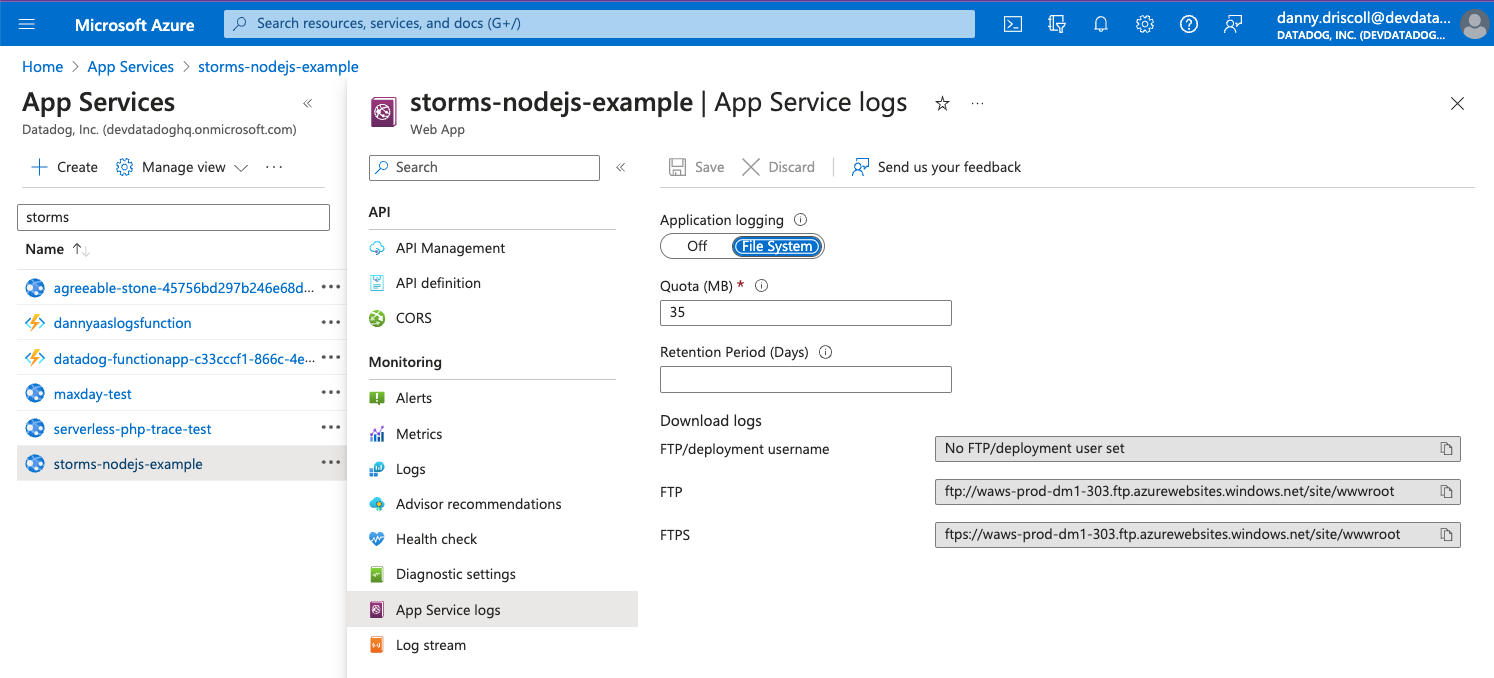
If you are not receiving traces or custom metric data as expected, enable App Service logs to receive debugging logs.
Share the content of the Log stream with Datadog Support.
Further reading
Additional helpful documentation, links, and articles:


