- Essentials
- Getting Started
- Datadog
- Datadog Site
- DevSecOps
- Serverless for AWS Lambda
- Agent
- Integrations
- Containers
- Dashboards
- Monitors
- Logs
- APM Tracing
- Profiler
- Tags
- API
- Service Catalog
- Session Replay
- Continuous Testing
- Synthetic Monitoring
- Incident Management
- Database Monitoring
- Cloud Security Management
- Cloud SIEM
- Application Security Management
- Workflow Automation
- CI Visibility
- Test Visibility
- Test Impact Analysis
- Code Analysis
- Learning Center
- Support
- Glossary
- Standard Attributes
- Guides
- Agent
- Integrations
- OpenTelemetry
- Developers
- Authorization
- DogStatsD
- Custom Checks
- Integrations
- Create an Agent-based Integration
- Create an API Integration
- Create a Log Pipeline
- Integration Assets Reference
- Build a Marketplace Offering
- Create a Tile
- Create an Integration Dashboard
- Create a Recommended Monitor
- Create a Cloud SIEM Detection Rule
- OAuth for Integrations
- Install Agent Integration Developer Tool
- Service Checks
- IDE Plugins
- Community
- Guides
- Administrator's Guide
- API
- Datadog Mobile App
- CoScreen
- Cloudcraft
- In The App
- Dashboards
- Notebooks
- DDSQL Editor
- Sheets
- Monitors and Alerting
- Infrastructure
- Metrics
- Watchdog
- Bits AI
- Service Catalog
- API Catalog
- Error Tracking
- Service Management
- Infrastructure
- Application Performance
- APM
- Continuous Profiler
- Database Monitoring
- Data Streams Monitoring
- Data Jobs Monitoring
- Digital Experience
- Real User Monitoring
- Product Analytics
- Synthetic Testing and Monitoring
- Continuous Testing
- Software Delivery
- CI Visibility
- CD Visibility
- Test Optimization
- Code Analysis
- Quality Gates
- DORA Metrics
- Security
- Security Overview
- Cloud SIEM
- Cloud Security Management
- Application Security Management
- AI Observability
- Log Management
- Observability Pipelines
- Log Management
- Administration
Automatic Faulty Deployment Detection
Overview
Automatic Faulty Deployment Detection finds faulty code deployments within minutes, reducing mean time to detection (MTTD). Whenever code is deployed, Watchdog compares the performance of the new code version with previous versions to spot new types of errors or increases in error rates introduced in a deployment. If Watchdog determines that a new deployment is faulty, details about the affected service appears on the APM service page, as well as the resource page of the affected endpoints.
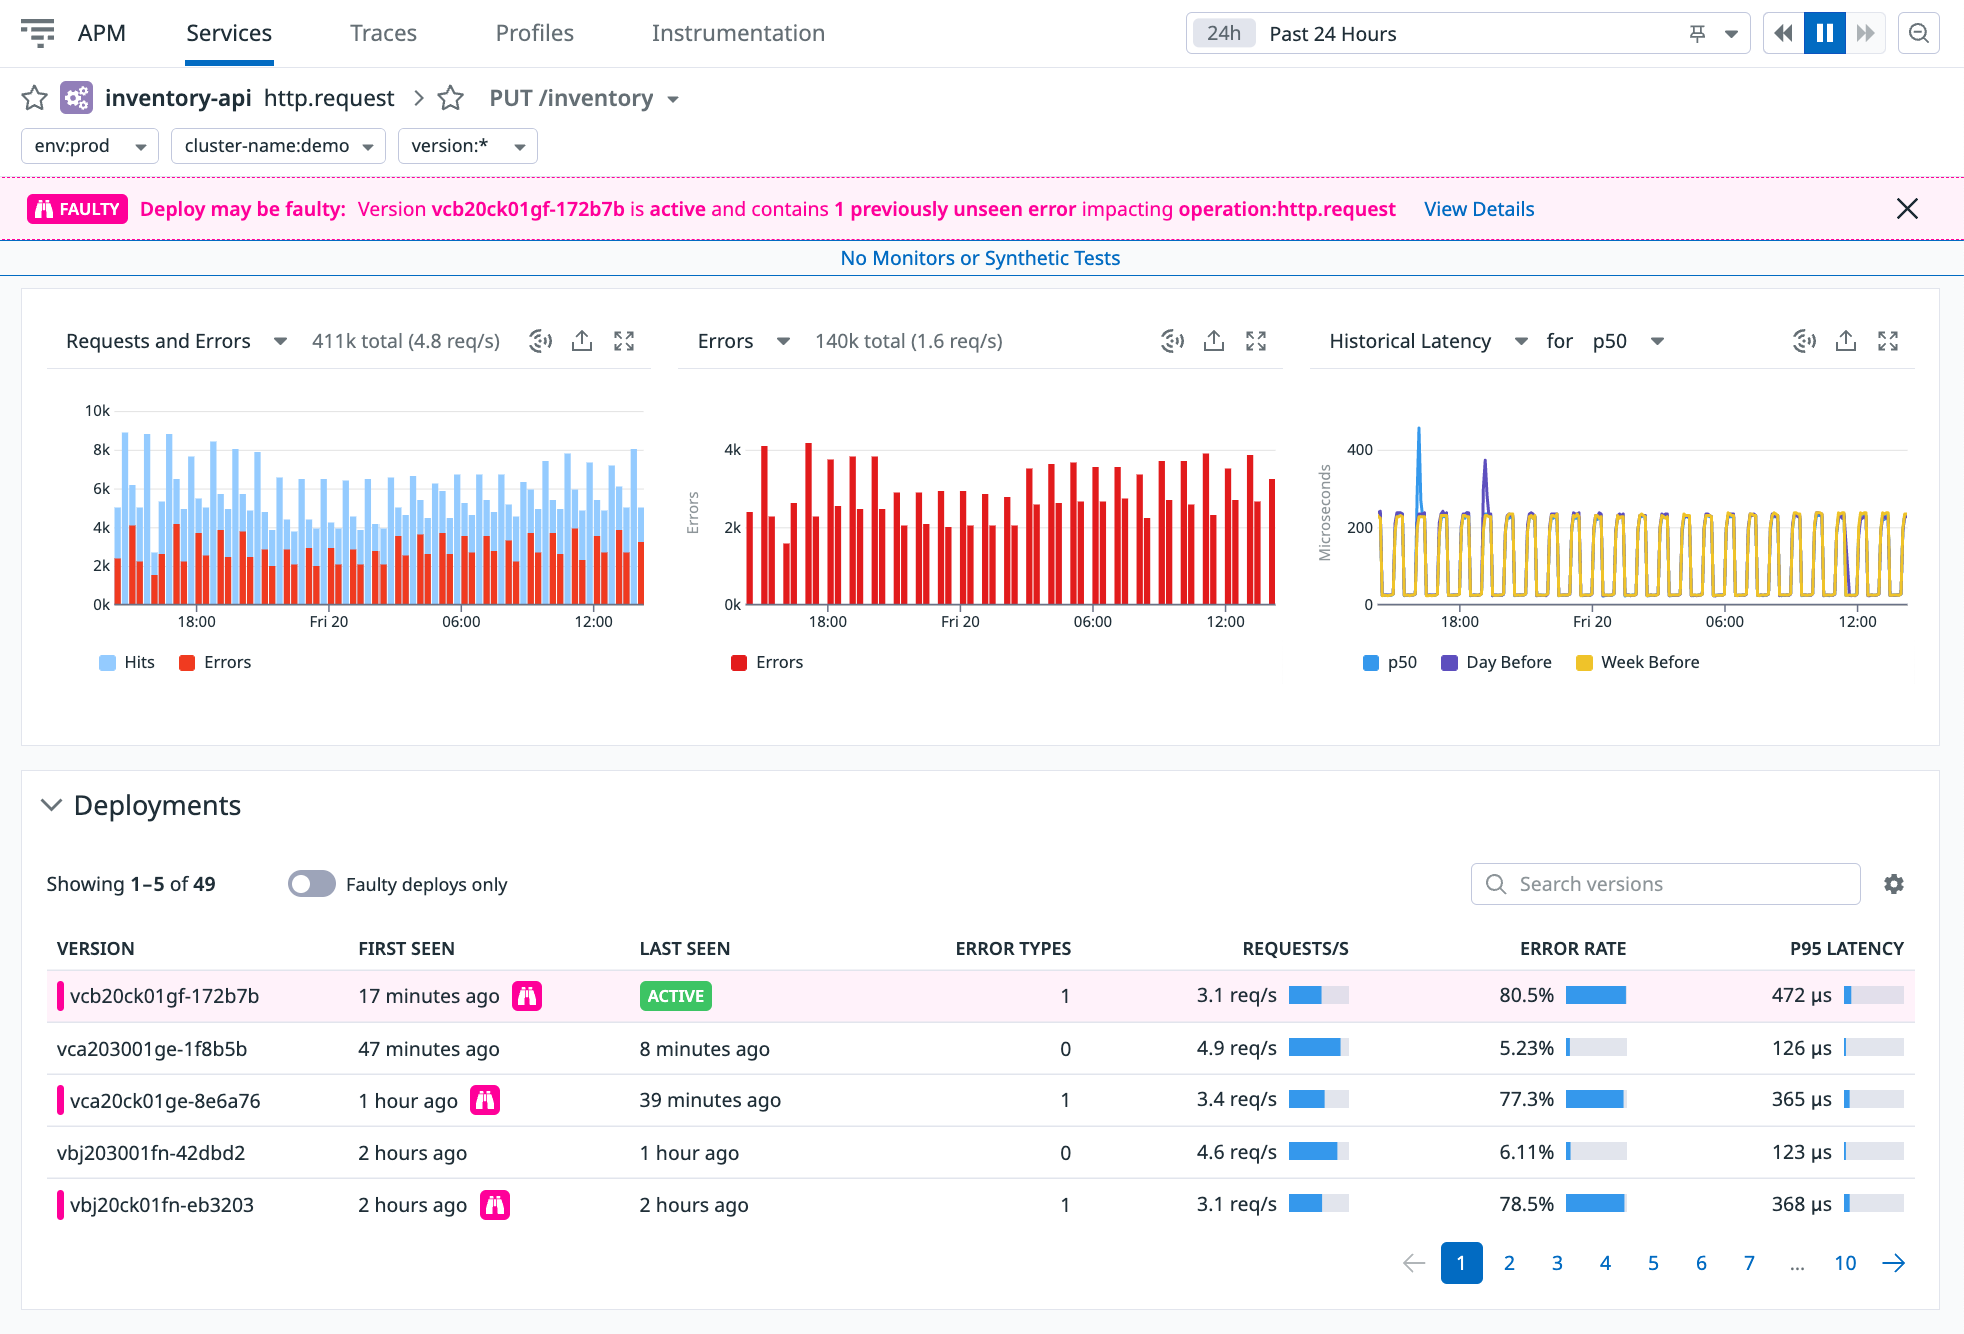
When Watchdog finds that a currently active version is faulty, this is indicated by a pink banner at the top of the service details page, as in the screenshot below. The Deployments table at the bottom of the screen, which presents a history of deployments for the service, also indicates which versions Watchdog found to be faulty in the past.
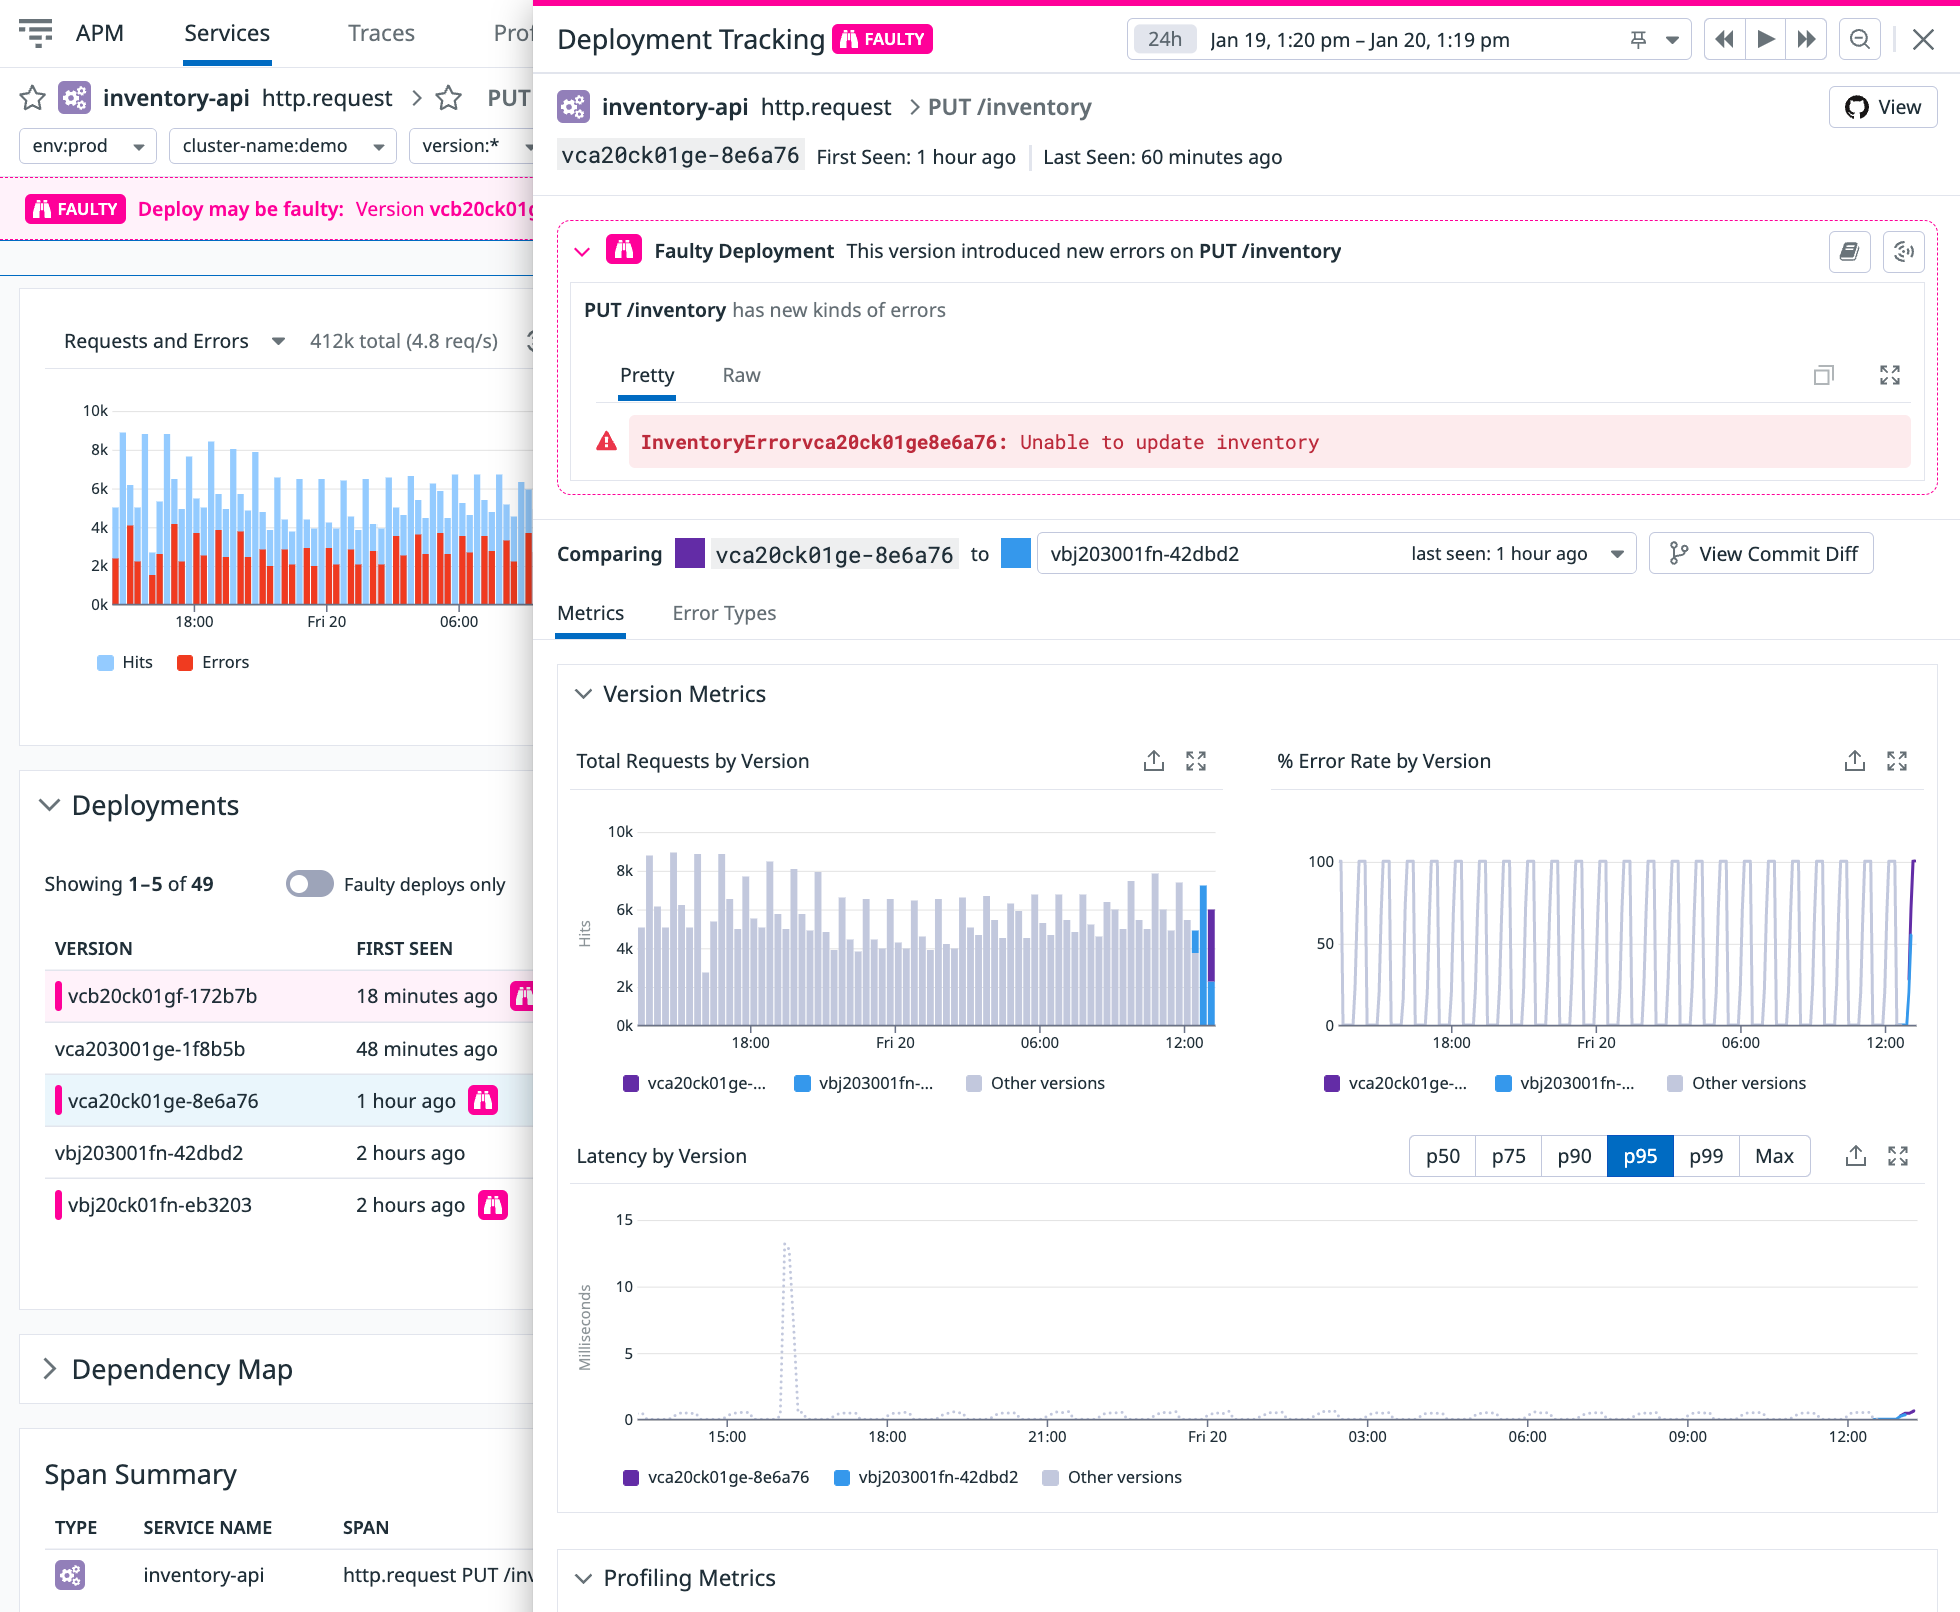
Click View Details in the banner to open a slide-out panel with additional information about the faulty deployment. This view provides details about the faulty deployment, which can include the following:
- Graphs of error rate increases
- The error type of newly detected errors
- The affected endpoint
- The HTTP status code
This view can also be accessed by clicking on any version in the Deployments table. The screenshot below gives an example of this detailed view, in which the error type db.utils.OperationalError is affecting the /inventory endpoint, resulting in HTTP status code (500).
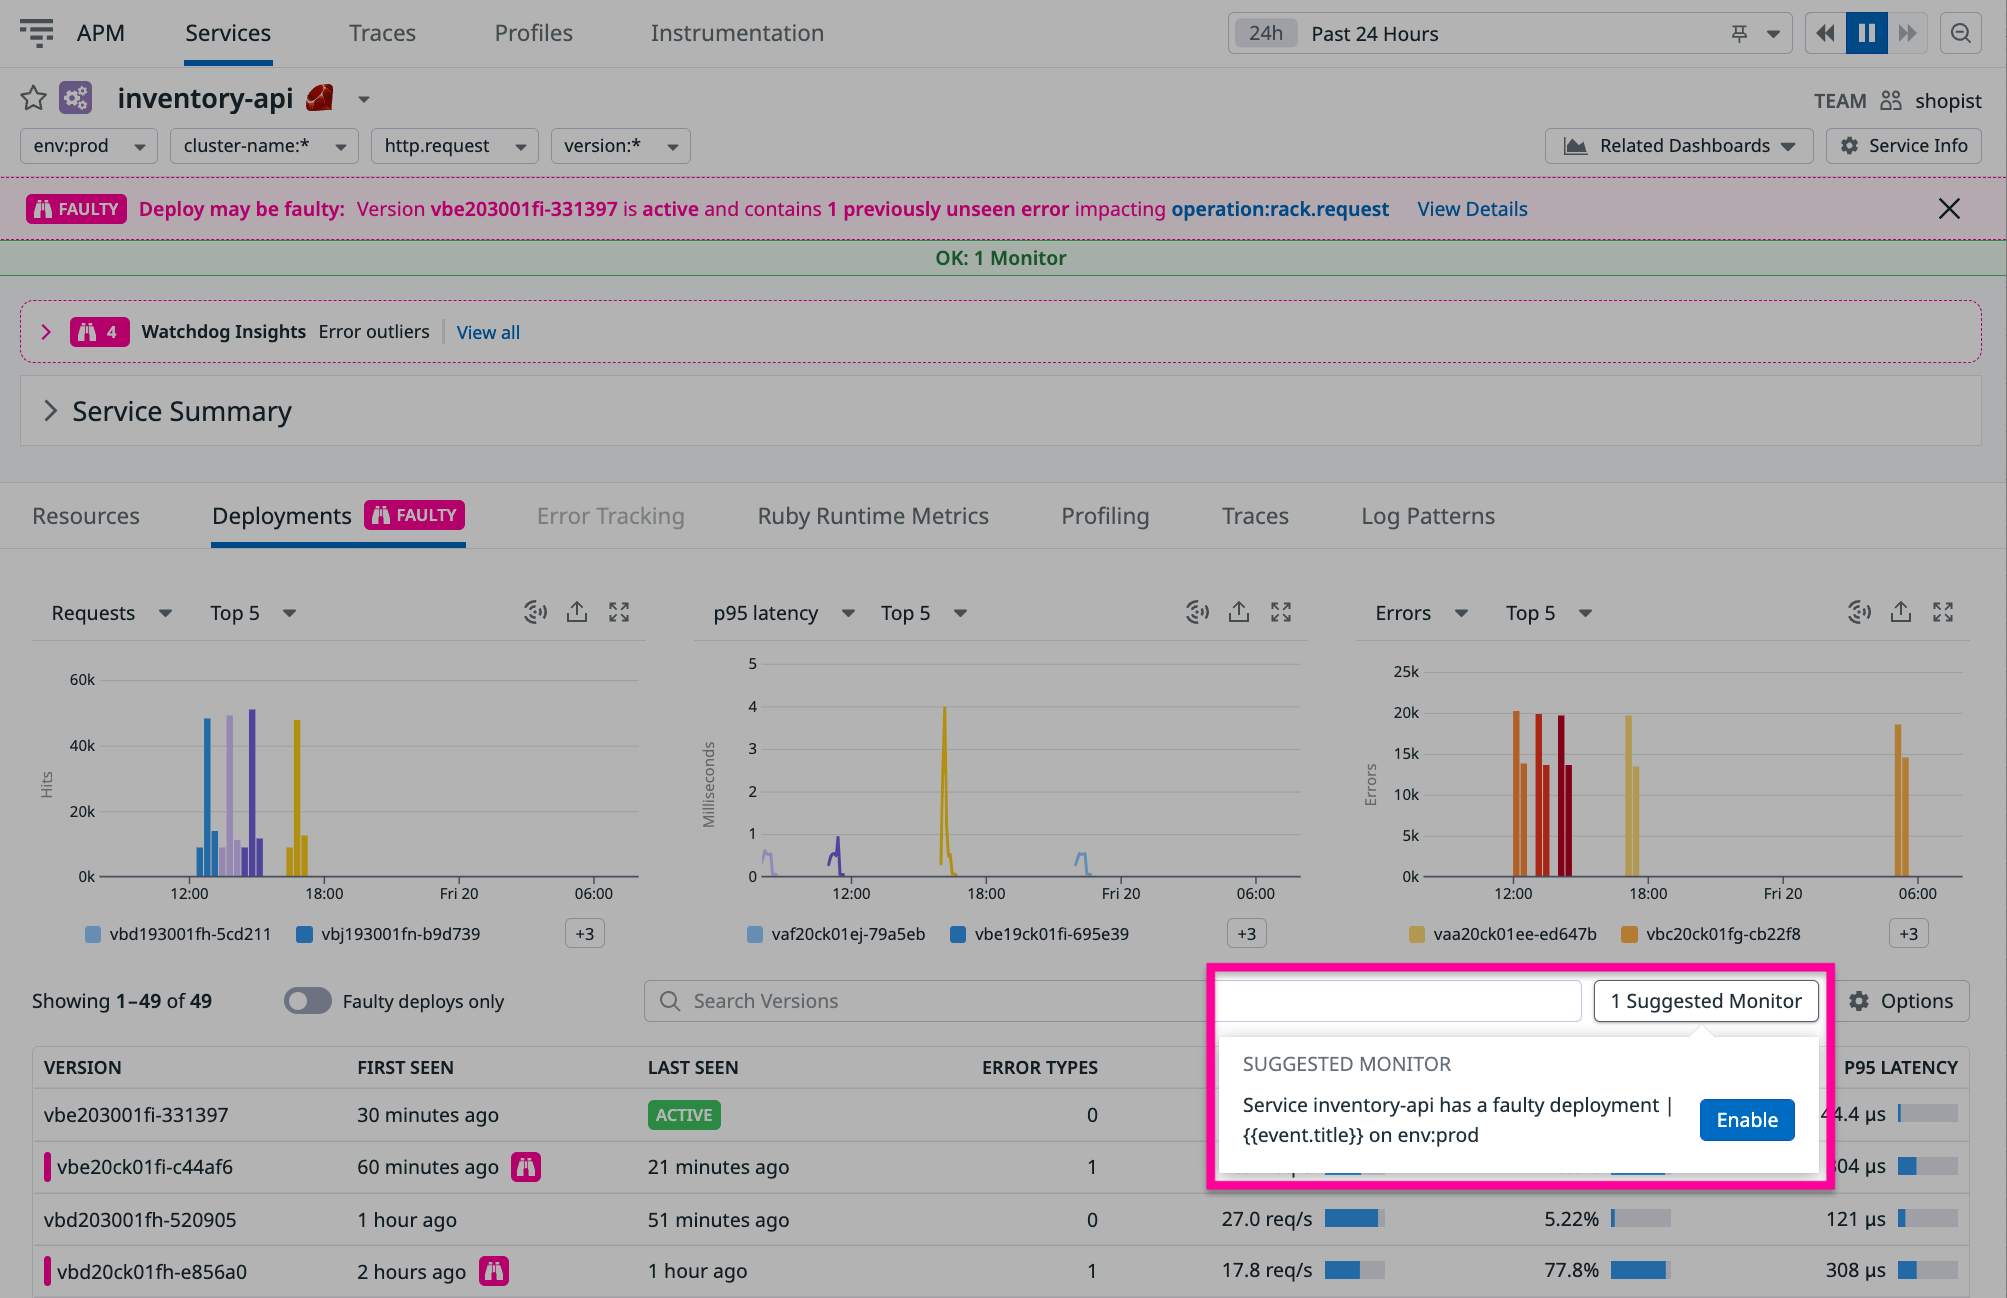
Whenever a faulty deployment is detected, Watchdog adds this as an event in the Event Explorer. You can set up a monitor to get automatically notified on such events. To do so, navigate to the New Monitors page and choose Events, and include tags:deployment_analysis in the search query defining the monitor.
You can also enable the monitor by clicking the Suggested Monitors button, and then Enable. The Suggested Monitors button is only available if the service does not yet have a monitor configured. If the button is not available, follow the instruction above to create the monitor from the New Monitors page.
Each deployment is repeatedly analyzed. To prevent re-alerting of the same faulty deployment, Datadog recommends setting a recovery time of 60 min for the monitor.
Why did a new deployment not get flagged as faulty, despite having errors?
Watchdog attempts to determine if the new deployment is a plausible cause of the errors. It may determine that this is not the case, due to any combination of the following reasons:
- Errors of this type do not appear to be new; they appear either in preceding versions or during recent deployments.
- Errors of this type are few and transient, disappearing over time even as the new version remains in place.
- There were not enough previous deployments in the recent history for Watchdog to establish a baseline for the analysis.
- The error rate in the new version was not significantly higher than in preceding versions.
- This error pattern is common during deployments of the service, even when the new code version is not faulty.


