- Essentials
- Getting Started
- Datadog
- Datadog Site
- DevSecOps
- Serverless for AWS Lambda
- Agent
- Integrations
- Containers
- Dashboards
- Monitors
- Logs
- APM Tracing
- Profiler
- Tags
- API
- Service Catalog
- Session Replay
- Continuous Testing
- Synthetic Monitoring
- Incident Management
- Database Monitoring
- Cloud Security Management
- Cloud SIEM
- Application Security Management
- Workflow Automation
- CI Visibility
- Test Visibility
- Intelligent Test Runner
- Code Analysis
- Learning Center
- Support
- Glossary
- Standard Attributes
- Guides
- Agent
- Integrations
- OpenTelemetry
- Developers
- Authorization
- DogStatsD
- Custom Checks
- Integrations
- Create an Agent-based Integration
- Create an API Integration
- Create a Log Pipeline
- Integration Assets Reference
- Build a Marketplace Offering
- Create a Tile
- Create an Integration Dashboard
- Create a Recommended Monitor
- Create a Cloud SIEM Detection Rule
- OAuth for Integrations
- Install Agent Integration Developer Tool
- Service Checks
- IDE Plugins
- Community
- Guides
- API
- Datadog Mobile App
- CoScreen
- Cloudcraft
- In The App
- Dashboards
- Notebooks
- DDSQL Editor
- Monitors and Alerting
- Infrastructure
- Metrics
- Watchdog
- Bits AI
- Service Catalog
- API Catalog
- Error Tracking
- Service Management
- Infrastructure
- Application Performance
- APM
- Continuous Profiler
- Database Monitoring
- Data Streams Monitoring
- Data Jobs Monitoring
- Digital Experience
- Real User Monitoring
- Product Analytics
- Synthetic Testing and Monitoring
- Continuous Testing
- Software Delivery
- CI Visibility
- CD Visibility
- Test Visibility
- Intelligent Test Runner
- Code Analysis
- Quality Gates
- DORA Metrics
- Security
- Security Overview
- Cloud SIEM
- Cloud Security Management
- Application Security Management
- AI Observability
- Log Management
- Observability Pipelines
- Log Management
- Administration
Set up Tracing on a Buildkite Pipeline
CI Visibility is not available in the selected site () at this time.
Overview
Buildkite is a continuous integration and deployment platform that allows you to run builds on your own infrastructure, providing you with full control over security and customizing your build environment while managing orchestration in the cloud.
Set up tracing on Buildkite to optimize your resource usage, reduce overhead, and improve the speed and quality of your software development lifecycle.
Compatibility
| Pipeline Visibility | Platform | Definition |
|---|---|---|
| Partial retries | Partial pipelines | View partially retried pipeline executions. |
| Infrastructure metric correlation | Infrastructure metric correlation | Correlate jobs to infrastructure host metrics for Buildkite agents. |
| Manual steps | Manual steps | View manually triggered pipelines. |
| Queue time | Queue time | View the amount of time pipeline jobs sit in the queue before processing. |
| Custom tags and measures at runtime | Custom tags and measures at runtime | Configure custom tags and measures at runtime. |
| Custom spans | Custom spans | Configure custom spans for your pipelines. |
Configure the Datadog integration
To set up the Datadog integration for Buildkite:
- Go to Settings > Notification Services in Buildkite and click the Add button next to Datadog Pipeline Visibility.
- Fill in the form with the following information:
- Description: A description to help identify the integration in the future, such as
Datadog CI Visibility integration. - API key: Your Datadog API Key.
- Datadog site:
- Pipelines: Select all pipelines or the subset of pipelines you want to trace.
- Branch filtering: Leave empty to trace all branches or select the subset of branches you want to trace.
- Description: A description to help identify the integration in the future, such as
- Click Add Datadog Pipeline Visibility Notification to save the integration.
Advanced configuration
Set custom tags
Custom tags can be added to Buildkite traces by using the buildkite-agent meta-data set command.
Any metadata tags with a key starting with dd_tags. are added to the job and pipeline spans. These
tags can be used to create string facets to search and organize the pipelines.
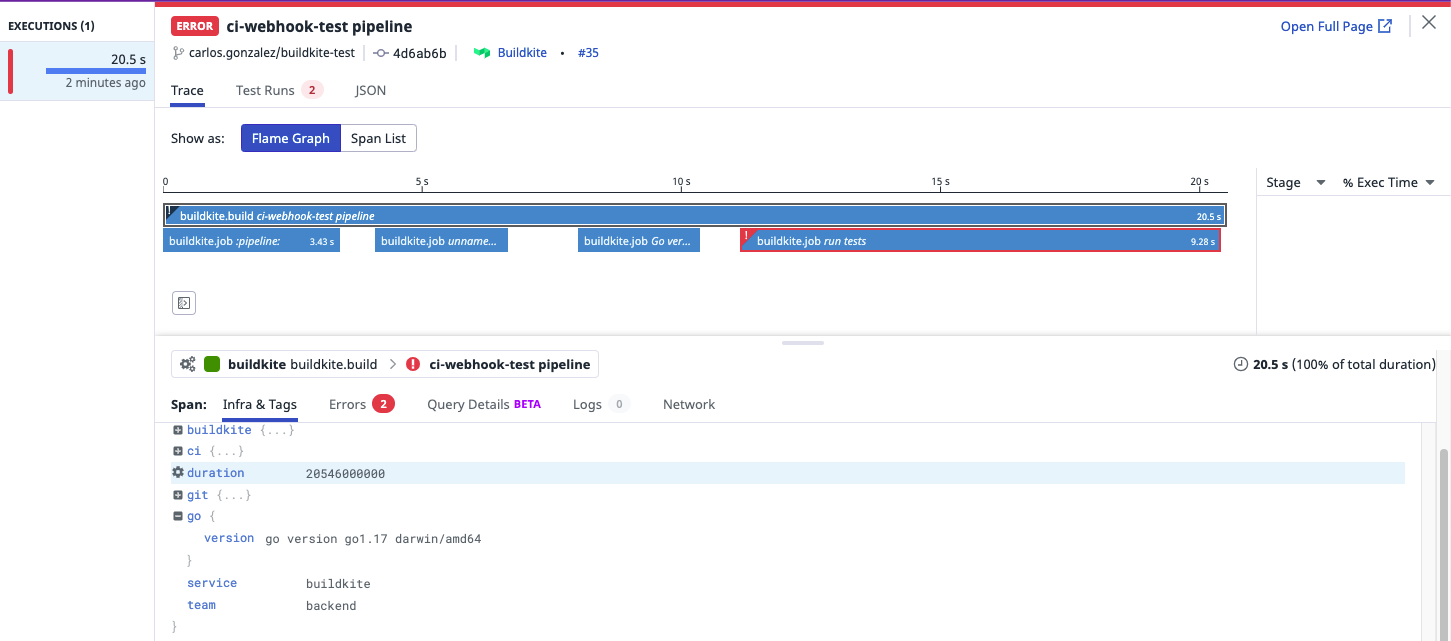
The YAML below illustrates a simple pipeline where tags for the team name and the Go version have been set.
steps:
  - command: buildkite-agent meta-data set "dd_tags.team" "backend"
  - command: go version | buildkite-agent meta-data set "dd_tags.go.version"
    label: Go version
  - commands: go test ./...
    label: Run tests
The following tags are shown in the root span as well as the relevant job span in Datadog.
team: backendgo.version: go version go1.17 darwin/amd64(output depends on the runner)
The resulting pipeline looks like the following:
Any metadata with a key starting with dd-measures. and containing a numerical value will be set as
a metric tag that can be used to create numerical measures.
You can use the buildkite-agent meta-data set command to create these tags.
For example, you can measure the binary size in a pipeline with this command:
steps:
  - commands:
    - go build -o dst/binary .
    - ls -l dst/binary | awk '{print \$5}' | tr -d '\n' | buildkite-agent meta-data set "dd_measures.binary_size"
    label: Go build
The resulting pipeline will have the tags shown below in the pipeline span:
binary_size: 502(output depends on the file size)
In this example, you can use the value of binary_size to plot the change in the binary size over time.
Correlate infrastructure metrics to jobs
If you are using Buildkite agents, you can correlate jobs with the infrastructure that is running them. For this feature to work, install the Datadog Agent in the hosts running the Buildkite agents.
View partial and downstream pipelines
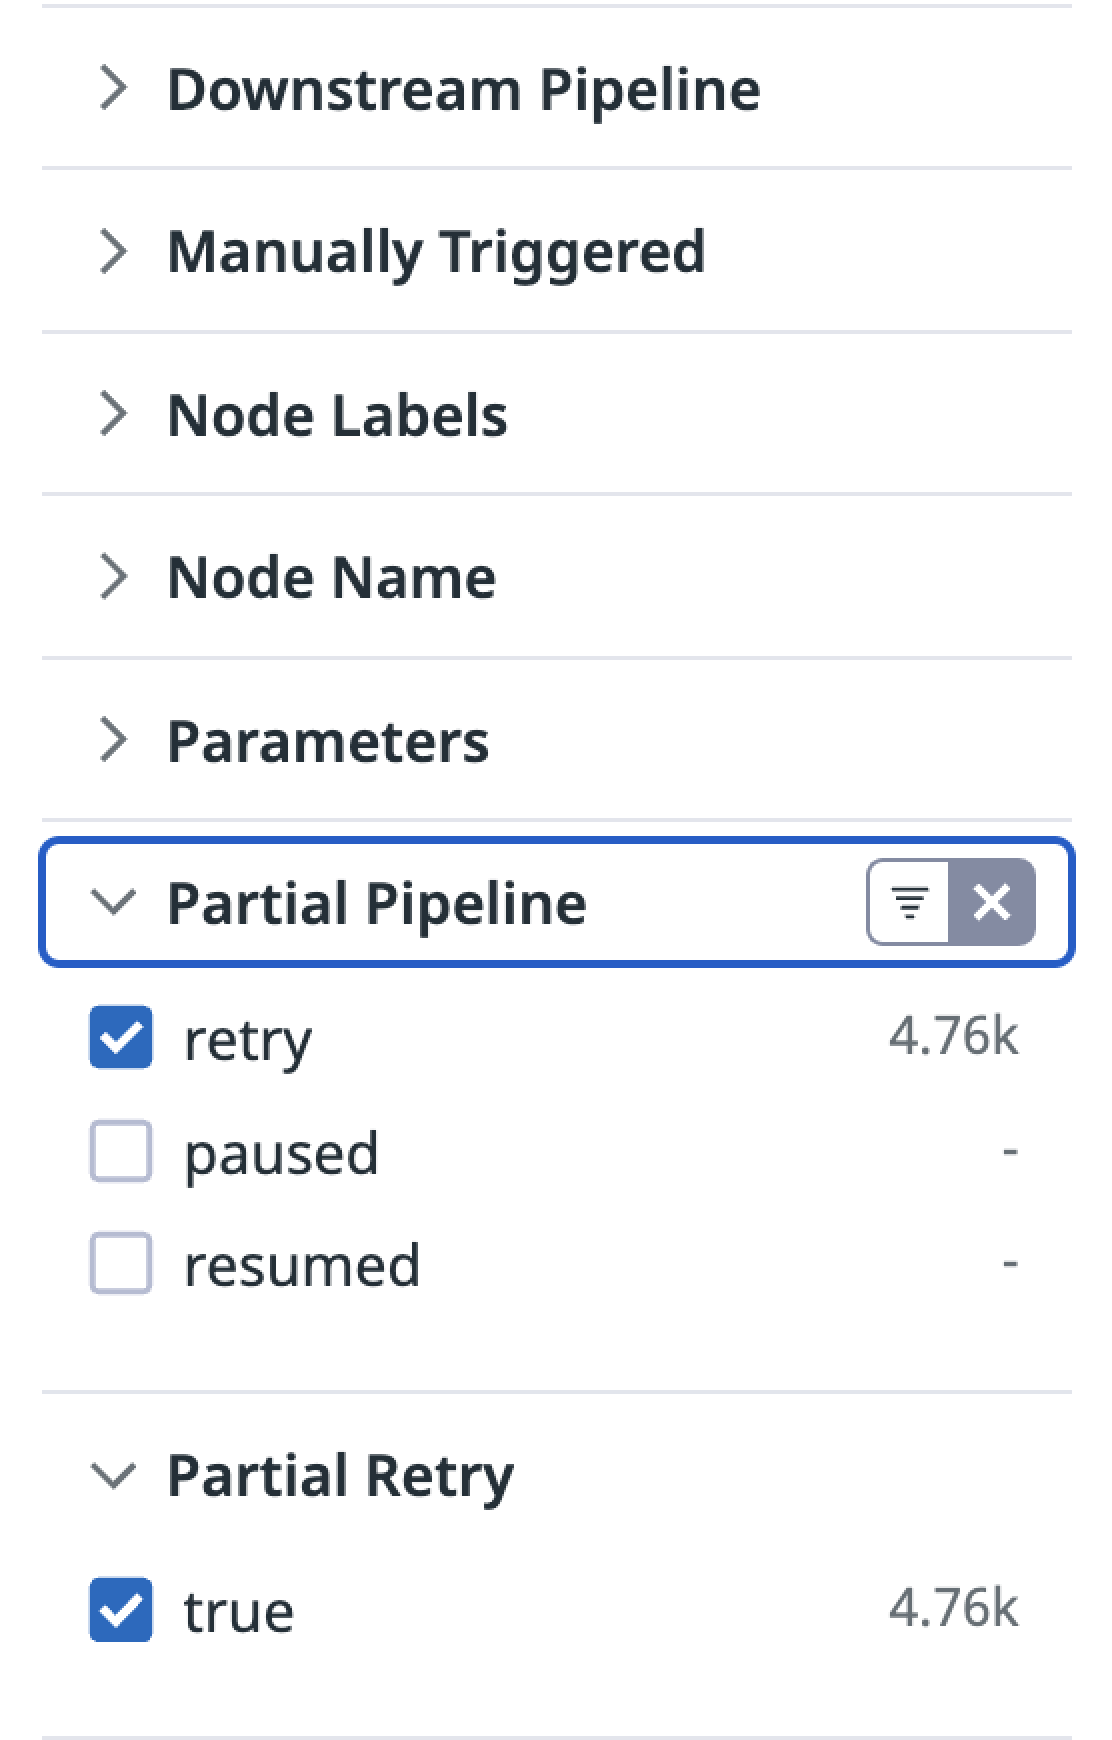
You can use the following filters to customize your search query in the CI Visibility Explorer.
| Facet Name | Facet ID | Possible Values |
|---|---|---|
| Downstream Pipeline | @ci.pipeline.downstream | true, false |
| Manually Triggered | @ci.is_manual | true, false |
| Partial Pipeline | @ci.partial_pipeline | retry, paused, resumed |
You can also apply these filters using the facet panel on the left hand side of the page.
Visualize pipeline data in Datadog
The CI Pipeline List and Executions pages populate with data after the pipelines finish.
The CI Pipeline List page shows data for only the default branch of each repository. For more information, see Search and Manage CI Pipelines.
Further reading
Additional helpful documentation, links, and articles:


