.NET uses auto-instrumentation to inject and extract additional metadata required by Data Streams Monitoring for measuring end-to-end latencies and the relationship between queues and services. To enable Data Streams Monitoring, set the DD_DATA_STREAMS_ENABLED environment variable to true on services sending messages to (or consuming messages from) Kafka or RabbitMQ.
Data Streams Monitoring uses message headers to propagate context through Kafka streams. If log.message.format.version is set in the Kafka broker configuration, it must be set to 0.11.0.0 or higher. Data Streams Monitoring is not supported for versions lower than this.
Monitoring SQS pipelines
Data Streams Monitoring uses one message attribute to track a message’s path through an SQS queue. As Amazon SQS has a maximum limit of 10 message attributes allowed per message, all messages streamed through the data pipelines must have 9 or fewer message attributes set, allowing the remaining attribute for Data Streams Monitoring.
Monitoring RabbitMQ pipelines
The RabbitMQ integration can provide detailed monitoring and metrics of your RabbitMQ deployments. For full compatibility with Data Streams Monitoring, Datadog recommends configuring the integration as follows:
Setting up Data Streams Monitoring for Azure Service Bus applications requires additional configuration for the instrumented application.
Either set the environment variable AZURE_EXPERIMENTAL_ENABLE_ACTIVITY_SOURCE to true, or in your application code set the Azure.Experimental.EnableActivitySource context switch to true. This instructs the Azure Service Bus library to generate tracing information. See Azure SDK documentation for more details.
Set the DD_TRACE_OTEL_ENABLED environment variable to true. This instructs the .NET auto-instrumentation to listen to the tracing information generated by the Azure Service Bus Library and enables the inject and extract operations required for Data Streams Monitoring.
Monitoring connectors
Confluent Cloud connectors
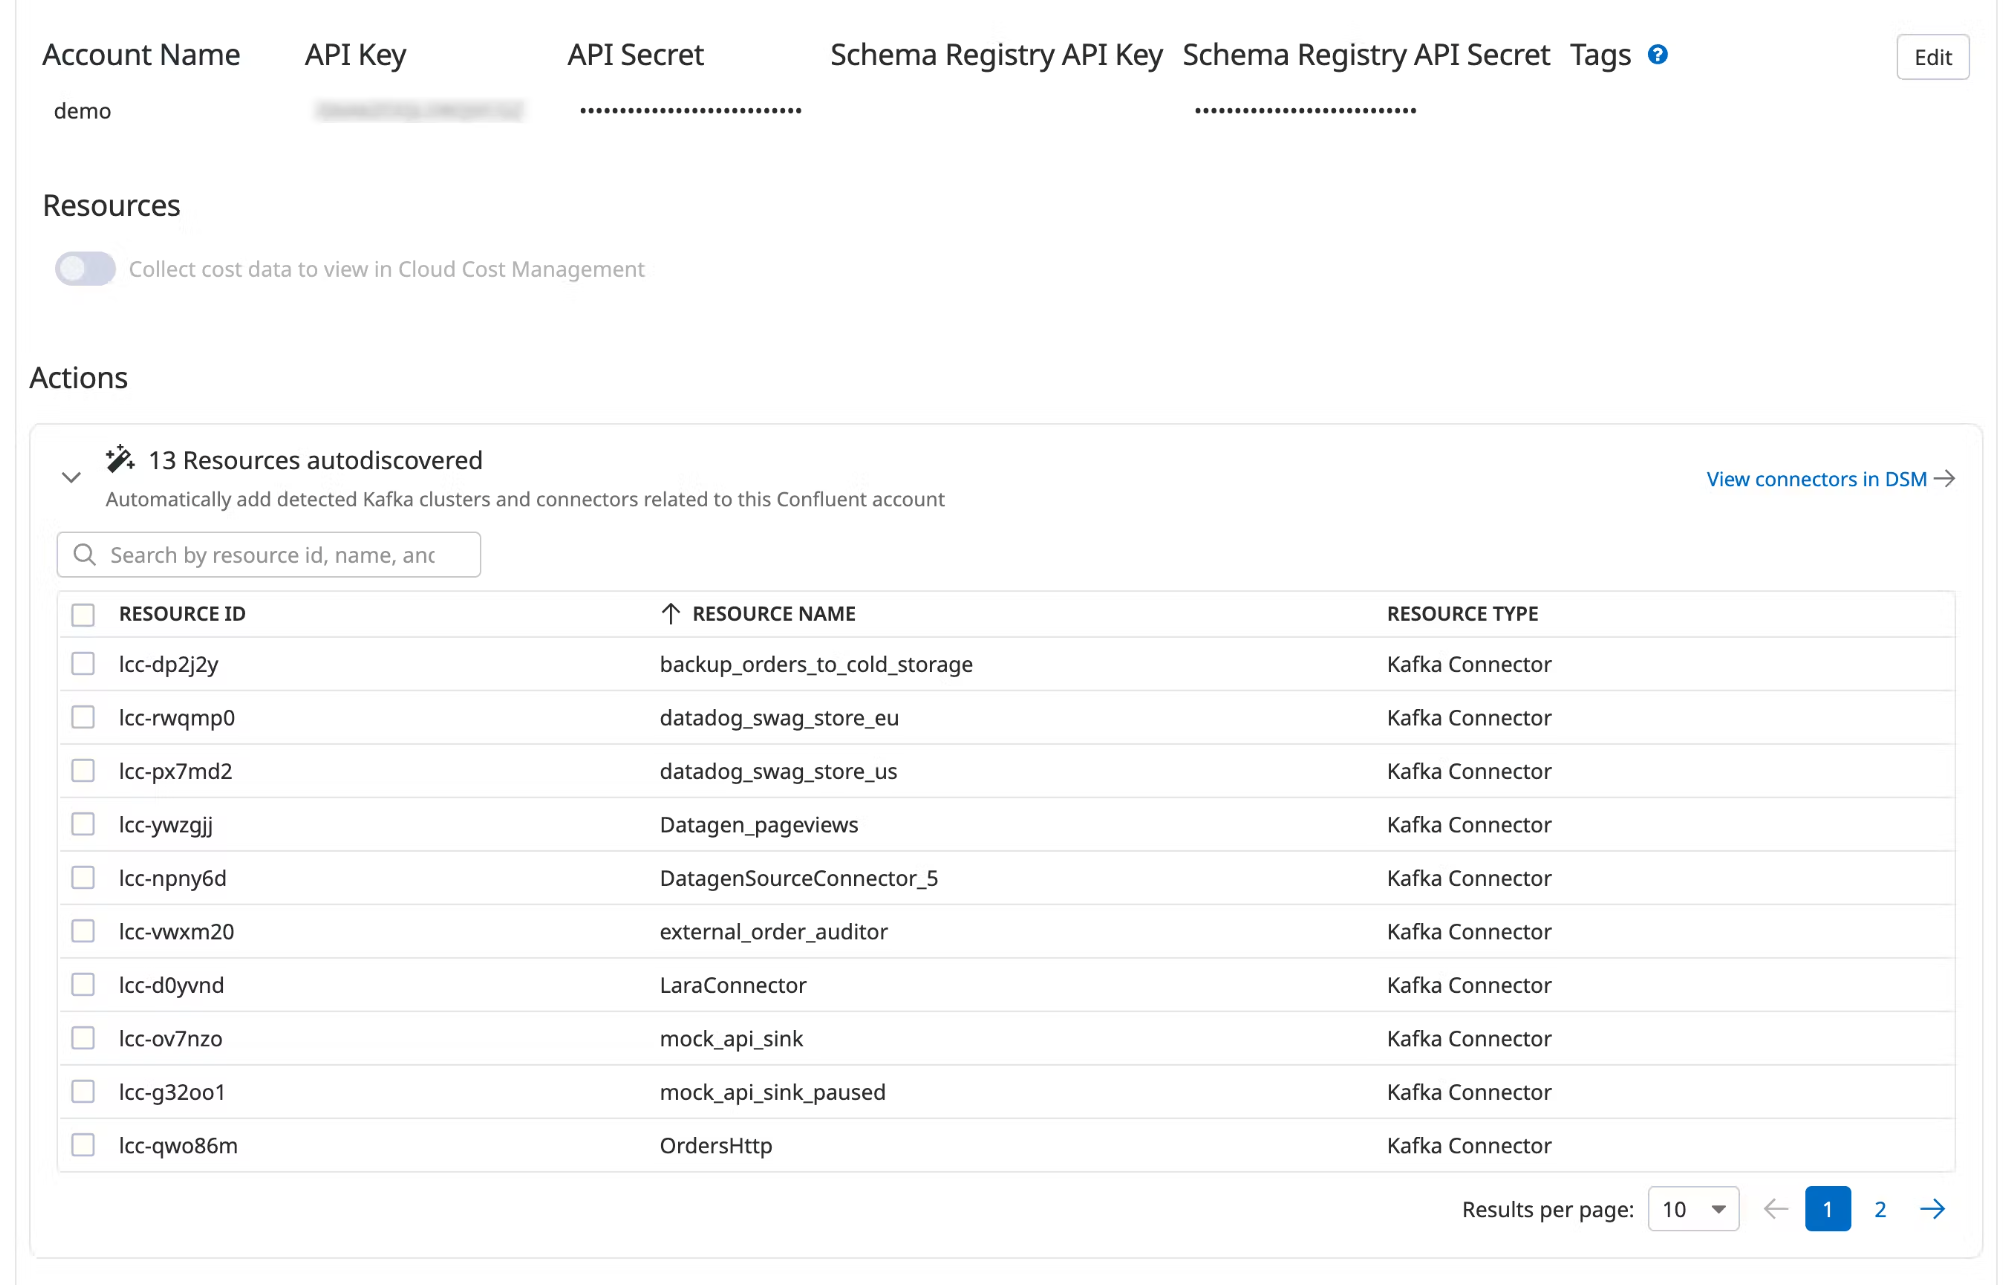
Data Streams Monitoring can automatically discover your Confluent Cloud connectors and visualize them within the context of your end-to-end streaming data pipeline.
Under Actions, a list of resources populates with detected clusters and connectors. Datadog attempts to discover new connectors every time you view this integration tile.
Select the resources you want to add.
Click Add Resources.
Navigate to Data Streams Monitoring to visualize the connectors and track connector status and throughput.
Further reading
Additional helpful documentation, links, and articles: