Note: This documentation uses v2 of the Go tracer, which Datadog recommends for all users. If you are using v1, see the migration guide to upgrade to v2.
Data Streams Monitoring has not been changed between v1 and v2 of the tracer.
Data Streams Monitoring uses message headers to propagate context through Kafka streams. If log.message.format.version is set in the Kafka broker configuration, it must be set to 0.11.0.0 or higher. Data Streams Monitoring is not supported for versions lower than this.
Monitoring RabbitMQ pipelines
The RabbitMQ integration can provide detailed monitoring and metrics of your RabbitMQ deployments. For full compatibility with Data Streams Monitoring, Datadog recommends configuring the integration as follows:
Set the DD_DATA_STREAMS_ENABLED=true environment variable
Manual instrumentation
Sarama Kafka client
To manually instrument the Sarama Kafka client with Data Streams Monitoring:
Import the ddsarama go library
import(ddsarama"github.com/DataDog/dd-trace-go/contrib/Shopify/sarama/v2")2.Wraptheproducerwith`ddsarama.WrapAsyncProducer`...config:=sarama.NewConfig()producer,err:=sarama.NewAsyncProducer([]string{bootStrapServers},config)// ADD THIS LINE
producer=ddsarama.WrapAsyncProducer(config,producer,ddsarama.WithDataStreams())
Confluent Kafka client
To manually instrument Confluent Kafka with Data Streams Monitoring:
Wrap the producer creation with ddkafka.NewProducer and use the ddkafka.WithDataStreams() configuration
// CREATE PRODUCER WITH THIS WRAPPER
producer,err:=ddkafka.NewProducer(&kafka.ConfigMap{"bootstrap.servers":bootStrapServers,},ddkafka.WithDataStreams())
If a service consumes data from one point and produces to another point, propagate context between the two places using the Go context structure:
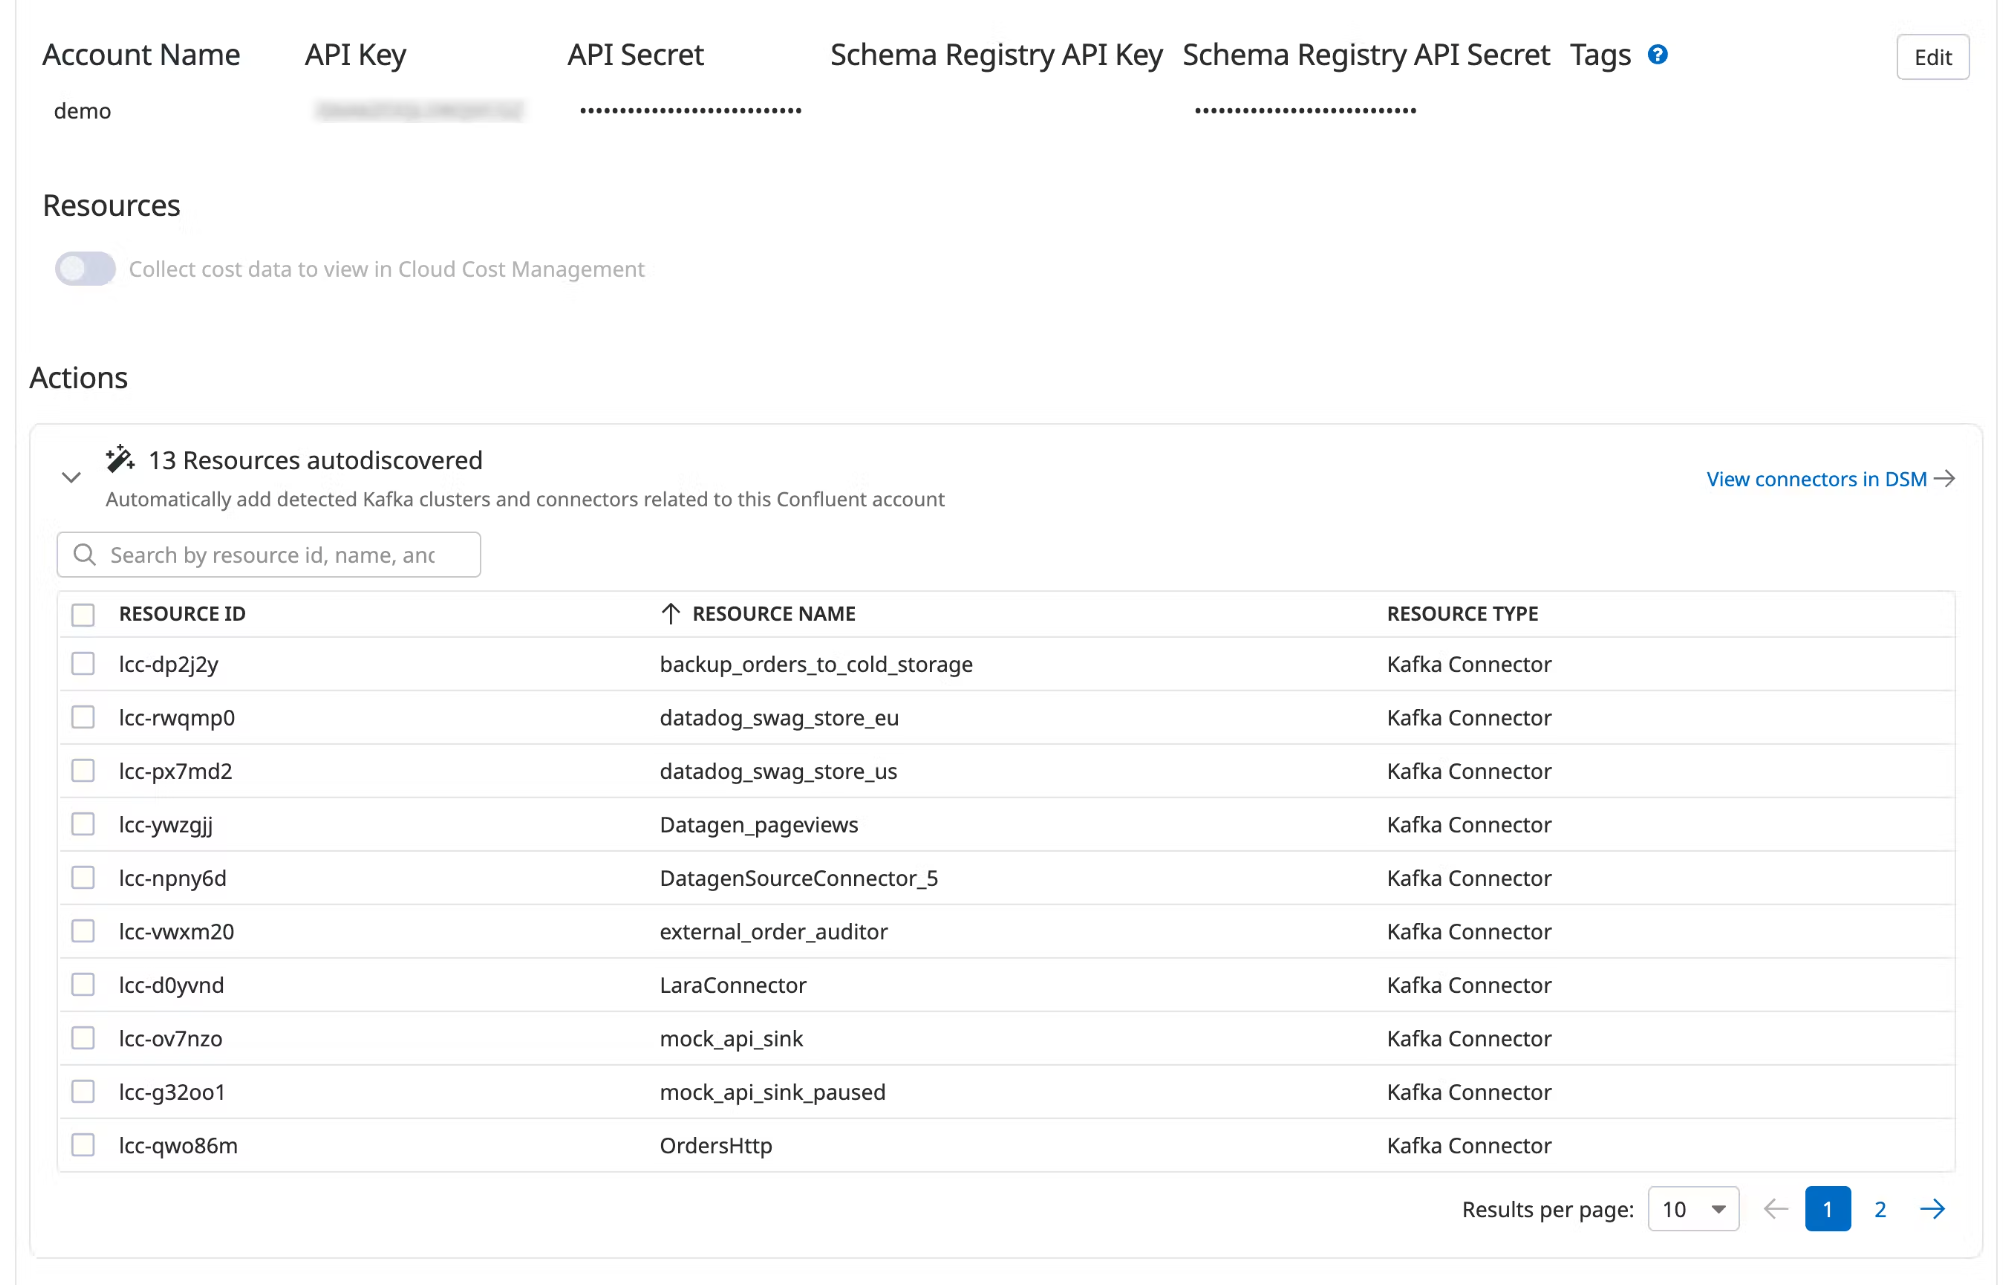
Data Streams Monitoring can automatically discover your Confluent Cloud connectors and visualize them within the context of your end-to-end streaming data pipeline.
Under Actions, a list of resources populates with detected clusters and connectors. Datadog attempts to discover new connectors every time you view this integration tile.
Select the resources you want to add.
Click Add Resources.
Navigate to Data Streams Monitoring to visualize the connectors and track connector status and throughput.
Further reading
Additional helpful documentation, links, and articles: