Supported OS
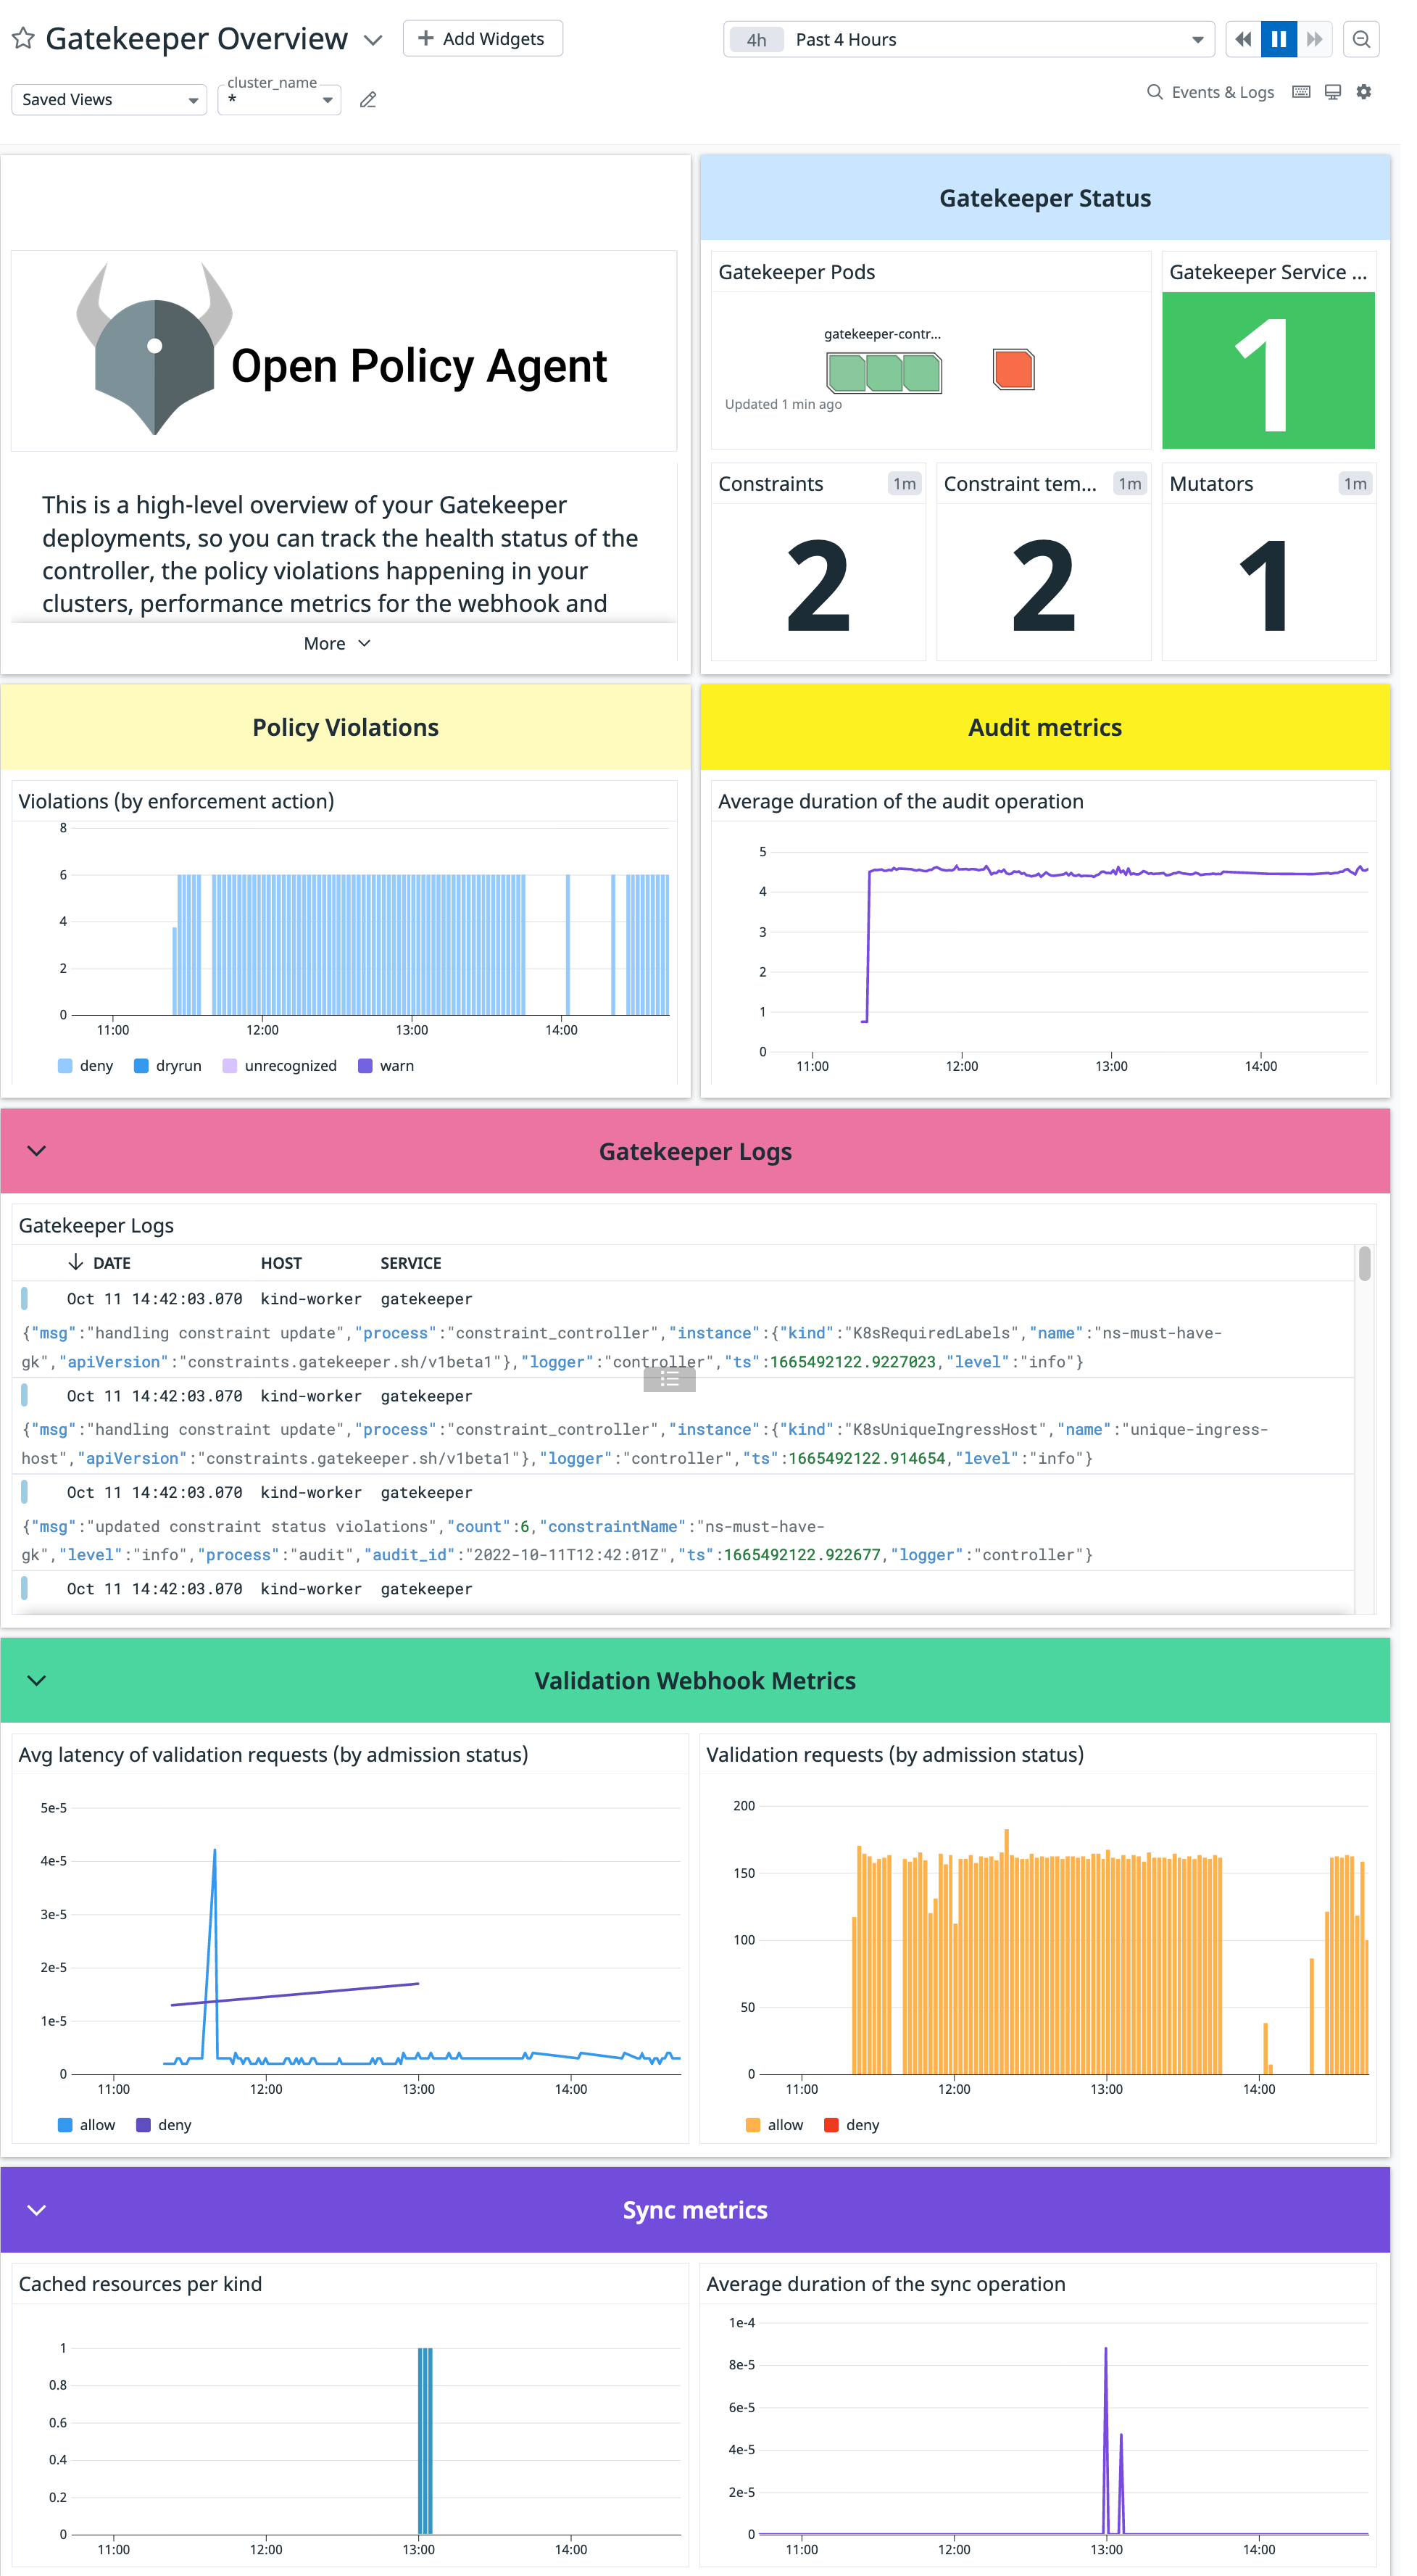
Agent Check: gatekeeper Overview This check collects metrics from OPA Gatekeeper .
Setup Follow the instructions below to install and configure this check for an Agent running on a Kubernetes cluster. See also the Autodiscovery Integration Templates for guidance on applying these instructions.
Installation Agent versions >=7.26.0 or >=6.26.0 To use an integration from integrations-extra with the Docker Agent, Datadog recommends building the Agent with the integration installed. Use the following Dockerfile to build an updated version of the Agent that includes the gatekeeper integration from integrations-extras:
FROM gcr.io/datadoghq/agent:latest
RUN agent integration install -r -t datadog-gatekeeper==<INTEGRATION_VERSION>
Agent versions <7.26.0 or <6.26.0 To install the gatekeeper check on your Kubernetes cluster:
Install the developer toolkit .
Clone the integrations-extras repository:
git clone https://github.com/DataDog/integrations-extras.git.
Update your ddev config with the integrations-extras/ path:
ddev config set repos.extras ./integrations-extras
To build the gatekeeper package, run:
ddev -e release build gatekeeper
Download the Agent manifest to install the Datadog Agent as a DaemonSet .
Create two PersistentVolumeClaims, one for the checks code, and one for the configuration.
Add them as volumes to your Agent pod template and use them for your checks and configuration:
env :
- name : DD_CONFD_PATH
value : "/confd"
- name : DD_ADDITIONAL_CHECKSD
value : "/checksd"
[ ...]
volumeMounts :
- name : agent-code-storage
mountPath : /checksd
- name : agent-conf-storage
mountPath : /confd
[ ...]
volumes :
- name : agent-code-storage
persistentVolumeClaim :
claimName : agent-code-claim
- name : agent-conf-storage
persistentVolumeClaim :
claimName : agent-conf-claim
Deploy the Datadog Agent in your Kubernetes cluster:
kubectl apply -f agent.yaml
Copy the integration artifact .whl file to your Kubernetes nodes or upload it to a public URL
Run the following command to install the integrations wheel with the Agent:
kubectl exec ds/datadog -- agent integration install -w <PATH_OF_GATEKEEPER_ARTIFACT_>/<GATEKEEPER_ARTIFACT_NAME>.whl
Run the following commands to copy the checks and configuration to the corresponding PVCs:
kubectl exec ds/datadog -- sh
# cp -R /opt/datadog-agent/embedded/lib/python3.8/site-packages/datadog_checks/* /checksd
# cp -R /etc/datadog-agent/conf.d/* /confd
Restart the Datadog Agent pods.
Configuration Edit the gatekeeper/conf.yaml file, in the /confd folder that you added to the Agent pod to start collecting your gatekeeper performance data. See the sample gatekeeper/conf.yaml for all available configuration options.
Restart the Agent .
Validation Run the Agent’s status subcommand and look for gatekeeper under the Checks section.
Data Collected Metrics gatekeeper.audit.duration.seconds.sum Latency of audit operation in secondsShown as second gatekeeper.audit.duration.seconds.count Latency of audit operation in secondsShown as second gatekeeper.audit.last_run_time Timestamp of last audit operation gatekeeper.constraint_template_ingestion.duration.seconds.sum Distribution of how long it took to ingest a constraint template in secondsShown as second gatekeeper.constraint_template_ingestion.duration.seconds.count Distribution of how long it took to ingest a constraint template in secondsShown as second gatekeeper.constraint_template_ingestion.count Total number of constraint template ingestion actions gatekeeper.violations Total number of violations per constraint gatekeeper.constraints Current number of known constraints gatekeeper.constraint_templates Number of observed constraint templates gatekeeper.request.duration.seconds.sum [Deprecated since Gatekeeper v3.4.0] The response time in secondsShown as second gatekeeper.request.duration.seconds.count [Deprecated since Gatekeeper v3.4.0] The response time in secondsShown as second gatekeeper.request.count [Deprecated since Gatekeeper v3.4.0] Total number of requests that are routed to webhook gatekeeper.sync Total number of resources of each kind being cached gatekeeper.sync.duration.seconds.sum Latency of sync operation in secondsShown as second gatekeeper.sync.duration.seconds.count Latency of sync operation in secondsShown as second gatekeeper.sync.last_run_time Timestamp of last sync operation gatekeeper.watch.intended The total number of Group/Version/Kinds that the watch manager has instructions to watch gatekeeper.watch.watched The total number of Group/Version/Kinds currently watched by the watch manager gatekeeper.validation.request.count The number of requests that are routed to validation webhook gatekeeper.validation.request.duration.seconds.sum The response time in secondShown as second gatekeeper.validation.request.duration.seconds.count The response time in secondShown as second gatekeeper.mutator.ingestion.count Total number of Mutator ingestion actions gatekeeper.mutator.ingestion.duration.seconds.sum The distribution of Mutator ingestion durationsShown as second gatekeeper.mutator.ingestion.duration.seconds.count The distribution of Mutator ingestion durationsShown as second gatekeeper.mutators The current number of Mutator objects gatekeeper.mutator.conflicting.count The current number of conflicting Mutator objects
Events Gatekeeper does not include any events.
Service Checks gatekeeper.prometheus.health
Returns CRITICAL if the agent fails to connect to the Prometheus metrics endpoint, otherwise OK.
Statuses: ok, critical
gatekeeper.health
Returns CRITICAL if the agent fails to connect to the gatekeeper health endpoint, OK if it returns 200, WARNING otherwise.
Statuses: ok, warning, critical
Troubleshooting Need help? Contact Datadog support .