Observability Pipelines is not available on the US1-FED Datadog site.
Datadog recommends you update Observability Pipelines Worker (OPW) with every minor and patch release, or, at a minimum, monthly.
Upgrading to a major OPW version and keeping it updated is the only supported way to get the latest OPW functionality, fixes, and security updates.
Overview
Observability Pipelines allows you to collect, process, and route logs in your own infrastructure. It comes with out-of-the-box templates so that you can easily build and deploy pipelines.
The Observability Pipelines Worker is the software that runs in your infrastructure. It centrally aggregates, processes, and routes your logs based on your use case. This means you can redact sensitive data, pre-process logs, and determine which destinations they should go to, all before the logs leave your environment.
The Observability Pipelines UI provides a control plane to manage your Observability Pipelines Workers. You build and edit pipelines and deploy pipeline changes to your Workers from there. You can also enable out-of-the-box monitors for your pipelines so that you can evaluate their health.
See Advanced Configurations for bootstrapping options and for details on setting up the Worker with Kubernetes.
Explore Observability Pipelines
Build pipelines with out-of-the-box templates
The templates are built for the following use cases:
Log Volume Control
Raw logs are noisy, and only some logs are useful for further search and analysis during investigations. Use the Log Volume Control template to determine which logs to send to your indexed solution, such as a SIEM or log management solution. This helps you to increase the value of your indexed logs and also remain within your planned budget.
Dual Ship Logs
As your organization grows, your observability needs for different use cases, such as security, archiving, and log management, also change. This could mean having to trial different archiving, SIEM, and log management solutions. However, managing log pipelines to different solutions can be complicated. Use the Dual Ship Logs template to centrally aggregate, process, and send copies of your logs to different destinations.
Archive Logs
Use the Archive Logs template to store logs in a cloud storage solution (Amazon S3, Google Cloud Storage, or Azure Storage). The archived logs are stored in a Datadog-rehydratable format, so that they can be rehydrated in Datadog as needed. This is useful when:
You have a high volume of noisy logs, but might need to index them in Datadog Log Management ad hoc for an investigation.
You are migrating to Datadog Log Management and want to have historical logs after completing the migration.
You have a retention policy to fulfill compliance requirements but don’t necessarily need to index those logs.
Split Logs
When you have logs from different services and applications, you might need to send them to different downstream services for querying, analysis, and alerting. For example, you might want to send security logs to a SIEM solution and DevOps logs to Datadog. Use the Split Logs template to preprocess your logs separately for each destination before sending them downstream.
Sensitive Data Redaction
Use the Sensitive Data Redaction template to detect and redact sensitive information on premises. The Observability Pipelines sensitive data scanner processor provides 70 out-of-the-box scanning rules, but you can also create your own custom scanning rules using regular expressions. The OOTB rules recognize standard patterns such as credit card numbers, email addresses, IP addresses, API and SSH keys, and access tokens.
Log Enrichment
Your organization’s different services, systems, and applications all generate logs containing layers of information and in different formats. This can make it difficult to extract the data you need when searching and analyzing the data for an investigation. Use the Log Enrichment template to standardize your logs and enrich them with information, such as data from a reference table.
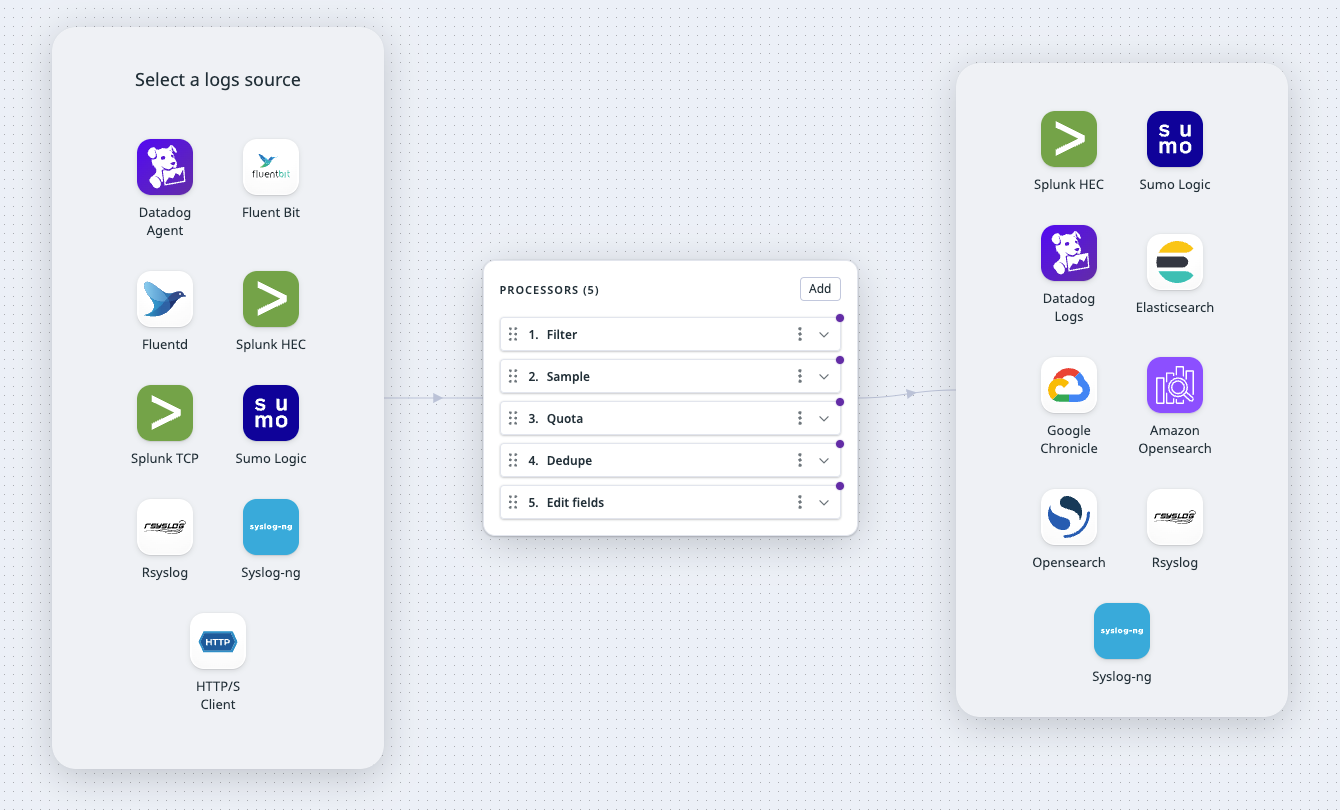
Build pipelines in the Observability Pipelines UI
Build your pipelines in the Observability Pipelines UI. After you select one of the out-the-box templates, the onboarding workflow walks you through setting up your source, processors, and destinations. The installation page provides instructions on how to install the Worker in your environment (Docker, Kubernetes, Linux, or CloudFormation).
Enable out-of-the-box monitors for your pipeline components
After you create your pipeline, enable out-of-the box monitors to get alerted when:
There are increasing error rates for a component. This could happen because the component is processing data in unexpected formats.
The Observability Pipelines Worker has high CPU usage or memory usage.
There are spikes in data dropped by a component.
Further Reading
Additional helpful documentation, links, and articles: