- Essentials
- Getting Started
- Datadog
- Datadog Site
- DevSecOps
- Serverless for AWS Lambda
- Agent
- Integrations
- Containers
- Dashboards
- Monitors
- Logs
- APM Tracing
- Profiler
- Tags
- API
- Service Catalog
- Session Replay
- Continuous Testing
- Synthetic Monitoring
- Incident Management
- Database Monitoring
- Cloud Security Management
- Cloud SIEM
- Application Security Management
- Workflow Automation
- CI Visibility
- Test Visibility
- Intelligent Test Runner
- Code Analysis
- Learning Center
- Support
- Glossary
- Standard Attributes
- Guides
- Agent
- Integrations
- OpenTelemetry
- Developers
- Authorization
- DogStatsD
- Custom Checks
- Integrations
- Create an Agent-based Integration
- Create an API Integration
- Create a Log Pipeline
- Integration Assets Reference
- Build a Marketplace Offering
- Create a Tile
- Create an Integration Dashboard
- Create a Recommended Monitor
- Create a Cloud SIEM Detection Rule
- OAuth for Integrations
- Install Agent Integration Developer Tool
- Service Checks
- IDE Plugins
- Community
- Guides
- API
- Datadog Mobile App
- CoScreen
- Cloudcraft
- In The App
- Dashboards
- Notebooks
- DDSQL Editor
- Sheets
- Monitors and Alerting
- Infrastructure
- Metrics
- Watchdog
- Bits AI
- Service Catalog
- API Catalog
- Error Tracking
- Service Management
- Infrastructure
- Application Performance
- APM
- Continuous Profiler
- Database Monitoring
- Data Streams Monitoring
- Data Jobs Monitoring
- Digital Experience
- Real User Monitoring
- Product Analytics
- Synthetic Testing and Monitoring
- Continuous Testing
- Software Delivery
- CI Visibility
- CD Visibility
- Test Visibility
- Intelligent Test Runner
- Code Analysis
- Quality Gates
- DORA Metrics
- Security
- Security Overview
- Cloud SIEM
- Cloud Security Management
- Application Security Management
- AI Observability
- Log Management
- Observability Pipelines
- Log Management
- Administration
Ingestion Controls
Ingestion controls affect what traces are sent by your applications to Datadog. APM metrics are always calculated based on all traces, and are not impacted by ingestion controls.
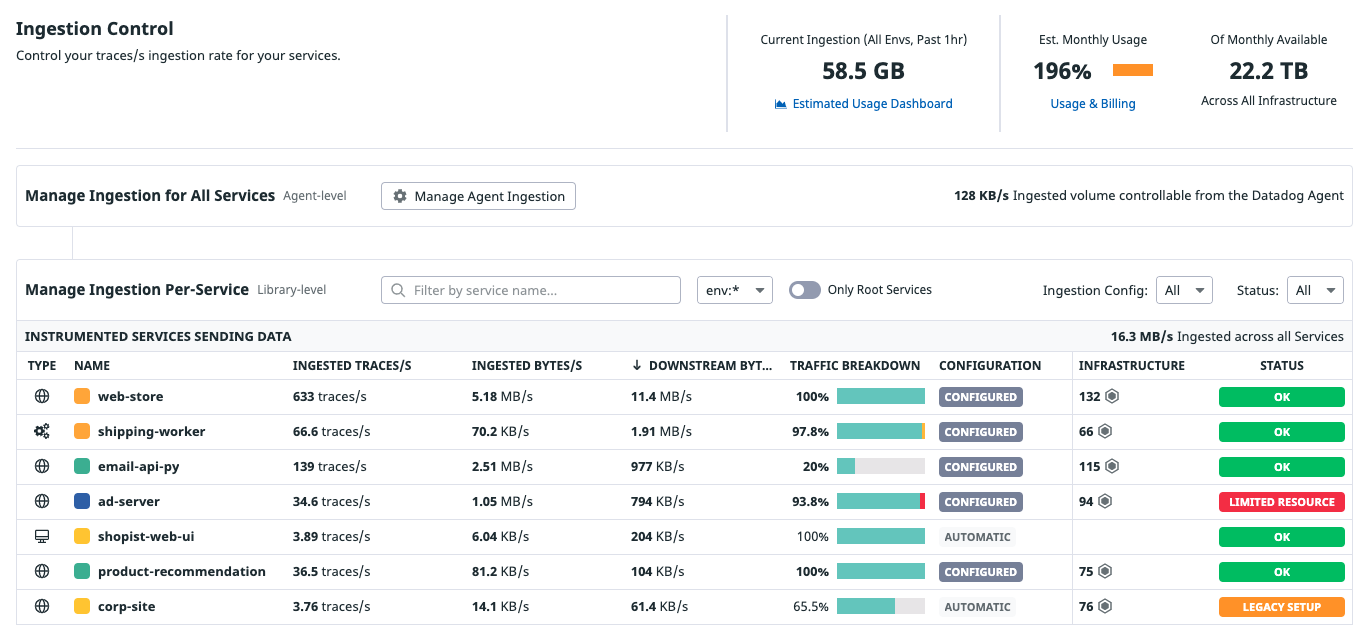
The Ingestion Control page provides visibility at the Agent and tracing libraries level into the ingestion configuration of your applications and services. From the ingestion control configuration page, you can:
- Gain visibility on your service-level ingestion configuration and adjust trace sampling rates for high throughput services.
- Understand which ingestion mechanisms are responsible for sampling most of your traces.
- Investigate and act on potential ingestion configuration issues, such as limited CPU or RAM resources for the Agent.
All metrics used in the page are based on live traffic data of the past 1 hour. Any Agent or library configuration change is reflected in the page.
Summary across all environments
Get an overview of the total ingested data over the past hour, and an estimation of your monthly usage against your monthly allocation, calculated with the active APM infrastructure (hosts, Fargate tasks, and serverless functions).
If the monthly usage is under 100%, the projected ingested data fits in your monthly allotment. A monthly usage value over 100% means that the monthly ingested data is projected to be over your monthly allotment.
Managing ingestion for all services at the Agent level
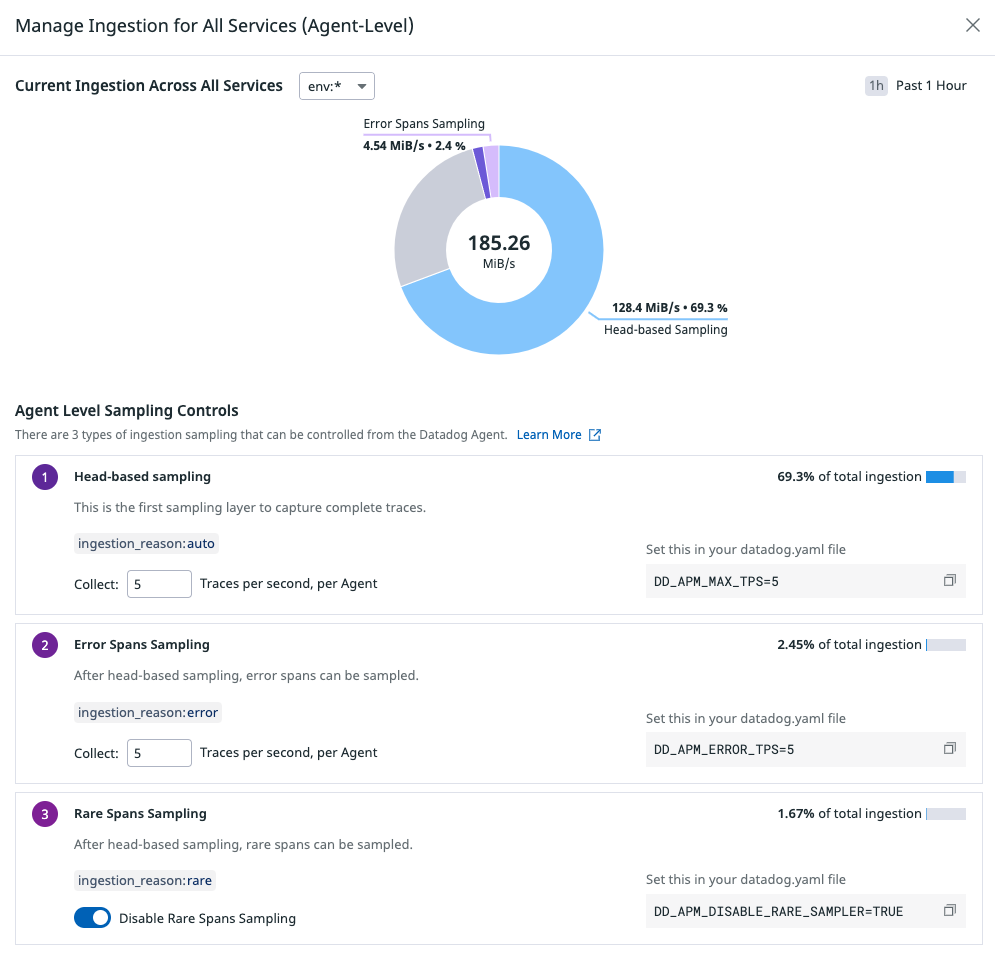
Click Remotely Configure Agent Ingestion to manage ingestion sampling for your services globally. You can remotely configure Agent sampling parameters if you are using Agent version 7.42.0 or higher. Read How Remote Configuration Works for information about enabling remote configuration in your Agents.
Three ingestion sampling mechanisms are controllable from the Datadog Agent:
- Head-based Sampling: When no sampling rules are set for a service, the Datadog Agent automatically computes sampling rates to be applied for your services, targeting 10 traces per second per Agent. Change this target number of traces in Datadog, or set
DD_APM_MAX_TPSlocally at the Agent level. - Error Spans Sampling: For traces not caught by head-based sampling, the Datadog Agent catches local error traces up to 10 traces per second per Agent. Change this target number of traces in Datadog, or set
DD_APM_ERROR_TPSlocally at the Agent level. - Rare Spans Sampling: For traces not caught by head-based sampling, the Datadog Agent catches local rare traces up to 5 traces per second per Agent. This setting is disabled by default. Enable the collection of rare traces in Datadog, or set
DD_APM_ENABLE_RARE_SAMPLERlocally at the Agent level.
With remote configuration, you don’t have to restart the Agent to update these parameters. Click Apply to save the configuration changes, and the new configuration takes effect immediately.
Note: The Other Ingestion Reasons (gray) section of the pie chart represents other ingestion reasons which are not configurable at the Datadog Agent level.
Note: Remotely configured parameters take precedence over local configurations such as environment variables and datadog.yaml configuration.
Managing ingestion for an individual service at the library level
The service table contains information about the ingested volumes and ingestion configuration, broken down by service:
- Type
- The service type: web service, database, cache, browser, etc…
- Name
- The name of each service sending traces to Datadog. The table contains root and non-root services for which data was ingested in the past one hour.
- Ingested Traces/s
- Average number of traces per second ingested starting from the service over the past one hour.
- Ingested Bytes/s
- Average number of bytes per second ingested into Datadog for the service over the past one hour.
- Downstream Bytes/s
- Average number of bytes per second ingested for which the service makes the sampling decision. This includes the bytes of all downstream child spans that follow the decision made at the head of the trace, as well as spans caught by the Error sampler, the Rare sampler, and the App Analytics mechanism. This column’s data is based on the
sampling_servicedimension, set on thedatadog.estimated_usage.apm.ingested_bytesmetrics. For more information, read APM usage metrics. - Traffic Breakdown
- A detailed breakdown of traffic sampled and unsampled for traces starting from the service. See Traffic breakdown for more information.
- Ingestion Configuration
- Shows
Automaticif the default head-based sampling mechanism from the Agent applies. If the ingestion was configured in the tracing libraries with trace sampling rules, the service is marked asConfigured. For more information about configuring ingestion for a service, read about changing the default ingestion rate. - Infrastructure
- Hosts, containers, and functions on which the service is running.
- Service status
- Shows
Limited Resourcewhen some spans are dropped due to the Datadog Agent reaching CPU or RAM limits set in its configuration,Legacy Setupwhen some spans are ingested through the legacy App Analytics mechanism, orOKotherwise.
Filter the page by environment, configuration, and status to view services for which you need to take an action. To reduce the global ingestion volume, sort the table by the Downstream Bytes/s column to view services responsible for the largest share of your ingestion.
Note: The table is powered by the usage metrics datadog.estimated_usage.apm.ingested_spans and datadog.estimated_usage.apm.ingested_bytes. These metrics are tagged by service, env and ingestion_reason.
Traffic breakdown
The Traffic Breakdown column breaks down the destination of all traces originating from the service. It gives you an estimate of the share of traffic that is ingested and dropped, and for which reasons.
The breakdown is composed of the following parts:
Complete traces ingested (blue): The percentage of traces that have been ingested by Datadog.
Complete traces not retained (gray): The percentage of traces that have intentionally not been forwarded to Datadog by the Agent or the tracing library. This can happen for one of two reasons depending on your configuration:
- By default, the Agent distributes an ingestion rate to services depending on service traffic.
- When the service is manually configured to ingest a certain percentage of traces at the tracing library level.
Complete traces dropped by the tracer rate limiter (orange): When you choose to manually set the service ingestion rate as a percentage with trace sampling rules, a rate limiter is automatically enabled, set to 100 traces per second by default. See the rate limiter documentation to manually configure this rate.
Traces dropped due to the Agent CPU or RAM limit (red): This mechanism may drop spans and create incomplete traces. To fix this, increase the CPU and memory allocation for the infrastructure that the Agent runs on.
Service ingestion summary
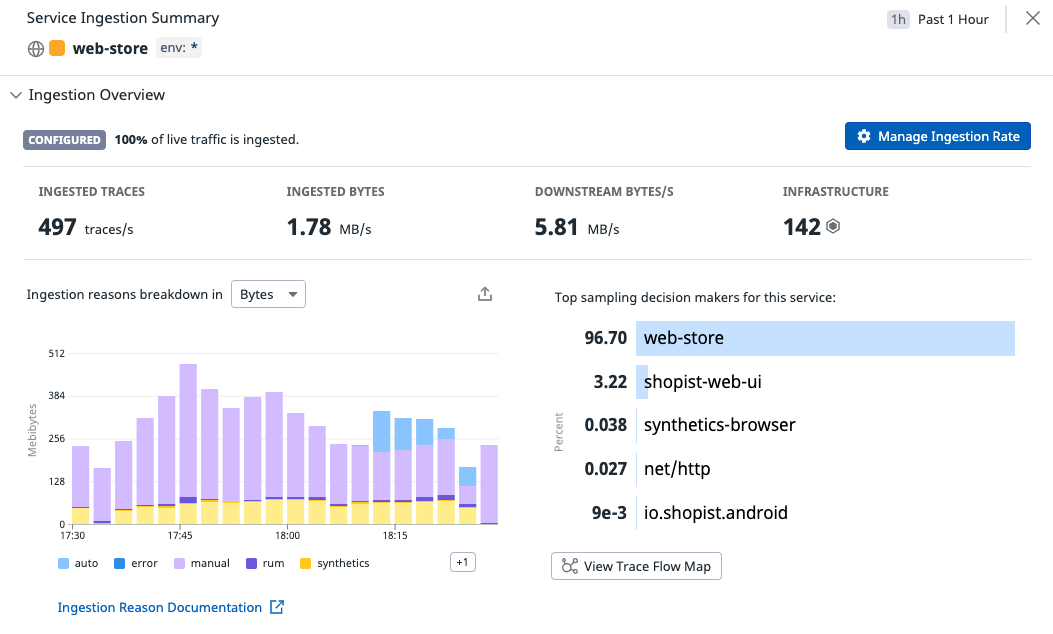
Click on any service row to view the Service Ingestion Summary, a detailed view providing actionable insights on the ingestion configuration of the service.
Explore the Ingestion reasons breakdown to see which mechanisms are responsible for your service ingestion. Each ingestion reason relates to one specific ingestion mechanism. After changing your service ingestion configuration, you can observe the increase or decrease of ingested bytes and spans in this timeseries graph based on the past hour of ingested data.
If most of your service ingestion volume is due to decisions taken by upstream services, investigate the detail of the Sampling decision makers top list. For example, if your service is non-root, (meaning that it never decides to sample traces), observe all upstream services responsible for your non-root service ingestion. Configure upstream root services to reduce your overall ingestion volume.
For further investigations, use the APM Trace - Estimated Usage Dashboard, which provides global ingestion information as well as breakdown graphs by service, env and ingestion reason.
Agent and tracing library versions
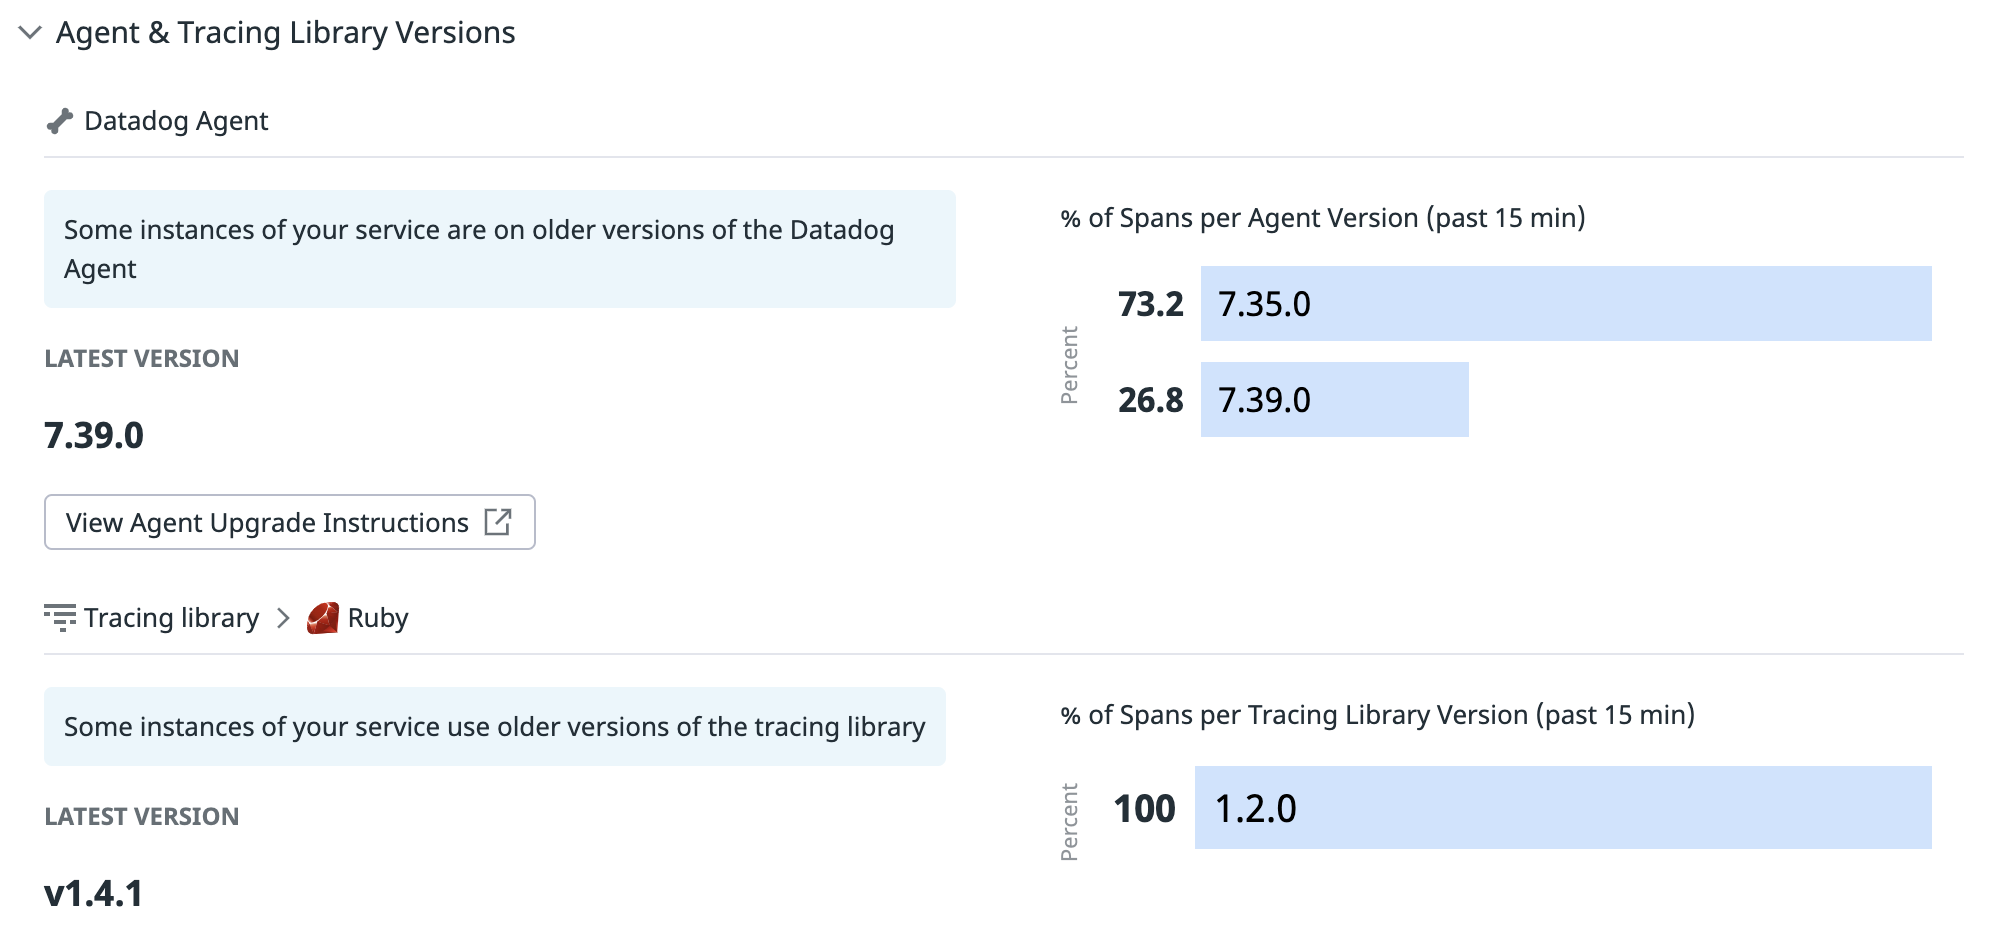
See the Datadog Agent and tracing library versions your service is using. Compare the versions in use to the latest released versions to make sure you are running recent and up-to-date Agents and libraries.
Note: You need to upgrade the Agent to v6.34 or v7.34 for the version information to be reported.
Configure the service ingestion rate
Remotely configured sampling rules are in Beta. Request access to the feature via this link to be able to dynamically set this configuration from the Datadog UI without having to redeploy your service. Follow the instructions in the Resource-based sampling guide to get started.
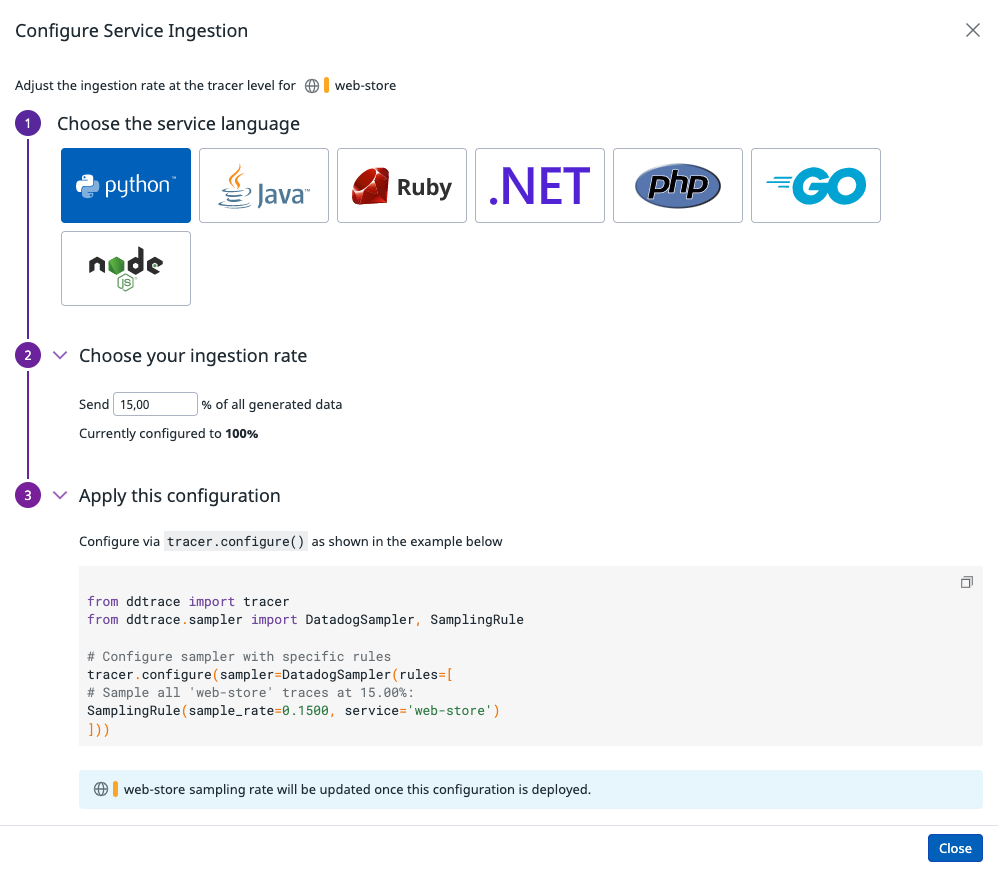
Click Manage Ingestion Rate to get instructions on how to configure your service ingestion rate.
To specify a specific percentage of a service’s traffic to be sent, add an environment variable or a generated code snippet to your tracing library configuration for that service.
- Select the service you want to change the ingested span percent for.
- Choose the service language.
- Choose the desired ingestion percentage.
- Apply the appropriate configuration generated from these choices to the indicated service and redeploy the service. Note: The service name value is case sensitive. It should match the case of your service name.
- Confirm on the Ingestion Control Page that your new percentage has been applied by looking at the Traffic Breakdown column, which surfaces the sampling rate applied. The ingestion reason for the service is shown as
ingestion_reason:rule.
Further Reading
Additional helpful documentation, links, and articles:

