- Essentials
- Getting Started
- Datadog
- Datadog Site
- DevSecOps
- Serverless for AWS Lambda
- Agent
- Integrations
- Containers
- Dashboards
- Monitors
- Logs
- APM Tracing
- Profiler
- Tags
- API
- Service Catalog
- Session Replay
- Continuous Testing
- Synthetic Monitoring
- Incident Management
- Database Monitoring
- Cloud Security Management
- Cloud SIEM
- Application Security Management
- Workflow Automation
- CI Visibility
- Test Visibility
- Intelligent Test Runner
- Code Analysis
- Learning Center
- Support
- Glossary
- Standard Attributes
- Guides
- Agent
- Integrations
- OpenTelemetry
- Developers
- Authorization
- DogStatsD
- Custom Checks
- Integrations
- Create an Agent-based Integration
- Create an API Integration
- Create a Log Pipeline
- Integration Assets Reference
- Build a Marketplace Offering
- Create a Tile
- Create an Integration Dashboard
- Create a Recommended Monitor
- Create a Cloud SIEM Detection Rule
- OAuth for Integrations
- Install Agent Integration Developer Tool
- Service Checks
- IDE Plugins
- Community
- Guides
- API
- Datadog Mobile App
- CoScreen
- Cloudcraft
- In The App
- Dashboards
- Notebooks
- DDSQL Editor
- Sheets
- Monitors and Alerting
- Infrastructure
- Metrics
- Watchdog
- Bits AI
- Service Catalog
- API Catalog
- Error Tracking
- Service Management
- Infrastructure
- Application Performance
- APM
- Continuous Profiler
- Database Monitoring
- Data Streams Monitoring
- Data Jobs Monitoring
- Digital Experience
- Real User Monitoring
- Product Analytics
- Synthetic Testing and Monitoring
- Continuous Testing
- Software Delivery
- CI Visibility
- CD Visibility
- Test Visibility
- Intelligent Test Runner
- Code Analysis
- Quality Gates
- DORA Metrics
- Security
- Security Overview
- Cloud SIEM
- Cloud Security Management
- Application Security Management
- AI Observability
- Log Management
- Observability Pipelines
- Log Management
- Administration
Usage Details
Overview
Administrators can access the Usage page by hovering over their username at the bottom left, then navigate to:
Plan & Usage–> Usage.
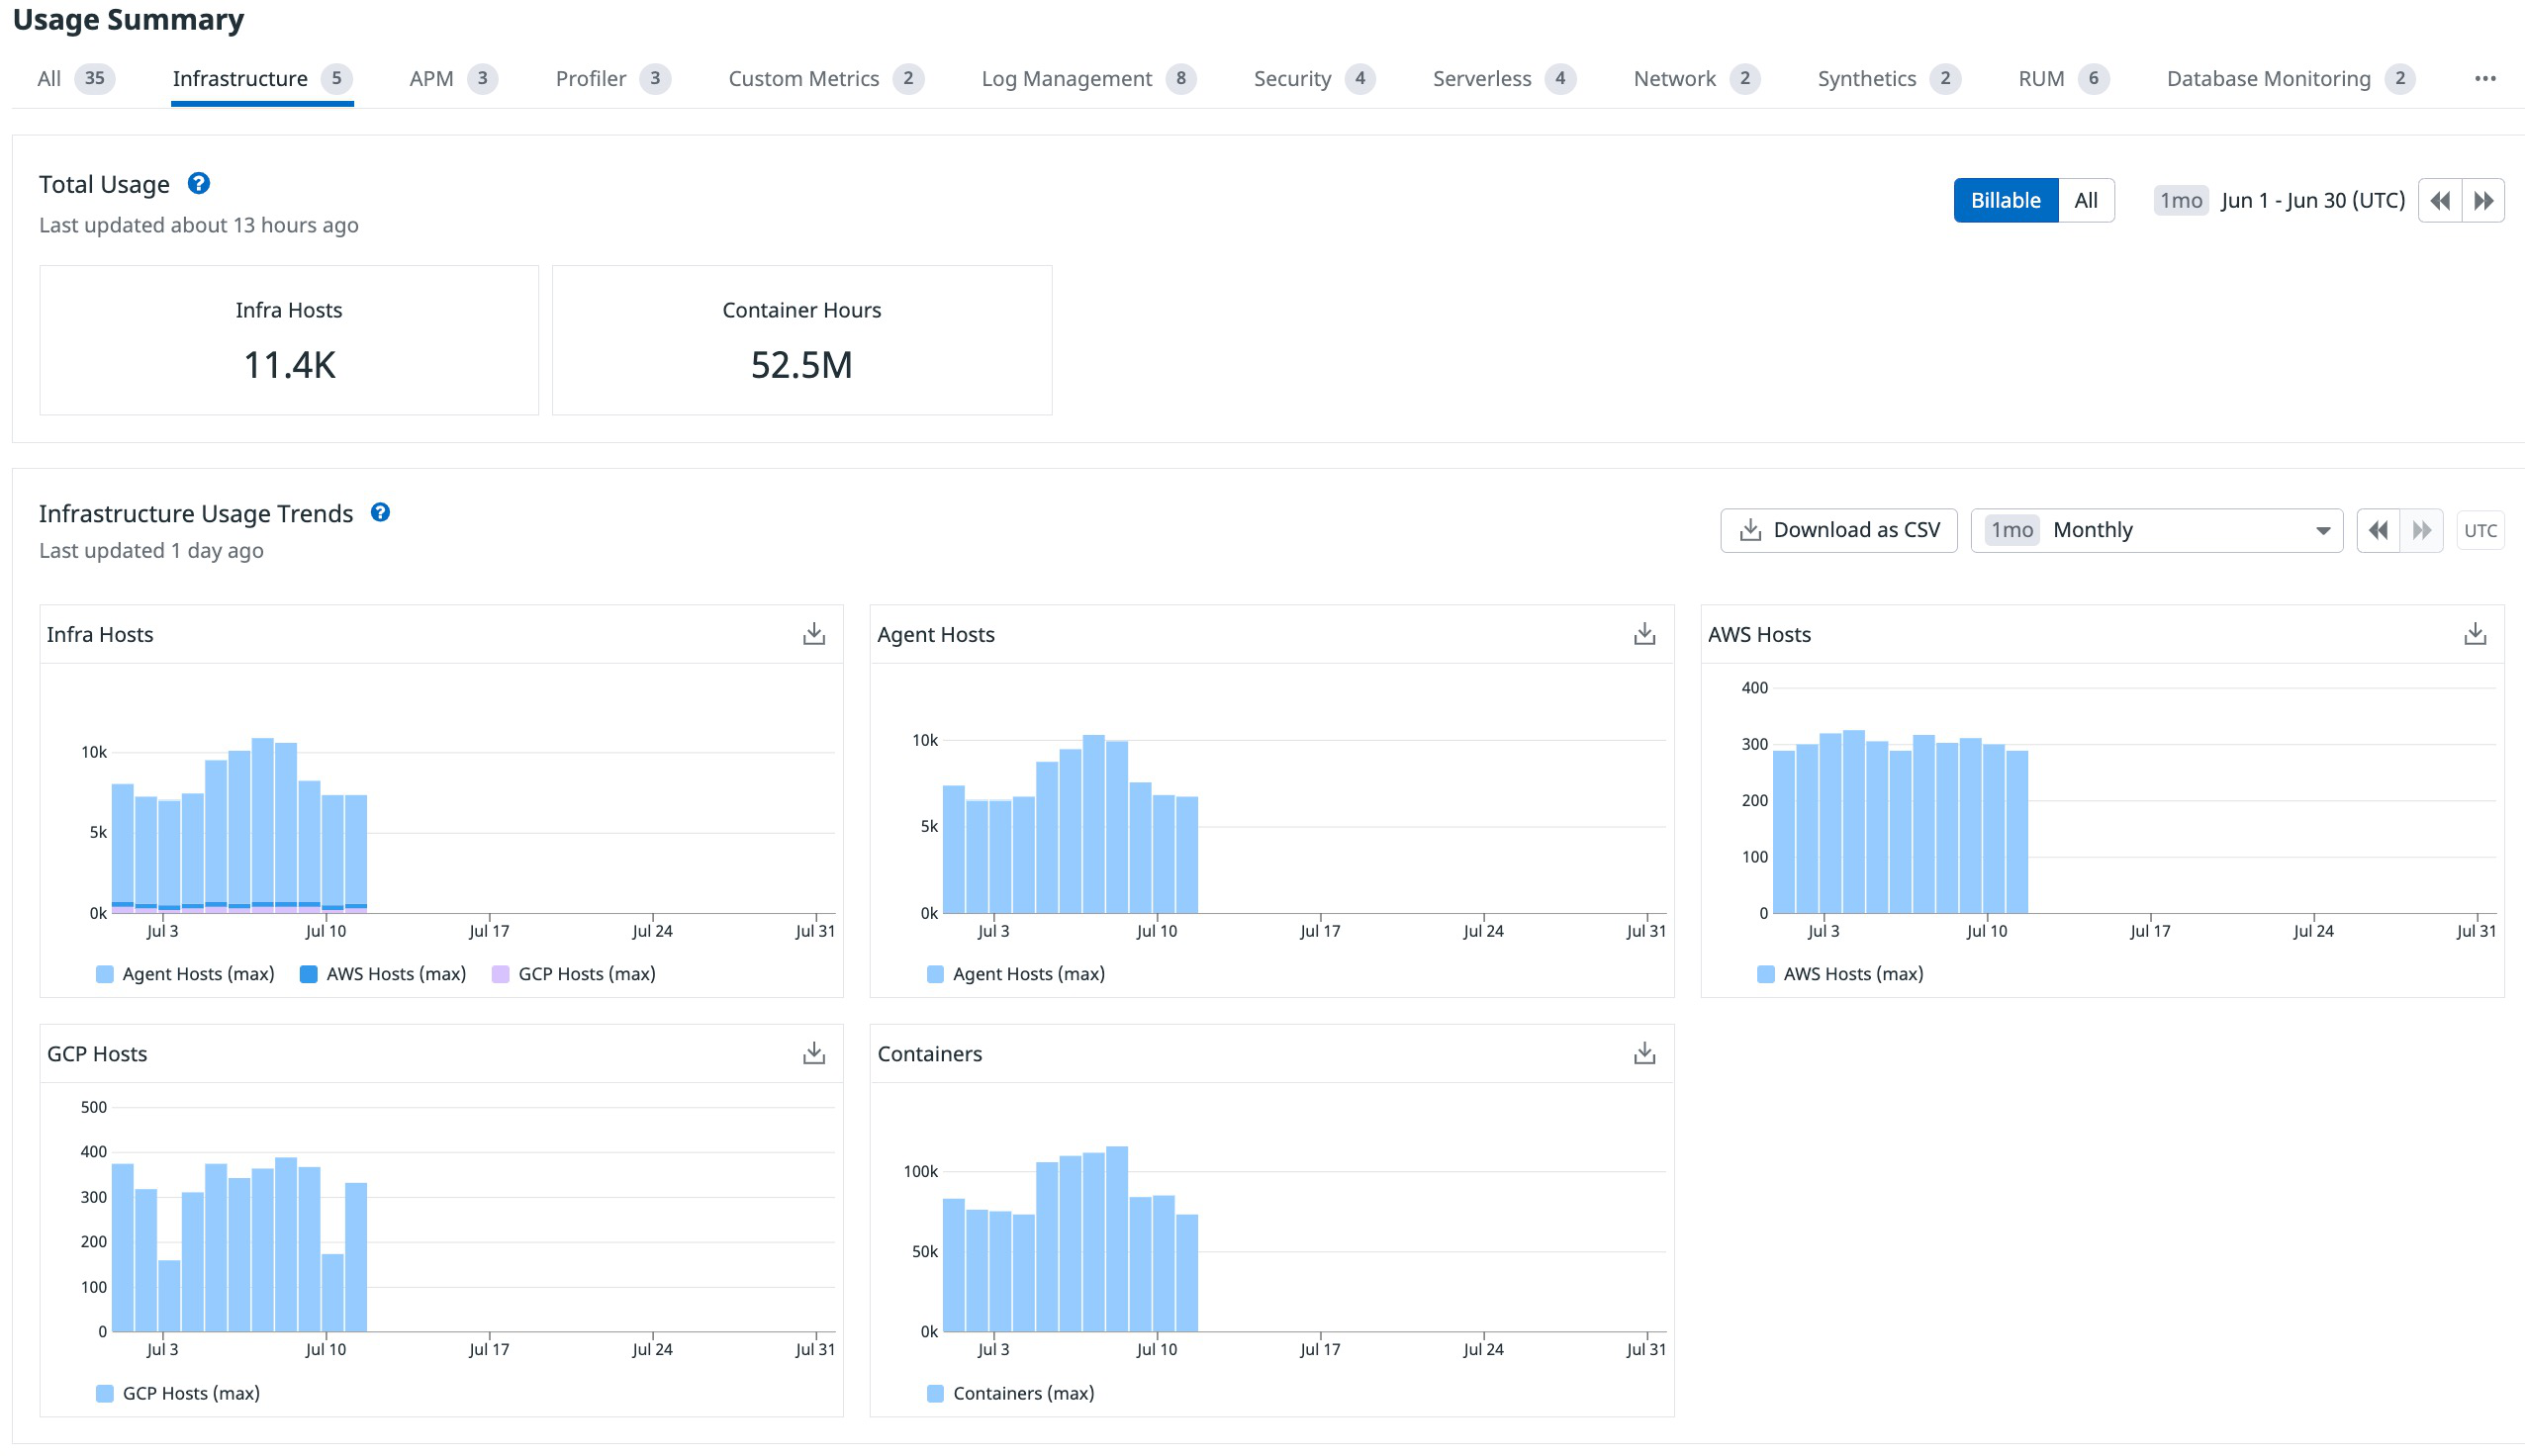
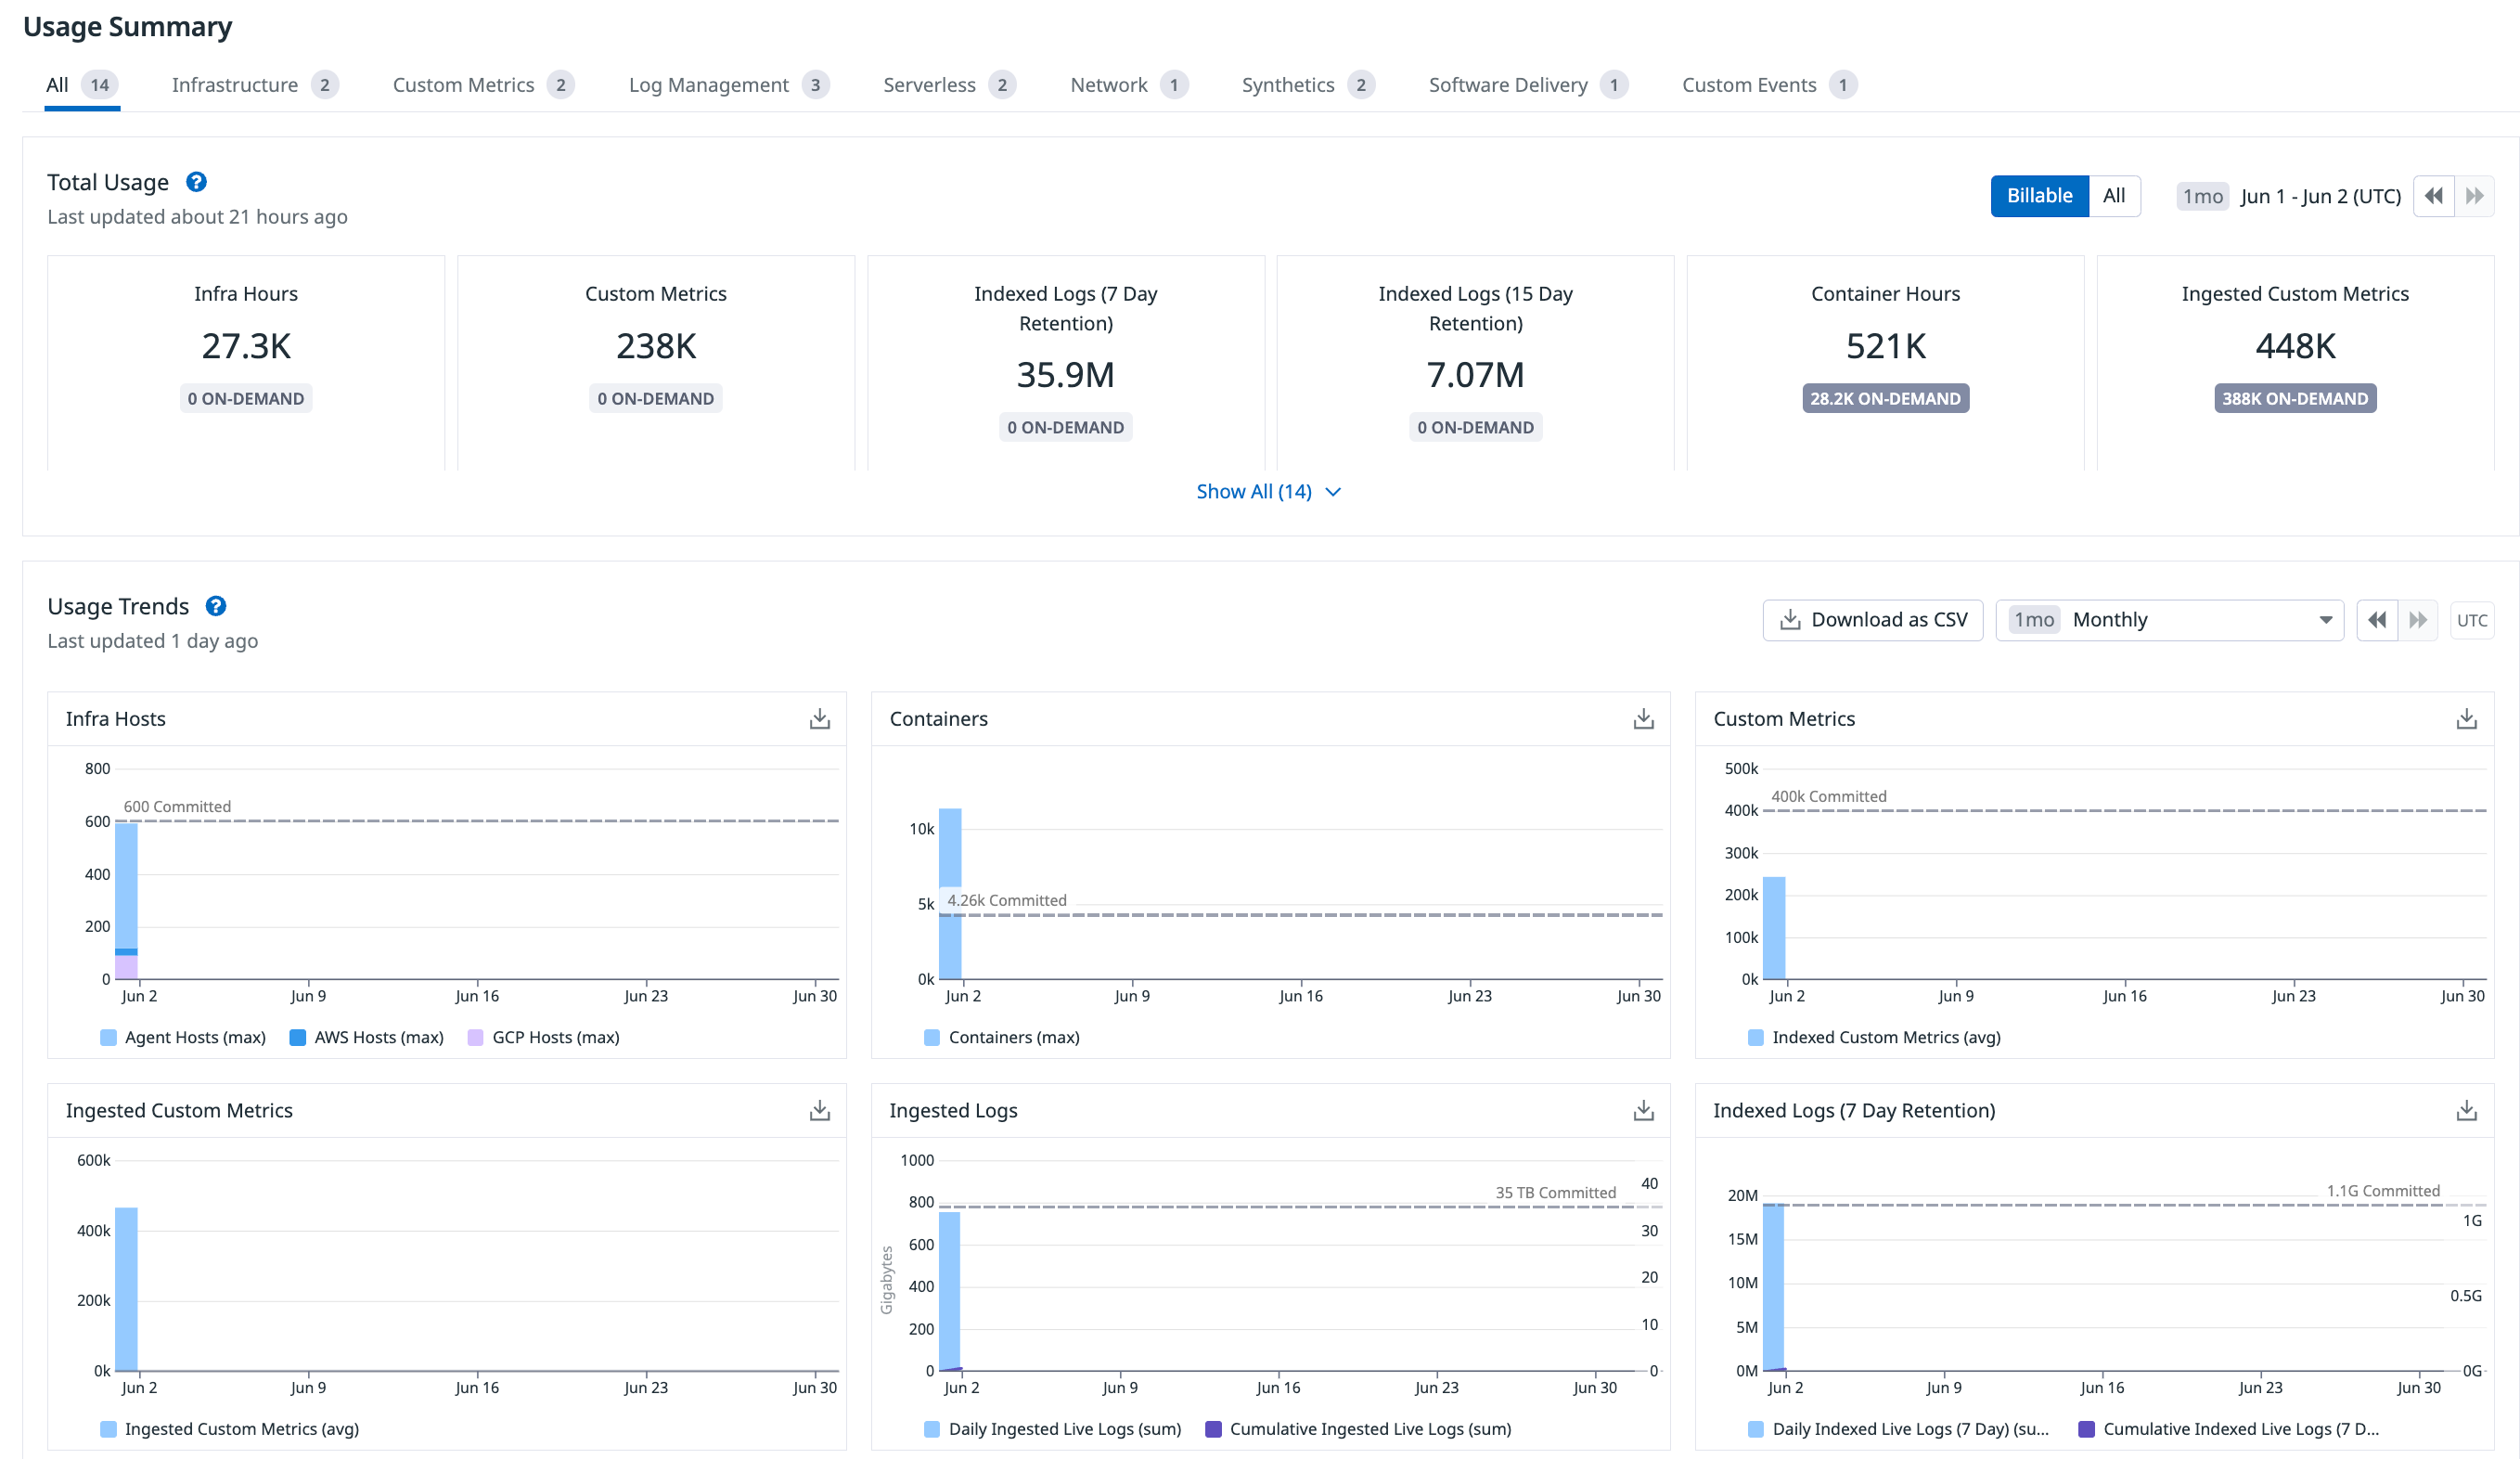
The Usage page shows usage grouped by product category. You can navigate to a product tab to view usage specific to that product category or the “All” tab to view usage for all products. Each tab provides the following information:
- Month-to-Date Summary
- Overall Usage (current and historical)
Certain product tabs also contain additional tools:
- Custom Metrics Tab: Top Custom Metrics
- Log Management Tab: Logs Usage by Index
Month-to-date summary
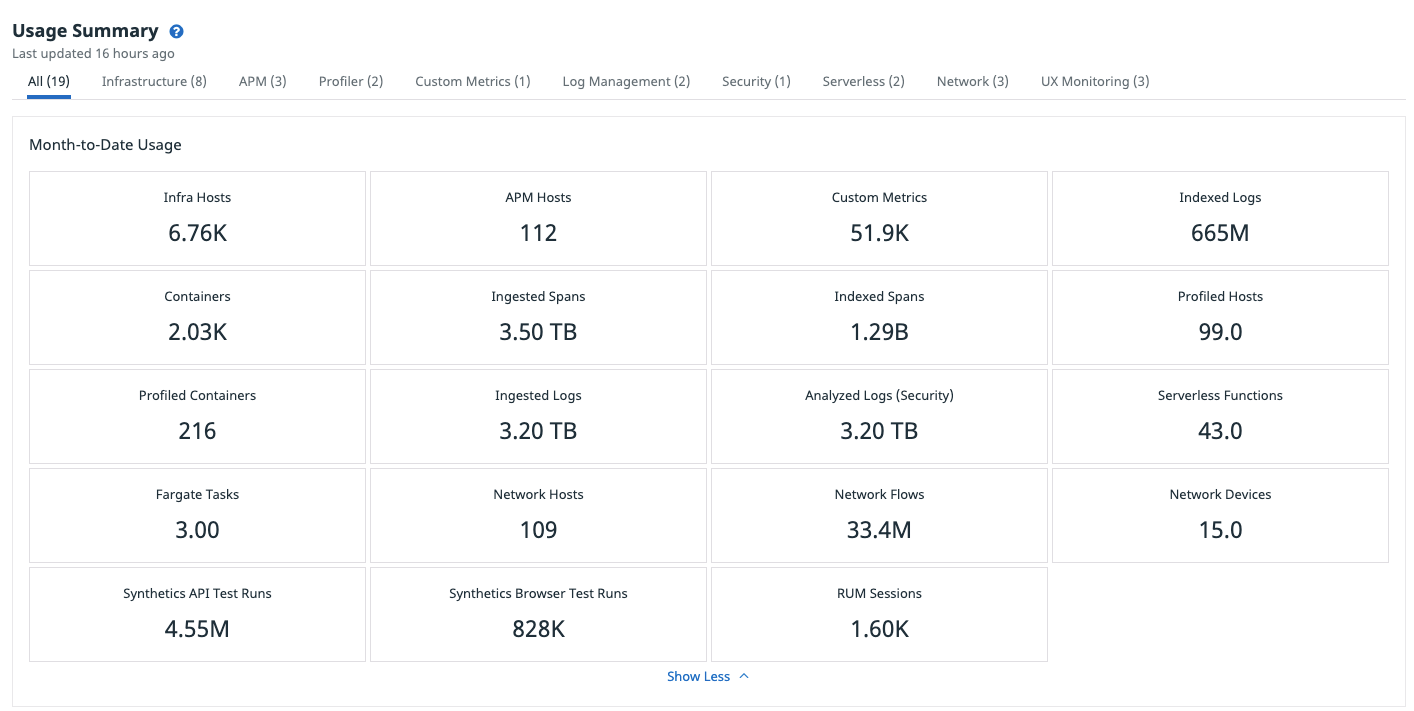
This section summarizes your month-to-date usage. In the “All” tab, view your month-to-date usage of infrastructure hosts, containers, custom metrics, APM hosts, logs, and any other part of the platform you’ve used during the month.
In product specific tabs, view your month-to-date usage of the products in that product category.
The month-to-date usage shown above is “All” usage, which includes non-billable usage such as product trials. Most accounts are able to view “Billable” usage, which only shows usage that contributes to your final bill. The “Billable” view breaks out on-demand usage above your commitments and allocations.
For API users, endpoints are available to access “All” usage and “Billable” usage.Month-to-date usage of each product is calculated as follows:
| Product | Description |
|---|---|
| Infra. Hosts | Shows the 99th percentile of all distinct infrastructure hosts over all hours in the current month. |
| Containers | Shows the high watermark of all distinct containers over all hours in the current month. |
| APM Hosts | Shows the 99th percentile of all distinct APM hosts over all hours in the current month. |
| Profiled Hosts | Shows the 99th percentile of all distinct profiled hosts over all hours in the current month. |
| Profiled Containers | Shows the average of all distinct profiled containers over all hours in the current month. |
| Custom Metrics | Shows the average number of distinct custom metrics over all hours in the current month. |
| Ingested Custom Metrics | Shows the average number of distinct INGESTED custom metrics over all hours in the current month. |
| Ingested Logs | Shows the sum of all log bytes ingested over all hours in the current month. |
| Indexed Logs | Shows the sum of all log events indexed over all hours in the current month. |
| Scanned Logs | Shows the sum of all log bytes scanned by Sensitive Data Scanner over all hours in the current month. |
| Ingested Spans | Shows the sum of all spans ingested over all hours in the current month. |
| Indexed Spans | Shows the sum of all Indexed Spans indexed over all hours in the current month. |
| Analyzed Logs (Security) | Shows the sum of all analyzed log bytes ingested over all hours in the current month. |
| Serverless Functions | Shows the average of the number of functions that are executed 1 or more times each hour in the current month. |
| Serverless Invocations | Shows the sum of all invocations over all hours in the current month. |
| Fargate Tasks | Shows the sum of all Fargate tasks over all hours in the current month. |
| Network Hosts | Shows the 99th percentile of all distinct Network hosts over all hours in the current month. |
| Network Flows | Shows the sum of all Network flows indexed over all hours in the current month. |
| Network Devices | Shows the 99th percentile of all distinct Network devices over all hours in the current month. |
| Synthetic API Tests | Shows the sum of all Synthetic API tests over all hours in the current month. |
| Synthetic Browser Tests | Shows the sum of all Synthetic browser tests over all hours in the current month. |
| RUM Sessions | Shows the sum of all distinct RUM sessions over all hours in the current month. |
| Incident Management | Shows number of unique active users to date in the selected month who interacted with incident lifecycle and timelines. |
| IoT Devices | Shows the 99th percentile of all distinct IoT devices over all hours in the current month. |
Usage trends
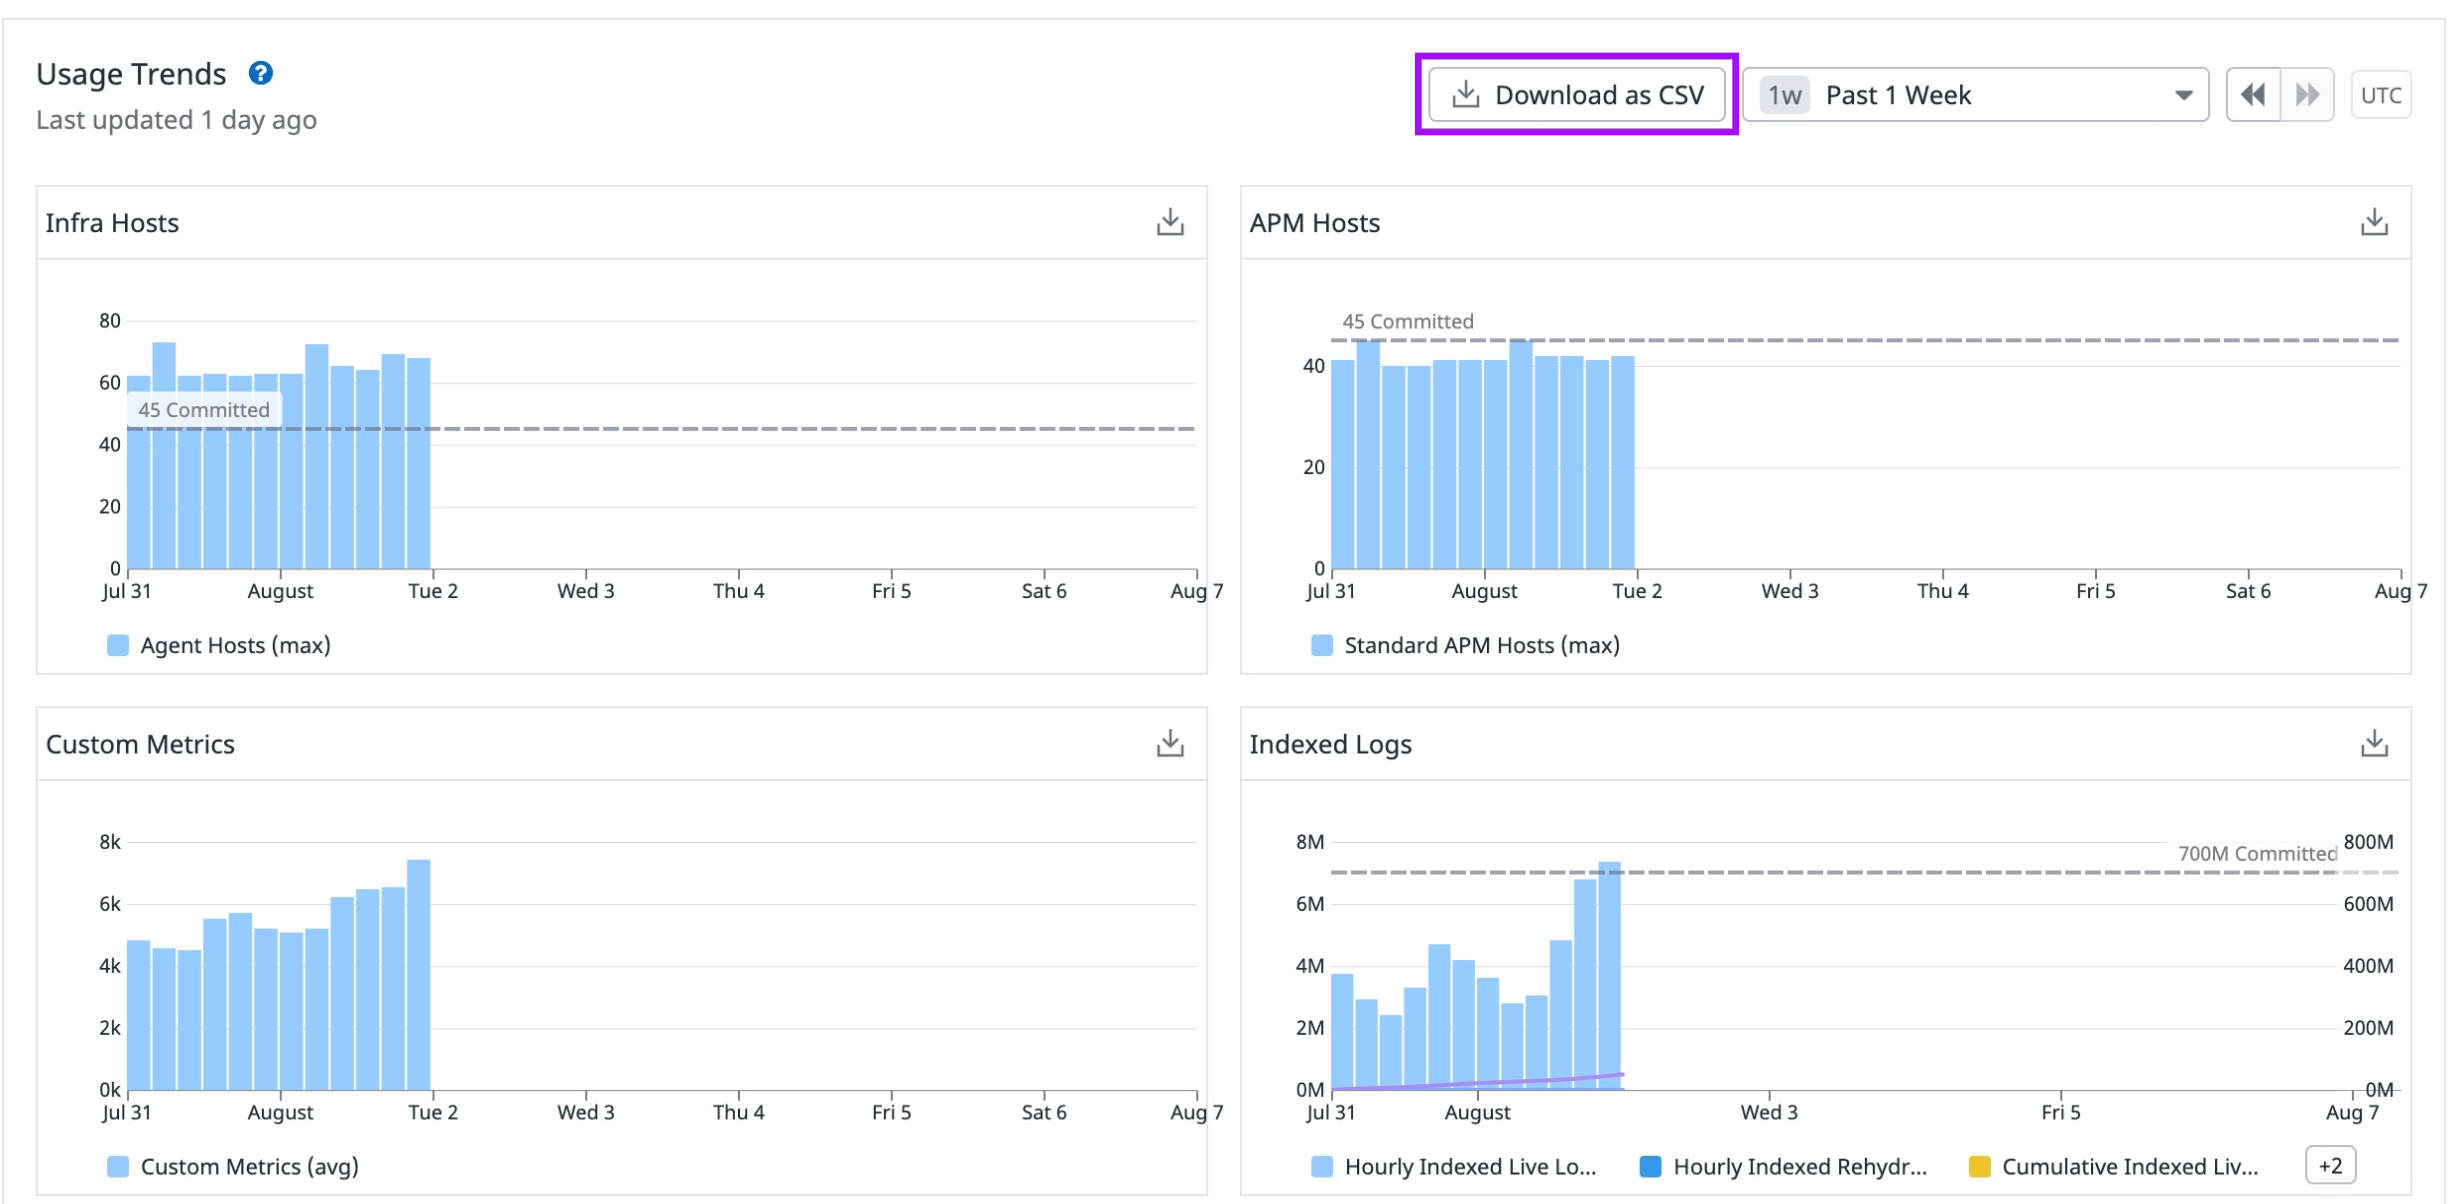
The Usage Trends section contains product usage graphs displaying summed usage for all organizations across an account. Usage reports are downloadable through the Download as CSV button. For each organization, these reports include an hourly breakdown of usage by product.
For products with subtypes, each category is distinguished on the graph for that product.
More detailed product subtype graphs can be found on each product’s tab. For example, a breakdown by host type is available on the Infrastructure tab.
Cumulative usage over time is available for sum-based products.
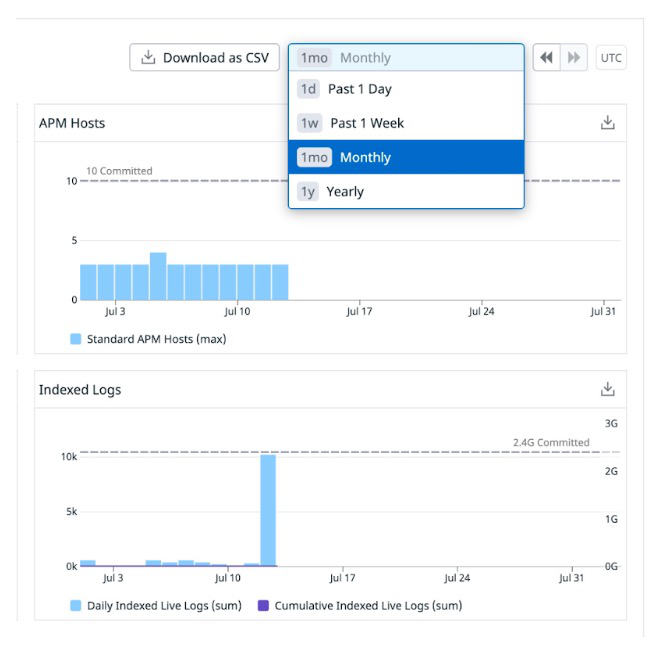
Time selection contains options to view usage graphs at daily, weekly, monthly or yearly intervals.
Billable on-demand pills and committed lines
This feature is in beta. To request access and confirm your organization meets the feature criteria, contact your account representative or Customer Support.
Billable on-demand pills highlight the portion of billable usage that is on-demand usage. The dashed Committed line shows commitments per product, without any allotments (such as Custom Metrics or Containers).
Top custom metrics
In the Custom Metrics tab, the Top Custom Metrics table provides two views for your month-to-date usage and most recent day usage, such as usage on the date of the last update).
The “Top 5000” view provides the following information about your Top 5000 custom metrics:
- Metric name
- Average custom metrics per hour
- Max custom metrics per hour
- The metric’s contribution percentage to the overall custom metrics usage
- Search for a metric within your top 5000 custom metrics
- This data can be downloaded as a CSV file.
The “All” view provides the following information about all your custom metrics:
- Metric name
- Average custom metrics per hour
- Max custom metrics per hour
- Search for a metric within all your custom metrics
- This data can be downloaded as a CSV file, with a maximum of 300,000 custom metrics. You can download over 300,000 custom metrics using our API endpoint.
For more details on your metrics, navigate to the Metrics Summary by hovering over the row of the metric you are interested in and clicking on the meter icon that shows up on the right side.
Logs usage by index
In the Log Management tab, this table displays your hourly, daily, monthly, and annual indexed log usage by index name and retention period. It also shows the breakdown between live logs and rehydrated logs. The following information is provided:
- Index name
- Retention period in days
- Indexed log count
- The index’s contribution percentage to the overall indexed log usage for the time period selected
This data can be downloaded as a CSV file.
First-time usage notifications
This feature is in beta. To request access and confirm your organization meets the feature criteria, contact your account representative or Customer Support.
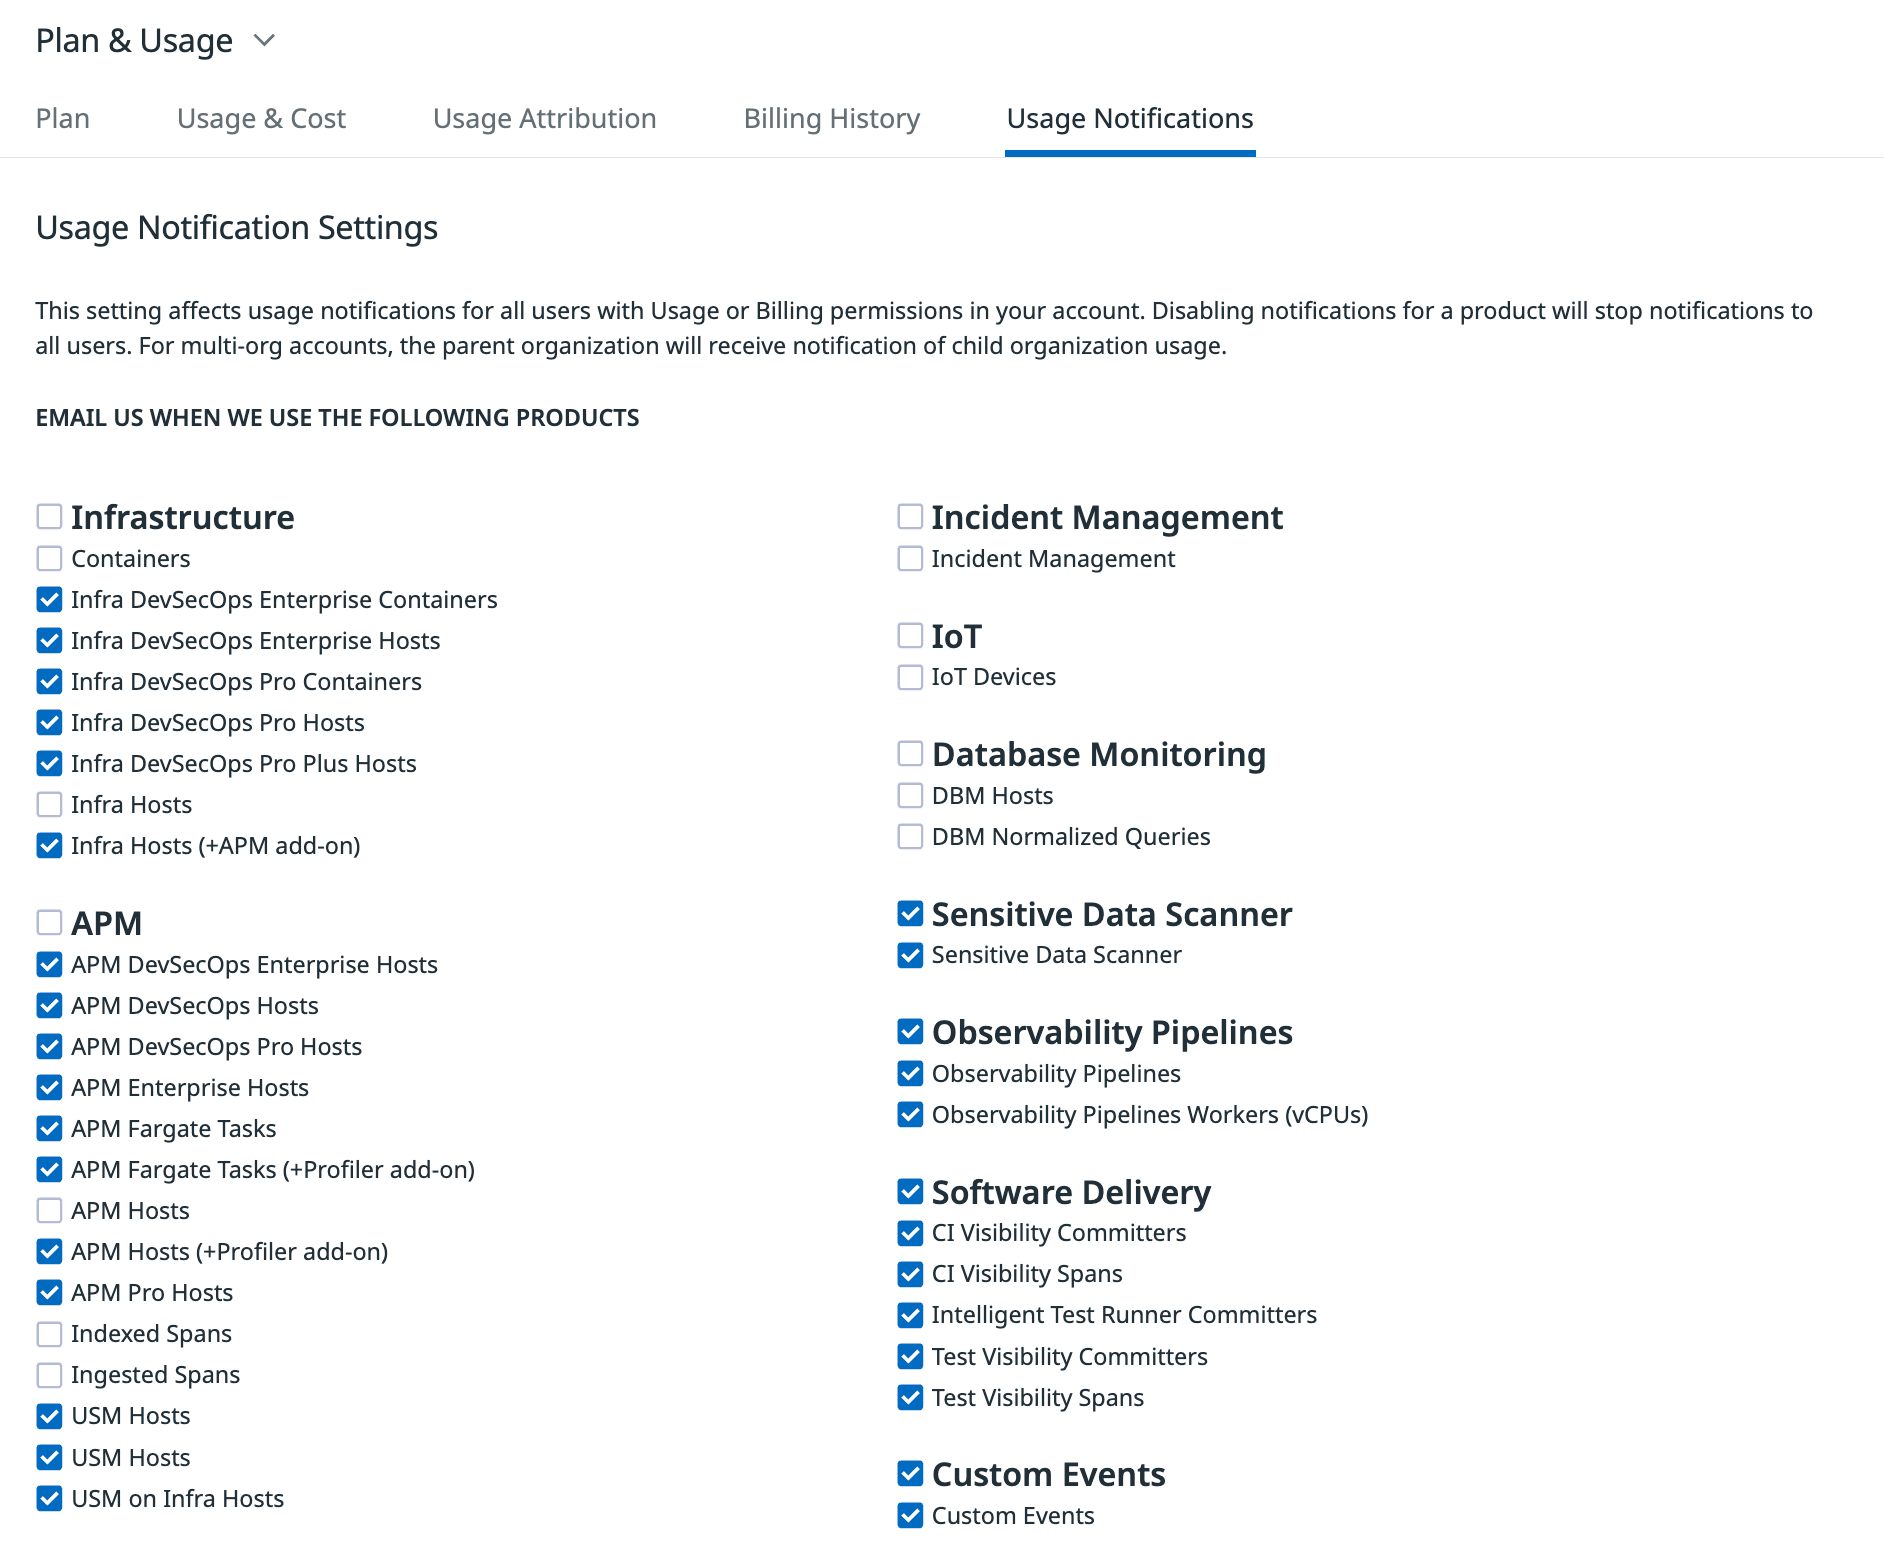
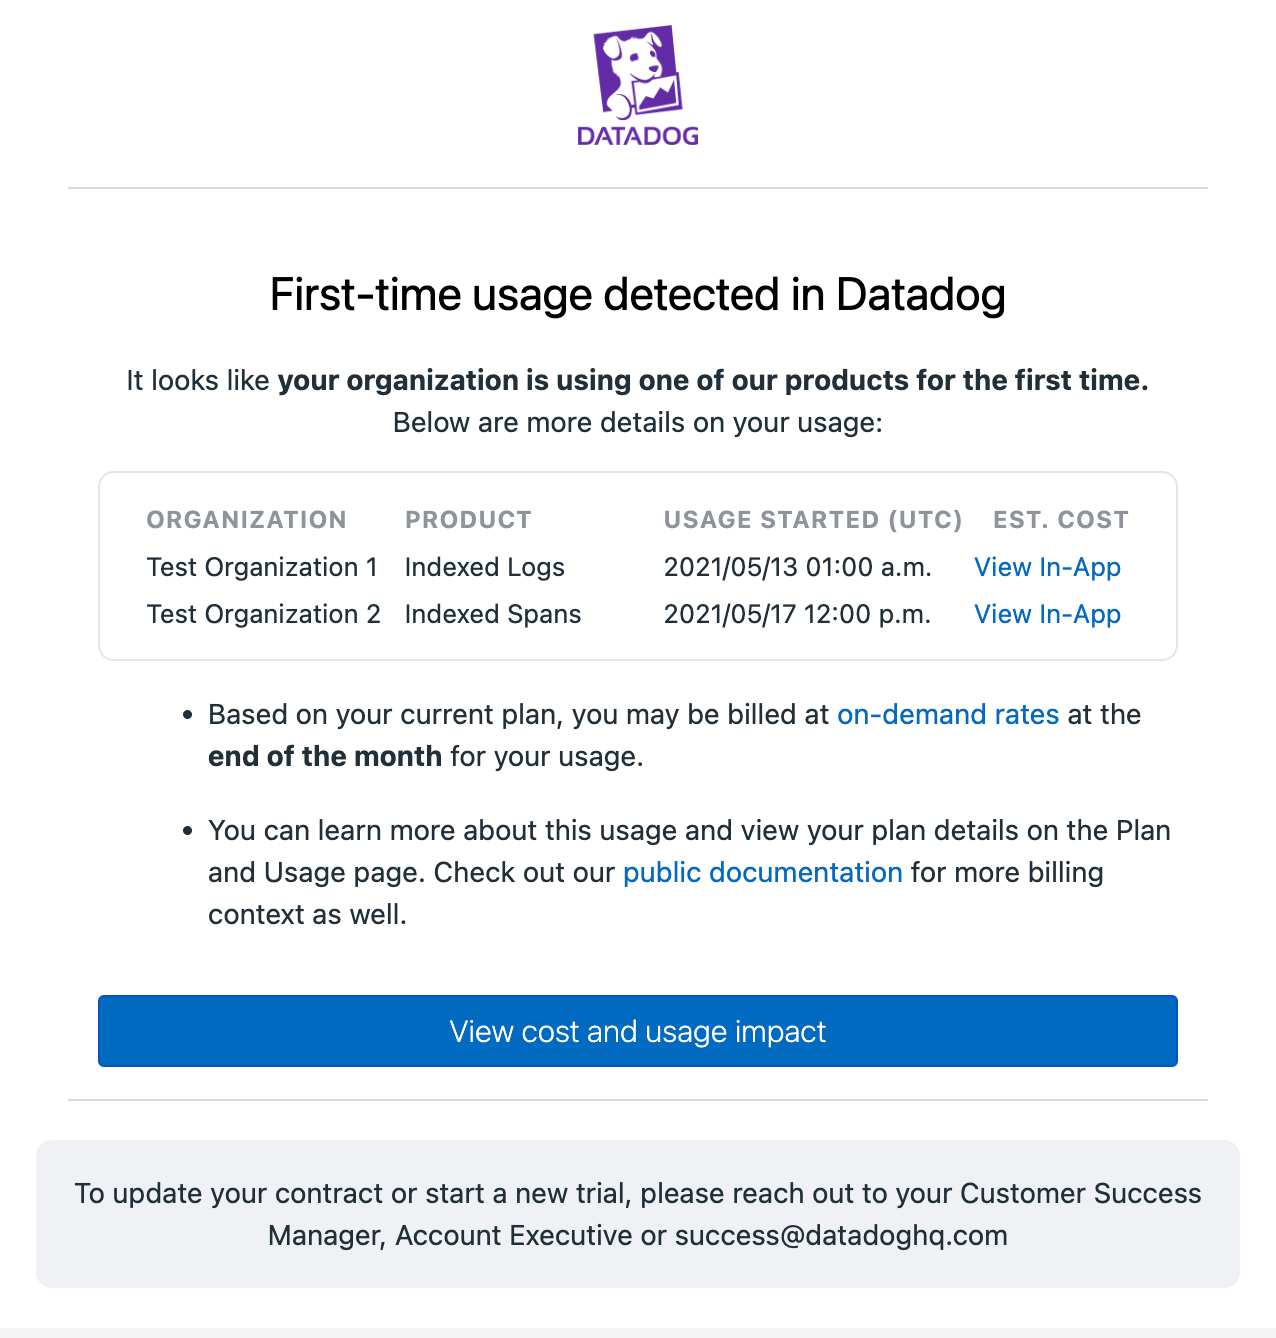
The first-time usage notifications feature sends email notifications when there is first-time billable usage for a new product not included in your current contract. Emails are sent approximately 48 hours after the usage first occurs during a given month.
After enabling the feature, a new Usage Notifications tab is added to the parent organization’s Plan and Usage page. On this tab, there is a list of all products covered by the functionality. Unchecking a box stops notifications for that product for all users within the account. If any first-time usage outside of your most recent active contract is detected, users do not receive a notification for any unchecked products.
Any user with Usage Notifications Read or Write permissions receives emails. For most organizations, this means any admins.
If your Datadog account is a multi-organization, parent organization users with permissions receive email notifications of usage in child organizations. These emails indicate which child organization generated the usage, and the product which usage was generated for. Child organization users with this permission receive emails for their organization only.
Troubleshooting
For technical questions, contact Datadog support.
For billing questions, contact your Customer Success Manager.
