- Essentials
- Getting Started
- Datadog
- Datadog Site
- DevSecOps
- Serverless for AWS Lambda
- Agent
- Integrations
- Containers
- Dashboards
- Monitors
- Logs
- APM Tracing
- Profiler
- Tags
- API
- Service Catalog
- Session Replay
- Continuous Testing
- Synthetic Monitoring
- Incident Management
- Database Monitoring
- Cloud Security Management
- Cloud SIEM
- Application Security Management
- Workflow Automation
- CI Visibility
- Test Visibility
- Intelligent Test Runner
- Code Analysis
- Learning Center
- Support
- Glossary
- Standard Attributes
- Guides
- Agent
- Integrations
- OpenTelemetry
- Developers
- Authorization
- DogStatsD
- Custom Checks
- Integrations
- Create an Agent-based Integration
- Create an API Integration
- Create a Log Pipeline
- Integration Assets Reference
- Build a Marketplace Offering
- Create a Tile
- Create an Integration Dashboard
- Create a Recommended Monitor
- Create a Cloud SIEM Detection Rule
- OAuth for Integrations
- Install Agent Integration Developer Tool
- Service Checks
- IDE Plugins
- Community
- Guides
- API
- Datadog Mobile App
- CoScreen
- Cloudcraft
- In The App
- Dashboards
- Notebooks
- DDSQL Editor
- Sheets
- Monitors and Alerting
- Infrastructure
- Metrics
- Watchdog
- Bits AI
- Service Catalog
- API Catalog
- Error Tracking
- Service Management
- Infrastructure
- Application Performance
- APM
- Continuous Profiler
- Database Monitoring
- Data Streams Monitoring
- Data Jobs Monitoring
- Digital Experience
- Real User Monitoring
- Product Analytics
- Synthetic Testing and Monitoring
- Continuous Testing
- Software Delivery
- CI Visibility
- CD Visibility
- Test Visibility
- Intelligent Test Runner
- Code Analysis
- Quality Gates
- DORA Metrics
- Security
- Security Overview
- Cloud SIEM
- Cloud Security Management
- Application Security Management
- AI Observability
- Log Management
- Observability Pipelines
- Log Management
- Administration
Graphing with JSON
Overview
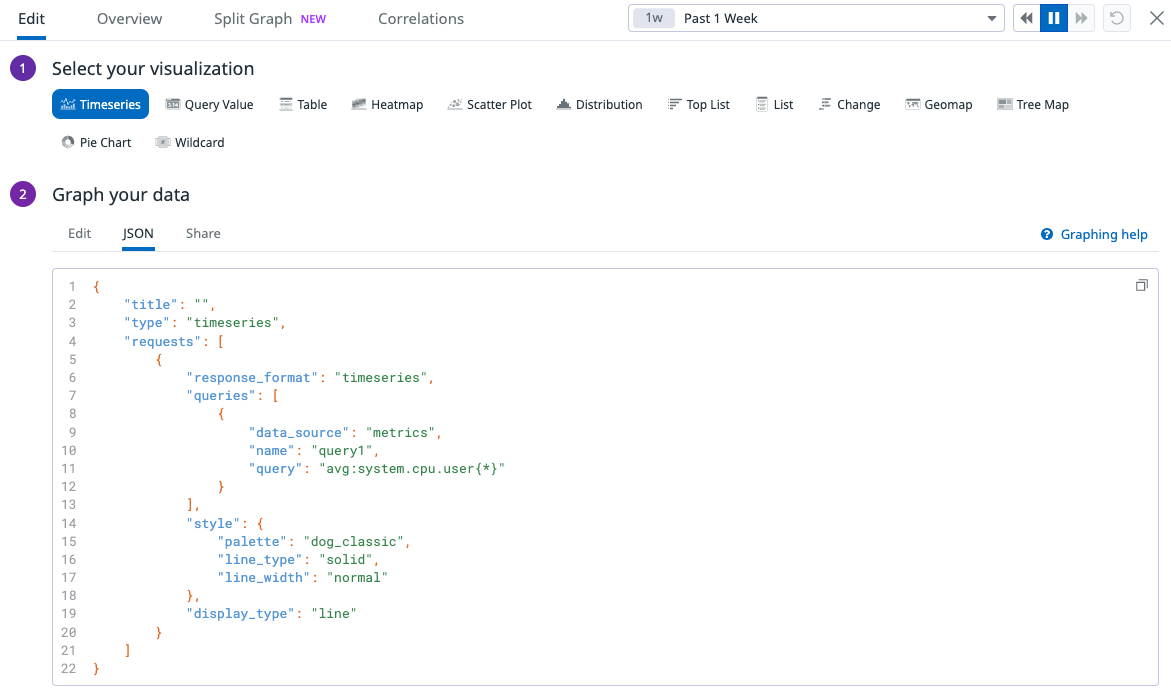
In addition to the GUI graph editor, you can use the JSON editor in your dashboard widgets to configure your visualizations. The schema displayed in the JSON editor mirrors the request body schema of the Dashboard API. For more information on the JSON parameters and required fields see the Dashboard API documentation.
Widget JSON schema
Find the widget type you want to add to your dashboard and apply the JSON fields listed in the respective documentation. For a full list of widget types, see the Widget index.
Y-Axis schema
The Datadog y-axis controls allow you to:
- Clip the y-axis to specific ranges
- Filter series either by specifying a percentage or an absolute value
- Change the y-axis scale from linear to log, sqrt, or power scale
Markers schema
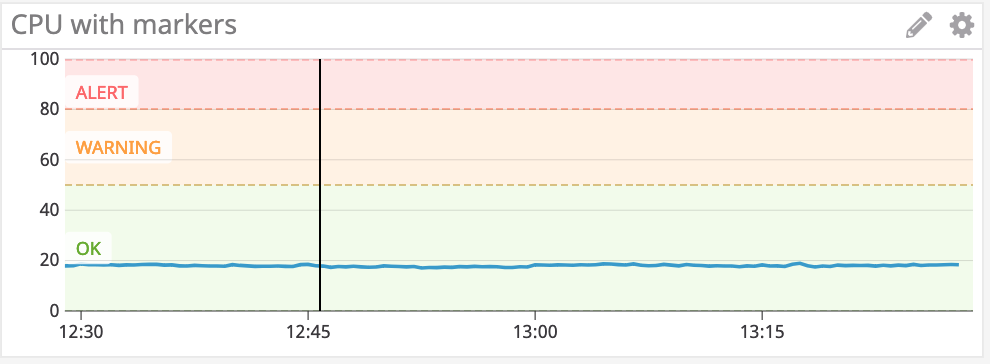
Markers allow you to add visual conditional formatting for your graphs. For example, ALERT, WARNING, or OK.
Template variable schema
Dashboard template variables apply a new scope to one or more graphs on your dashboard. This allows you to dynamically explore metrics across different sets of tags by using variables instead of specific tags. Learn more about template variable in the Datadog UI.
Further Reading
Additional helpful documentation, links, and articles:


