- Essentials
- Getting Started
- Datadog
- Datadog Site
- DevSecOps
- Serverless for AWS Lambda
- Agent
- Integrations
- Containers
- Dashboards
- Monitors
- Logs
- APM Tracing
- Profiler
- Tags
- API
- Service Catalog
- Session Replay
- Continuous Testing
- Synthetic Monitoring
- Incident Management
- Database Monitoring
- Cloud Security Management
- Cloud SIEM
- Application Security Management
- Workflow Automation
- CI Visibility
- Test Visibility
- Intelligent Test Runner
- Code Analysis
- Learning Center
- Support
- Glossary
- Standard Attributes
- Guides
- Agent
- Integrations
- OpenTelemetry
- Developers
- Authorization
- DogStatsD
- Custom Checks
- Integrations
- Create an Agent-based Integration
- Create an API Integration
- Create a Log Pipeline
- Integration Assets Reference
- Build a Marketplace Offering
- Create a Tile
- Create an Integration Dashboard
- Create a Recommended Monitor
- Create a Cloud SIEM Detection Rule
- OAuth for Integrations
- Install Agent Integration Developer Tool
- Service Checks
- IDE Plugins
- Community
- Guides
- API
- Datadog Mobile App
- CoScreen
- Cloudcraft
- In The App
- Dashboards
- Notebooks
- DDSQL Editor
- Sheets
- Monitors and Alerting
- Infrastructure
- Metrics
- Watchdog
- Bits AI
- Service Catalog
- API Catalog
- Error Tracking
- Service Management
- Infrastructure
- Application Performance
- APM
- Continuous Profiler
- Database Monitoring
- Data Streams Monitoring
- Data Jobs Monitoring
- Digital Experience
- Real User Monitoring
- Product Analytics
- Synthetic Testing and Monitoring
- Continuous Testing
- Software Delivery
- CI Visibility
- CD Visibility
- Test Visibility
- Intelligent Test Runner
- Code Analysis
- Quality Gates
- DORA Metrics
- Security
- Security Overview
- Cloud SIEM
- Cloud Security Management
- Application Security Management
- AI Observability
- Log Management
- Observability Pipelines
- Log Management
- Administration
Context Links
Overview
Dashboards collect data from multiple sources and display this data as visualizations.
You can attach dashboards to monitor notifications, use them as screenboards to observe key technical or business indicators, or reference them in runbooks to provide additional context. With Dashboards, you can see snapshots of the current state of your platform as well as interactions, so you can preemptively see issues and analyze them more deeply in specialized pages.
The video below demonstrates a user looking at an overview dashboard for a web application. The user identifies a spike on a technical metric, zooms in for details, and accesses the underlying host dashboard to check for possible root causes.
This guide introduces context links in your dashboards and covers the following:
- How context links work, and how to adapt them to your exact needs.
- Example use cases of the context links configuration.
Introduction to context links
Context links bridge dashboard widgets with other pages in Datadog, as well as the third-party applications you have integrated into your workflows.
Users with edit permissions to dashboards can configure which links are accessible in the link list.
Default context links
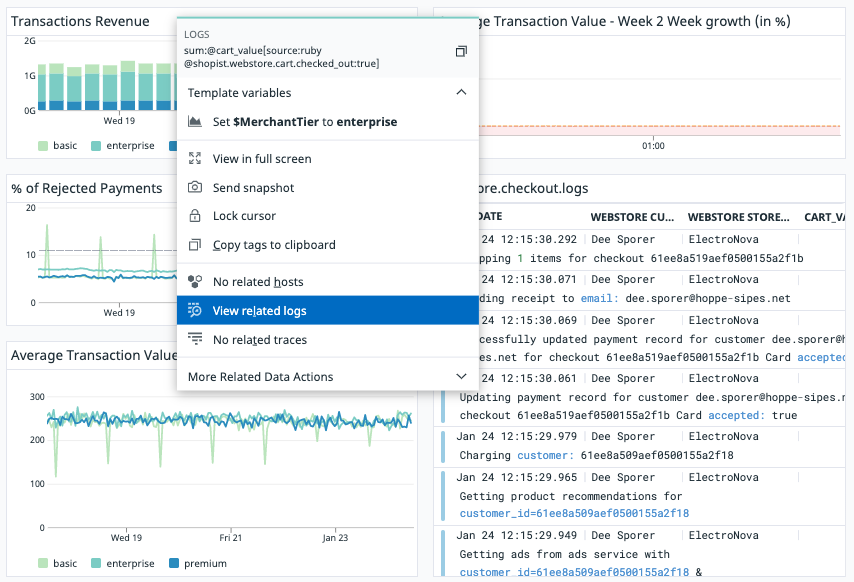
By default, the widget menu displays links to your host, traces, and logs—along with links that correspond to the widget’s data sources. For example, the menu displays a link to the RUM Explorer if your widget uses RUM data. Click More Related Data Actions to see additional links in the dropdown menu.
The widget contains links to the following pages:
| Link | Description |
|---|---|
| Hosts | Links to the Host Map if series consists of more than one host. Links to the Host Dashboard if series consists of one host. |
| Containers | Links to the Live Container page. |
| Processeses | Links to the Live Process page. |
| APM Traces | Opens a side panel displaying underlying traces that link to the Trace Explorer. |
| RUM Events | Links to the RUM Explorer. |
| Profiles | Links to the APM Profile Explorer. |
| Logs | Opens a side panel displaying underlying logs that link to the Log Explorer. |
When applicable, context links embed:
- A filter that combines the widget filter(s) with template variables (if any) and, for grouped-by queries, the one series users click on.
- A time range. For timeseries and heatmap widgets, the time range corresponds to the time bucket for the data point. For other widgets, the time range is the full widget time range.
Customize context links
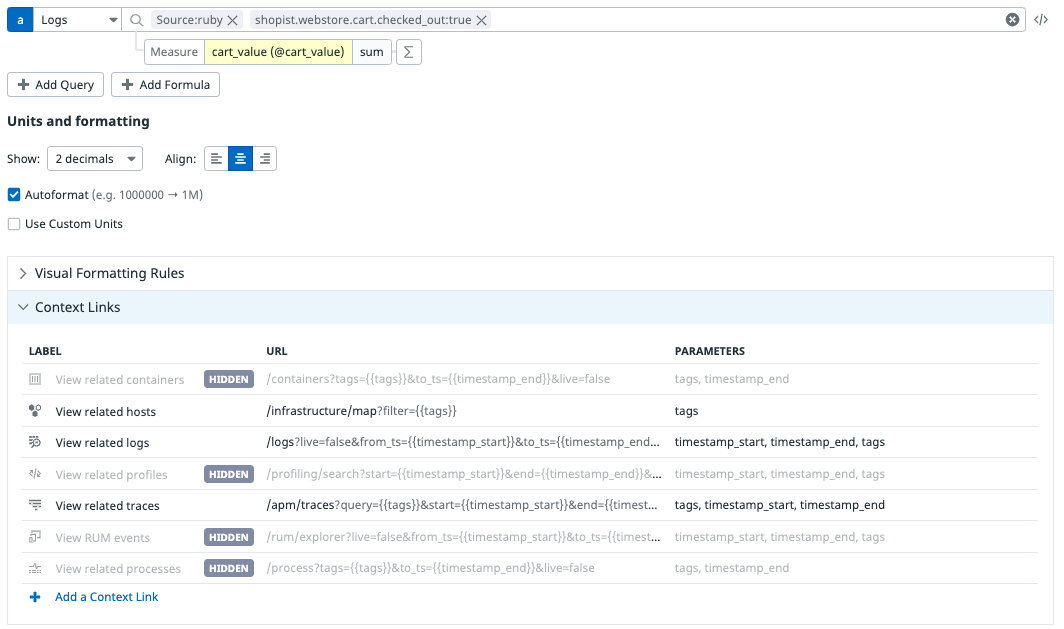
For any generic widget, enter its edit mode to access its Context Links section. You can create your own context links, override default links, and promote or hide links.
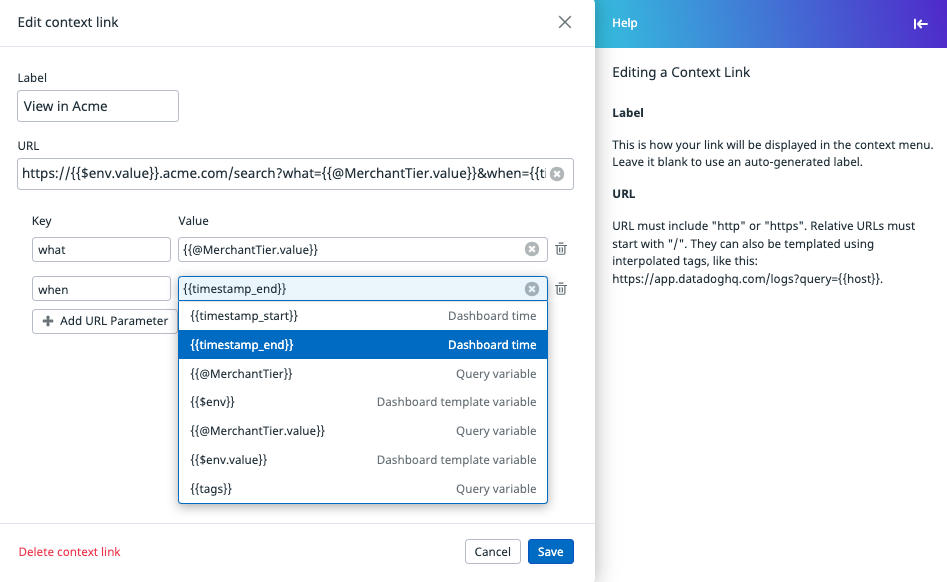
To define custom links or override the default links, specify the link name in the Label field and the link path in the URL field. Click + Add URL Parameter to use the key-value helper.
Context Links variables
Available variable types for context links include:
- Time range variables
{{timestamp_start}}and{{timestamp_end}}. These variables correspond to the time range of the widget. - Query variables (
{{@MerchantTier}}and{{@MerchantTier.value}}in the example above). These variables are for widgets with grouped queries, and identify the specific group a user clicks on. - Dashboard template variables (
{{$env}}and{{$env.value}}in the example above). These variables identify the current value in use for the template variable when user clicks. {{tags}}, the default combination of all the variables above.
When you have to choose between {{something}} and {{something.value}}:
{{something}}returns the value prefixed by its key. For example,env:prod.{{something.value}}returns the raw value. For example,prod.- See the example use case to configure multiple variables.
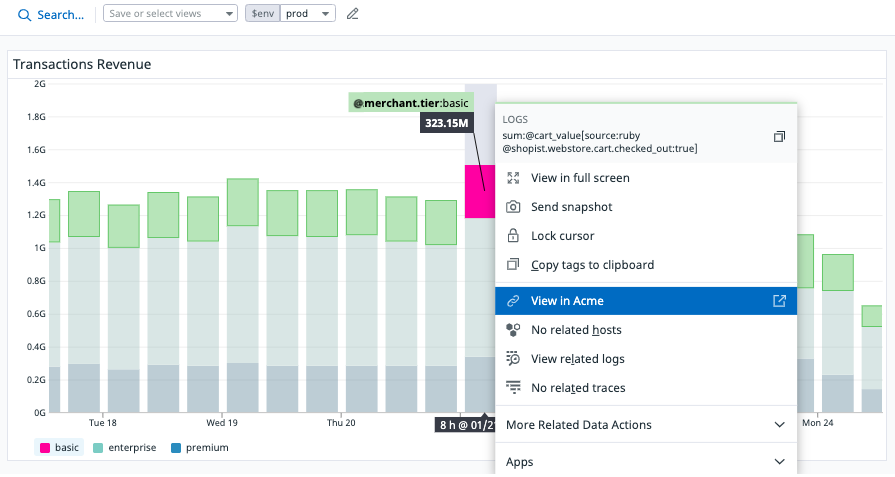
In this example, when you click View in Acme, the link directs you to https://prod.acme.io/search?what=basic&when=1643021787564.
The context link:
- Replaces
{{env.value}}withprod - Replaces
{{@MerchantTier.value}}withbasic - And replaces
{{timestamp_end}}with1643021787564.
Bootstrap context link with copy-paste
For a complex context link that encodes a wide variety of parameters, it can be more convenient to copy-and-paste the entire URL in the URL field to bootstrap the configuration and rework the variables from there.
URL encoding
Datadog handles URL encoding in context links.
The example above displays a link with a query parameter, status:error source:nginx {{@shopist.webstore.merchant.tier}}. Here, {{@shopist.webstore.merchant.tier}} is interpreted as @shopist.webstore.merchant.tier:basic. The full query parameter is then translated into &query=status%3Aerror%20source%3Anginx%20%40shopist.webstore.merchant.tier%3Abasic.
Example use cases
This section contains examples that demonstrate how you can take advantage of context links to integrate your dashboards into your workflows.
Dashboards links to a customer support solution
The following example explains how to create a link from a user in a dashboard to their corresponding Zendesk user page.
Context
You use Datadog to monitor your merchant website. Your customer support team uses a dashboard that your Frontend and Security teams set up to proactively identify your most engaged customers—or customers with a troublesome experience, and potentially reach out to them.
To accelerate this troubleshooting workflow, the customer support team would like a direct connection between dashboards and a support solution, for example: Zendesk.
Approach
The primary ID that tracks logged users across your platform in Datadog is the user email, which is a facet that appears in some dashboard widgets.
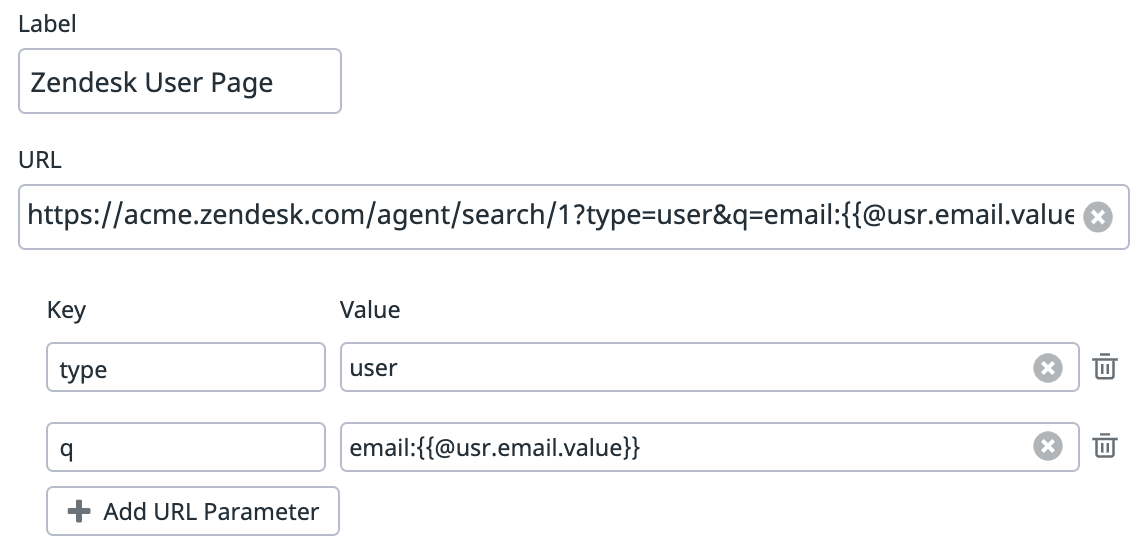
A typical Zendesk link to search for users is https://acme.zendesk.com/agent/search/1?type=user&q=email%3Ashane%40doe.com, where the user’s email is a search parameter.
Add a variable in the URL, and the templated link becomes https://acme.zendesk.com/agent/search/1?type=user&q=email:{{@usr.email.value}}.
Result
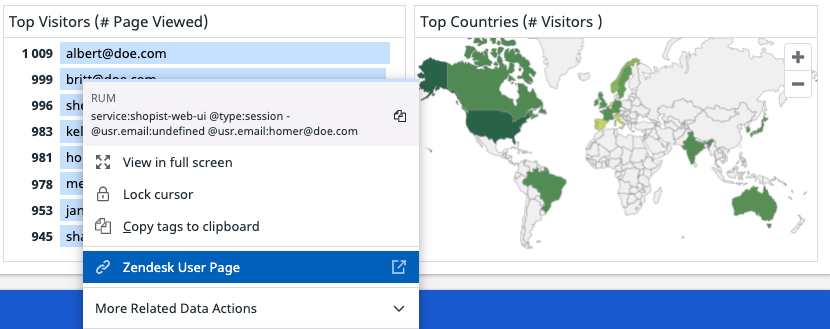
Your customer support team’s dashboard widget contains a context link that takes you into the customer support platform with the appropriate context.
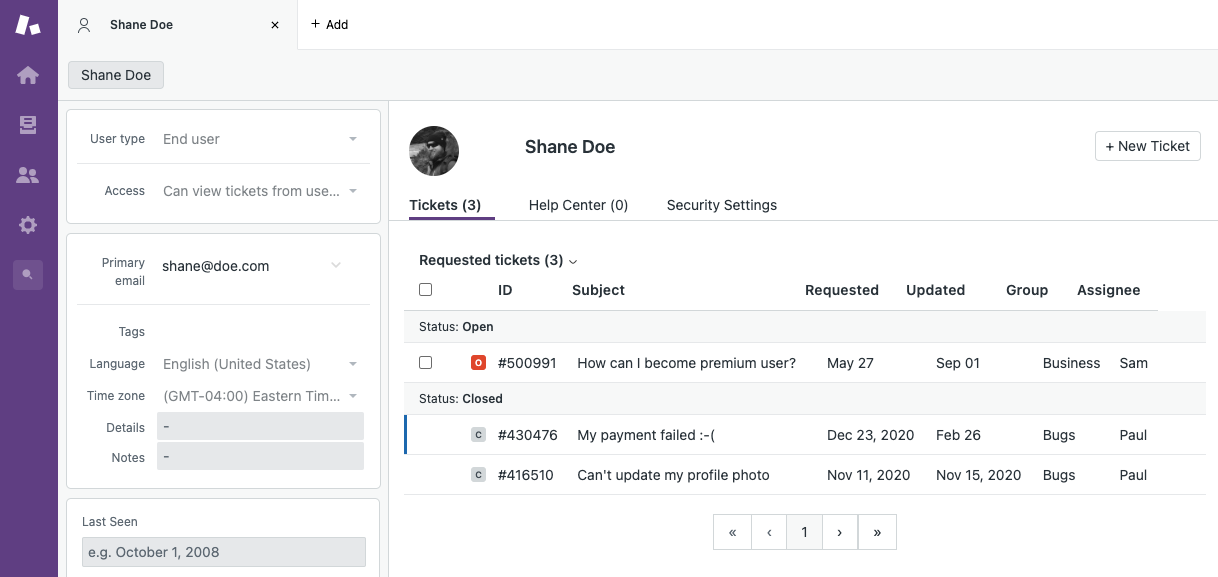
Clicking the Zendesk User Page link directs you to this user’s page in Zendesk.
Dashboard links to the AWS Console
The following example explains how to create a link from a host in a dashboard widget to its corresponding Amazon EC2 instance page in the AWS Console.
Context
Your platform is hosted on Amazon EC2 instances, and the procedures to upscale and downscale your platform are mostly manual.
You have a dashboard where you’ve consolidated key health metrics for your infrastructure in Datadog.
To accelerate this operations workflow, you would like a direct connection between this dashboard and your AWS Console—for example, to upgrade from t2.micro to t2.large.
Approach
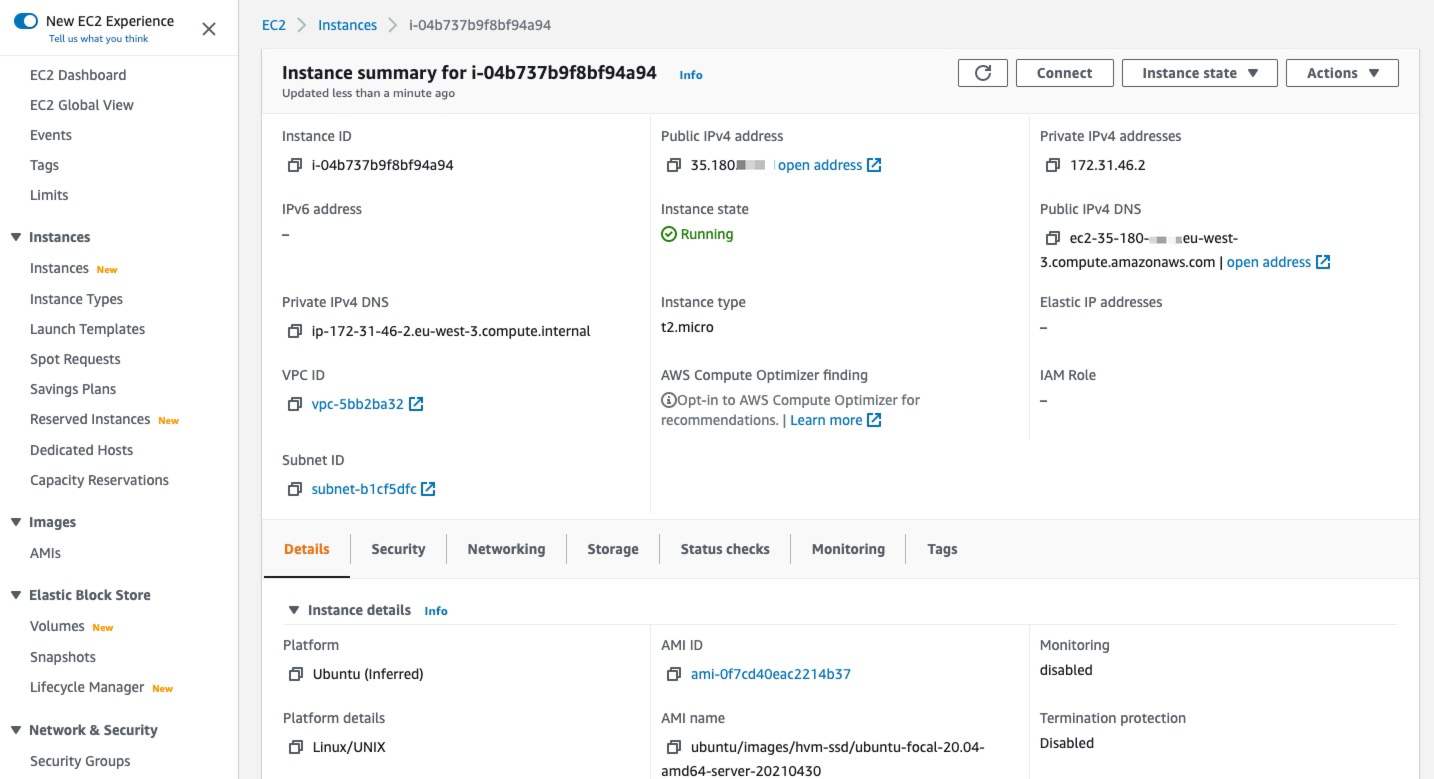
A typical Amazon EC2 instance summary link is https://eu-west-3.console.aws.amazon.com/ec2/v2/home?region=eu-west-3#InstanceDetails:instanceId=i-04b737b9f8bf94a94, where you can read:
eu-west-3: The data center region displayed as a subdomain and a URL parameter.i-04b737b9f8bf94a94: The host ID displayed as a hash parameter.
If your platform only runs on one region, inject the host ID into the context link template so that https://eu-west-3.console.aws.amazon.com/ec2/v2/home?region=eu-west-3#InstanceDetails:instanceId={{host.value}}.
If your platforms runs on multiple regions, your widget configuration depends on the following:
- If the region is part of the query aggregation (for example, in the screenshot below), the templated link is
https://{{region.value}}.console.aws.amazon.com/ec2/v2/home?region={{region.value}}#InstanceDetails:instanceId={{host.value}}, where{{region.value}}is a query variable.
- If the region is part of the query aggregation (for example, in the screenshot below), the templated link is
https://{{$region.value}}.console.aws.amazon.com/ec2/v2/home?region={{$region.value}}#InstanceDetails:instanceId={{host.value}}, where{{region.value}}is a template variable.
Result
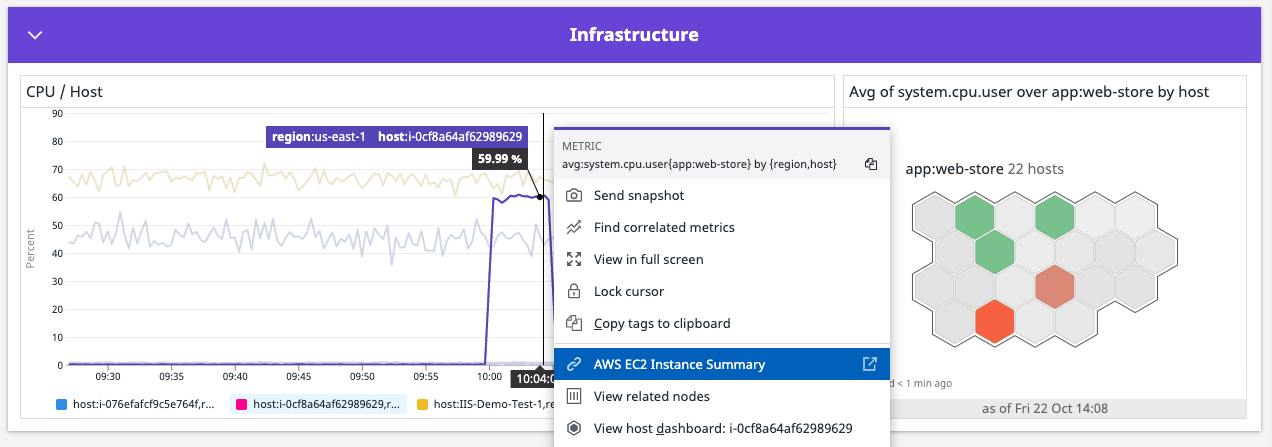
Your dashboard widget contains a link that takes you to the appropriate host in the AWS Console.
Clicking the Amazon EC2 Instance Summary link directs you to the Amazon EC2 instance page in the AWS Console.
Dashboard links to saved views and remapped attributes in Datadog
The following example explains how to create a link from a RUM event in a dashboard widget to its corresponding logs.
Context
You monitor your corporate website with Datadog. You may use RUM to understand your users and Logs to oversee your API Gateways from a more technical perspective.
Your frontend engineers typically use dashboards with high-level RUM insights. You API Gateways team maintains a Saved View in the Log Explorer, which is a fine-tuned perspective that the frontend monitoring team relies on to monitor information that is relevant to them.
To accelerate this troubleshooting workflow, the frontend monitoring teams would like to access the saved view with the current context of the dashboard.
Approach to Saved Views
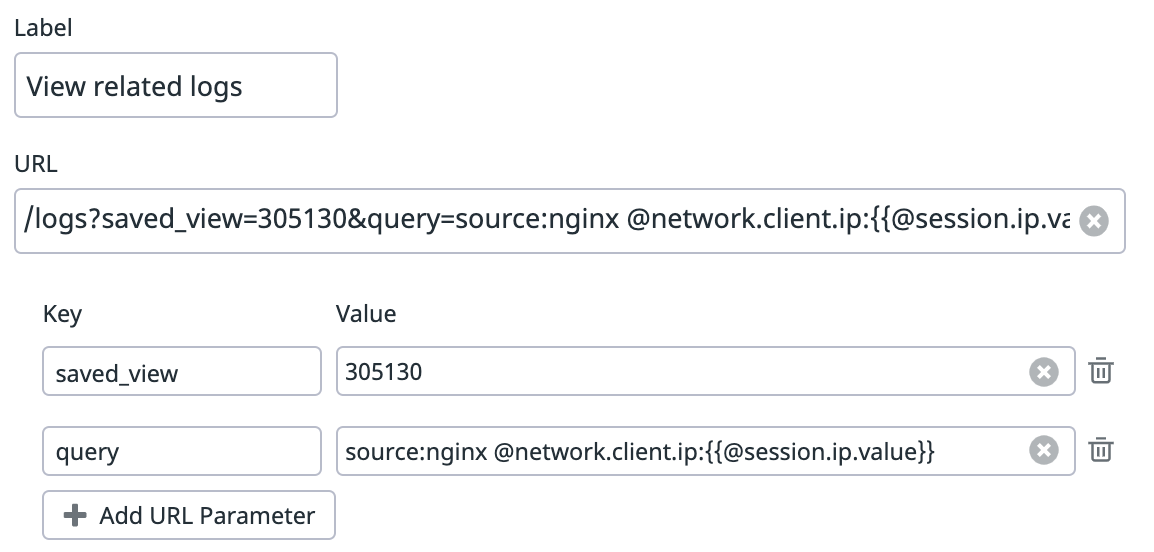
Saved Views define the default query, visualization, and configuration options in the Log Explorer. A typical saved view link is https://app.datadoghq.com/logs?saved_view=305130, which encodes the Log Explorer URL under the hood.
You can append the saved view’s short link to override any parameter in the resulting Log Explorer URL.
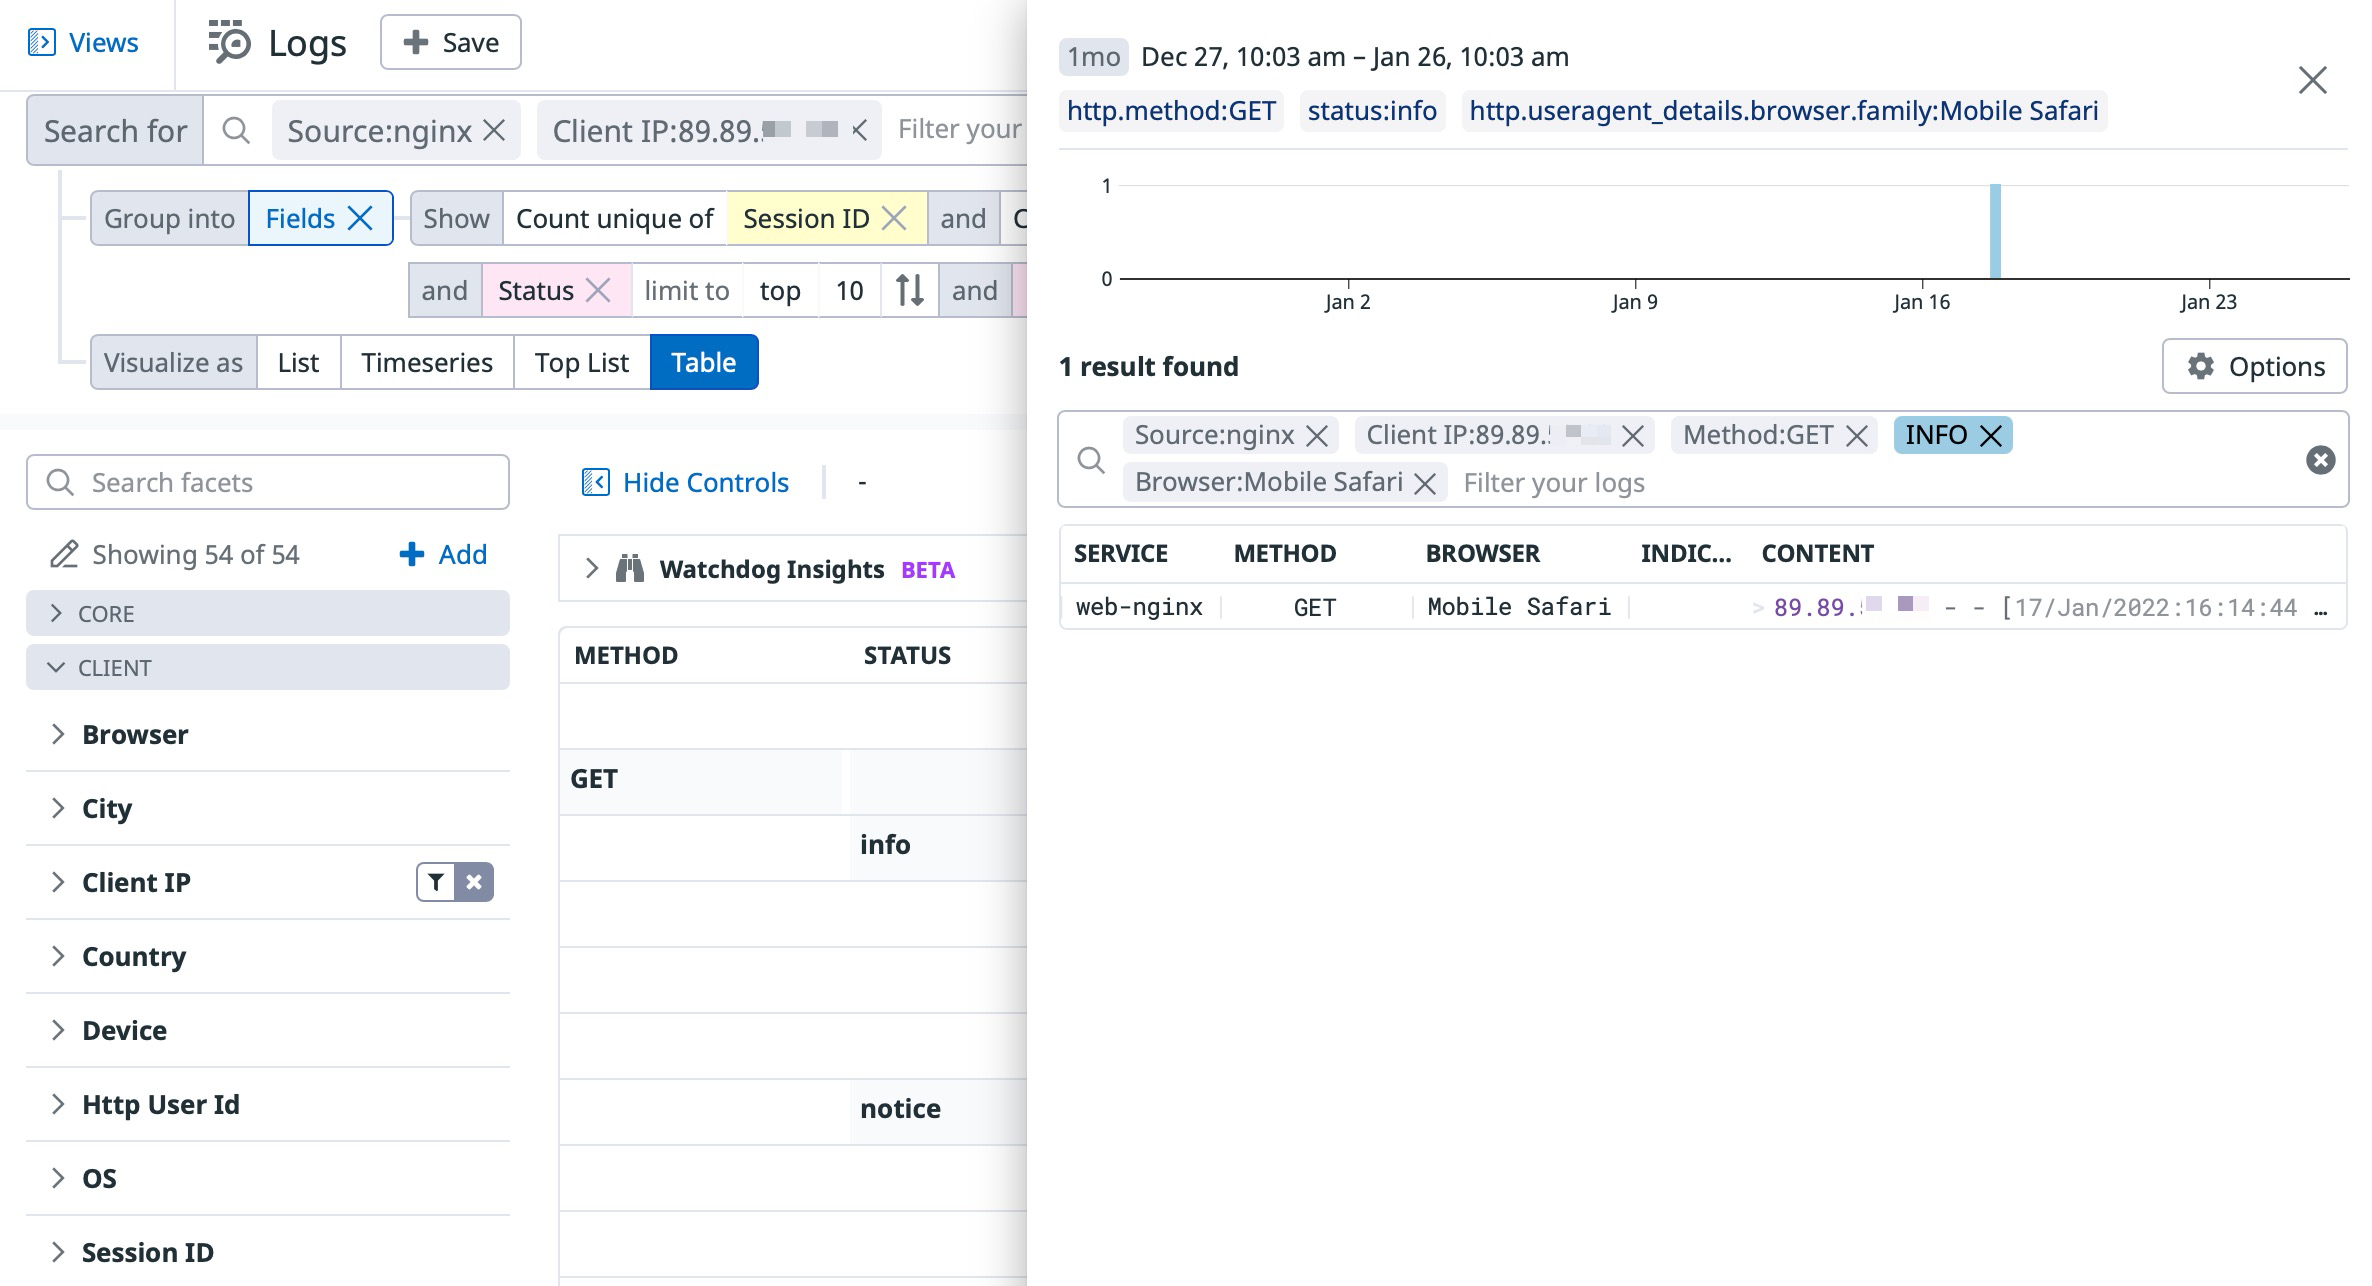
For example, https://app.datadoghq.com/logs?saved_view=305130&query=@source:nginx @network.client.ip:123.123.12.1 takes you to the Log Explorer as if you opened the saved view first, but the default query filter is replaced with @source:nginx @network.client.ip:123.123.12.1.
Approach to remapping attributes
If navigation on your website is anonymous, you may use an IP address as a proxy to identify your users.
You would like to identify the @session.ip attribute from your RUM events with the @network.client.ip attribute from your logs. The two attributes have different names because they generally have different meanings, but in this context of authentication logs, you can identify both.
To do so, inject the @session.ip in a filter based on @network.client.ip, and build the appropriate filter @network.client.ip:{{@session.ip.value}}.
For a RUM dashboard widget displaying insights per session IP and for specific countries, follow this link configuration.
Result
As the API Gateways team updates the saved view to account for the latest updates on incoming logs, the context link remains up-to-date.
Remapping the IP address creates a context link that connects your RUM events with corresponding logs.
Configure multiple variables
The following example explains how to configure multiple variables and conditions in your context link query.
Context
Add context links to investigate specific logs or conditions.
- You have multiple tag values with the same context (for example,
env:production OR env:prod). - You want to filter down logs to multiple conditions (for example,
env:prod AND service:backend)
Approach
After you select the template variables you want to troubleshoot, the context link configuration takes those template variables and inserts them into the query. Note: The syntax and the parenthesis enclosure impacts the query.
For example, if you want to configure a context link with service:backend AND (env:production OR env:prod), use the following configuration:
service:backend (env:{{$env.value}})
Result
The parenthesis translates the (env:{{$env.value}}) to (env:*) which allows you to enter multiple variables into your context links query.
Further Reading
Additional helpful documentation, links, and articles:
