- Essentials
- Getting Started
- Datadog
- Datadog Site
- DevSecOps
- Serverless for AWS Lambda
- Agent
- Integrations
- Containers
- Dashboards
- Monitors
- Logs
- APM Tracing
- Profiler
- Tags
- API
- Service Catalog
- Session Replay
- Continuous Testing
- Synthetic Monitoring
- Incident Management
- Database Monitoring
- Cloud Security Management
- Cloud SIEM
- Application Security Management
- Workflow Automation
- CI Visibility
- Test Visibility
- Intelligent Test Runner
- Code Analysis
- Learning Center
- Support
- Glossary
- Standard Attributes
- Guides
- Agent
- Integrations
- OpenTelemetry
- Developers
- Authorization
- DogStatsD
- Custom Checks
- Integrations
- Create an Agent-based Integration
- Create an API Integration
- Create a Log Pipeline
- Integration Assets Reference
- Build a Marketplace Offering
- Create a Tile
- Create an Integration Dashboard
- Create a Recommended Monitor
- Create a Cloud SIEM Detection Rule
- OAuth for Integrations
- Install Agent Integration Developer Tool
- Service Checks
- IDE Plugins
- Community
- Guides
- API
- Datadog Mobile App
- CoScreen
- Cloudcraft
- In The App
- Dashboards
- Notebooks
- DDSQL Editor
- Sheets
- Monitors and Alerting
- Infrastructure
- Metrics
- Watchdog
- Bits AI
- Service Catalog
- API Catalog
- Error Tracking
- Service Management
- Infrastructure
- Application Performance
- APM
- Continuous Profiler
- Database Monitoring
- Data Streams Monitoring
- Data Jobs Monitoring
- Digital Experience
- Real User Monitoring
- Product Analytics
- Synthetic Testing and Monitoring
- Continuous Testing
- Software Delivery
- CI Visibility
- CD Visibility
- Test Visibility
- Intelligent Test Runner
- Code Analysis
- Quality Gates
- DORA Metrics
- Security
- Security Overview
- Cloud SIEM
- Cloud Security Management
- Application Security Management
- AI Observability
- Log Management
- Observability Pipelines
- Log Management
- Administration
Database Monitoring
Join an enablement webinar session
With Database Monitoring, learn how to quickly pinpoint costly and slow queries. Drill into precise execution details to address bottlenecks.
Datadog Database Monitoring provides deep visibility into databases across all of your hosts. Dig into historical query performance metrics, explain plans, and host-level metrics all in one place, to understand the health and performance of your databases and troubleshoot issues as they arise.
Getting started
Datadog Database Monitoring supports self-hosted and managed cloud versions of Postgres, MySQL, Oracle, SQL Server and MongoDB. To get started with Datadog Database Monitoring, configure your database and install the Datadog Agent. For setup instructions, select your database technology:
Postgres
MySQL
Oracle
SQL Server
MongoDB
Database Monitoring for MongoDB is in public beta. If you are interested in participating, reach out to your Datadog Customer Success Manager.
Explore Datadog Database Monitoring
Navigate to Database Monitoring in Datadog.
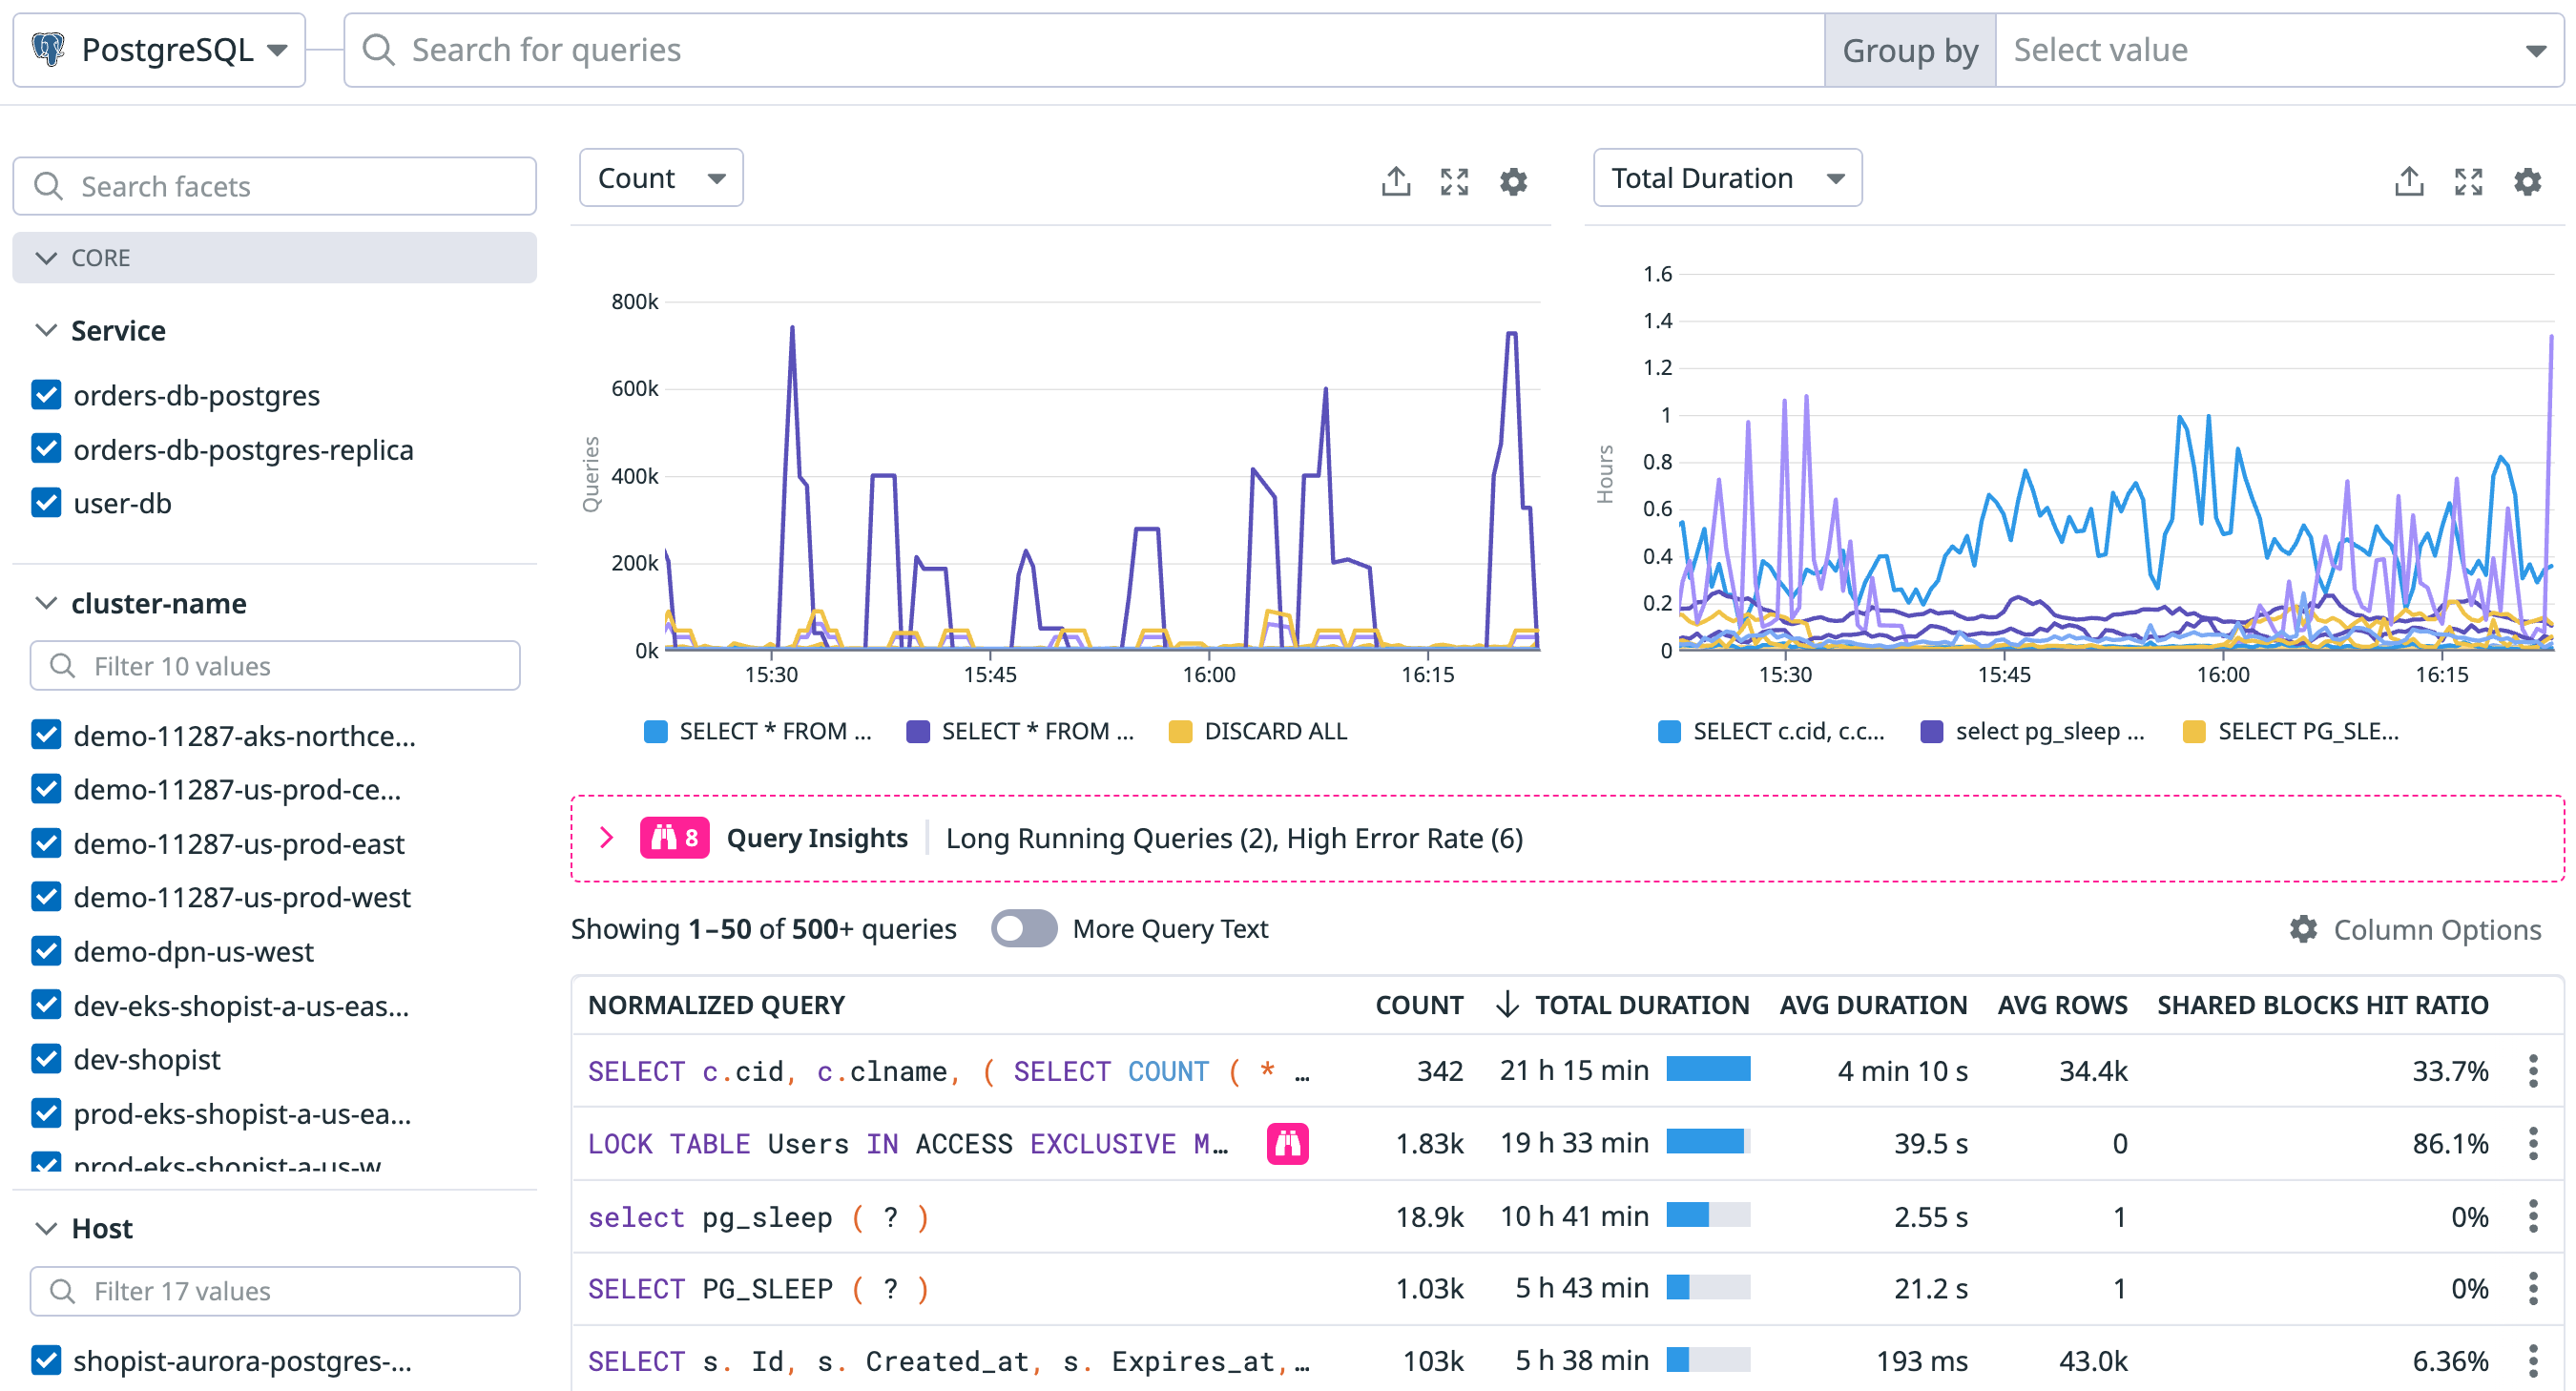
Dig into query performance metrics
The Query Metrics view shows historical query performance for normalized queries. Visualize performance trends by infrastructure or custom tags such as datacenter availability zone, and set alerts for anomalies.
- Identify slow queries and which queries are consuming the most time.
- Show database-level metrics not captured by APM such as rows updated/returned.
- Filter and group queries by arbitrary dimensions such as team, user, cluster, and host.
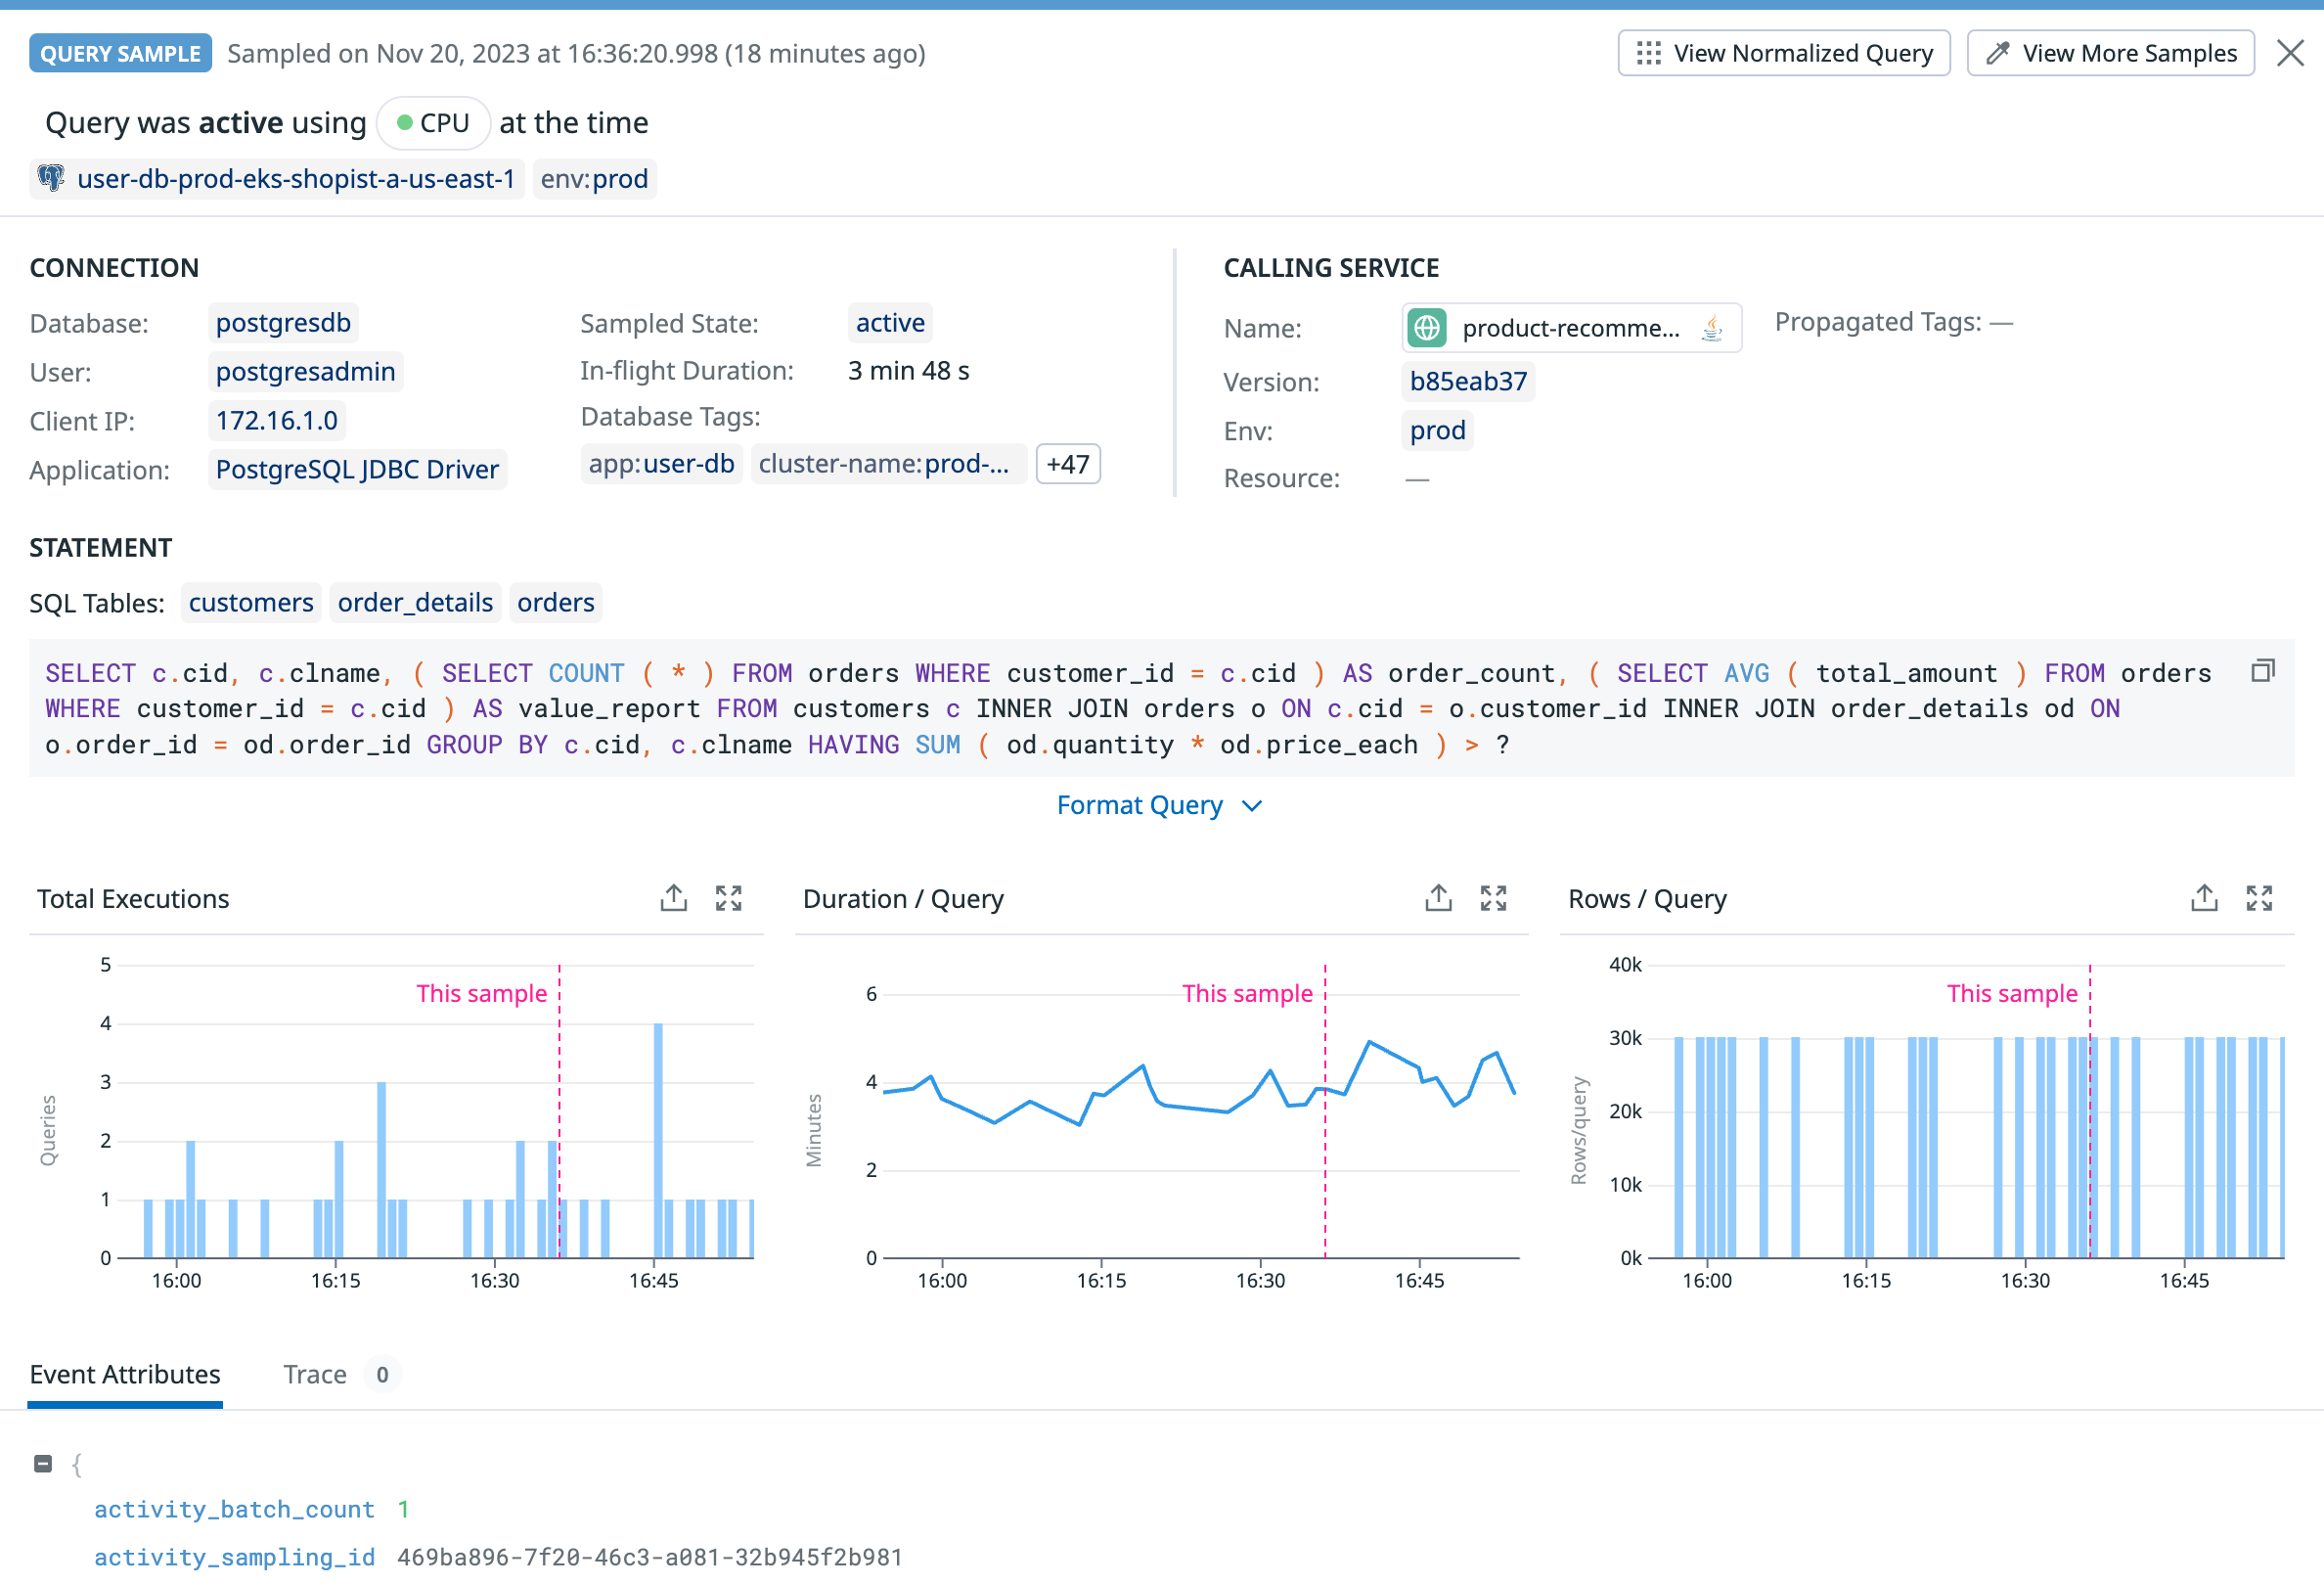
Explore query samples
The Query Samples view helps you understand which queries are running at a given time. Compare each execution to the average performance of the query and related queries.
- Identify unusually slow but infrequent queries not captured by metrics.
- Find outliers in a query’s execution time or execution cost.
- Attribute a specific query execution to a user, application, or client host.
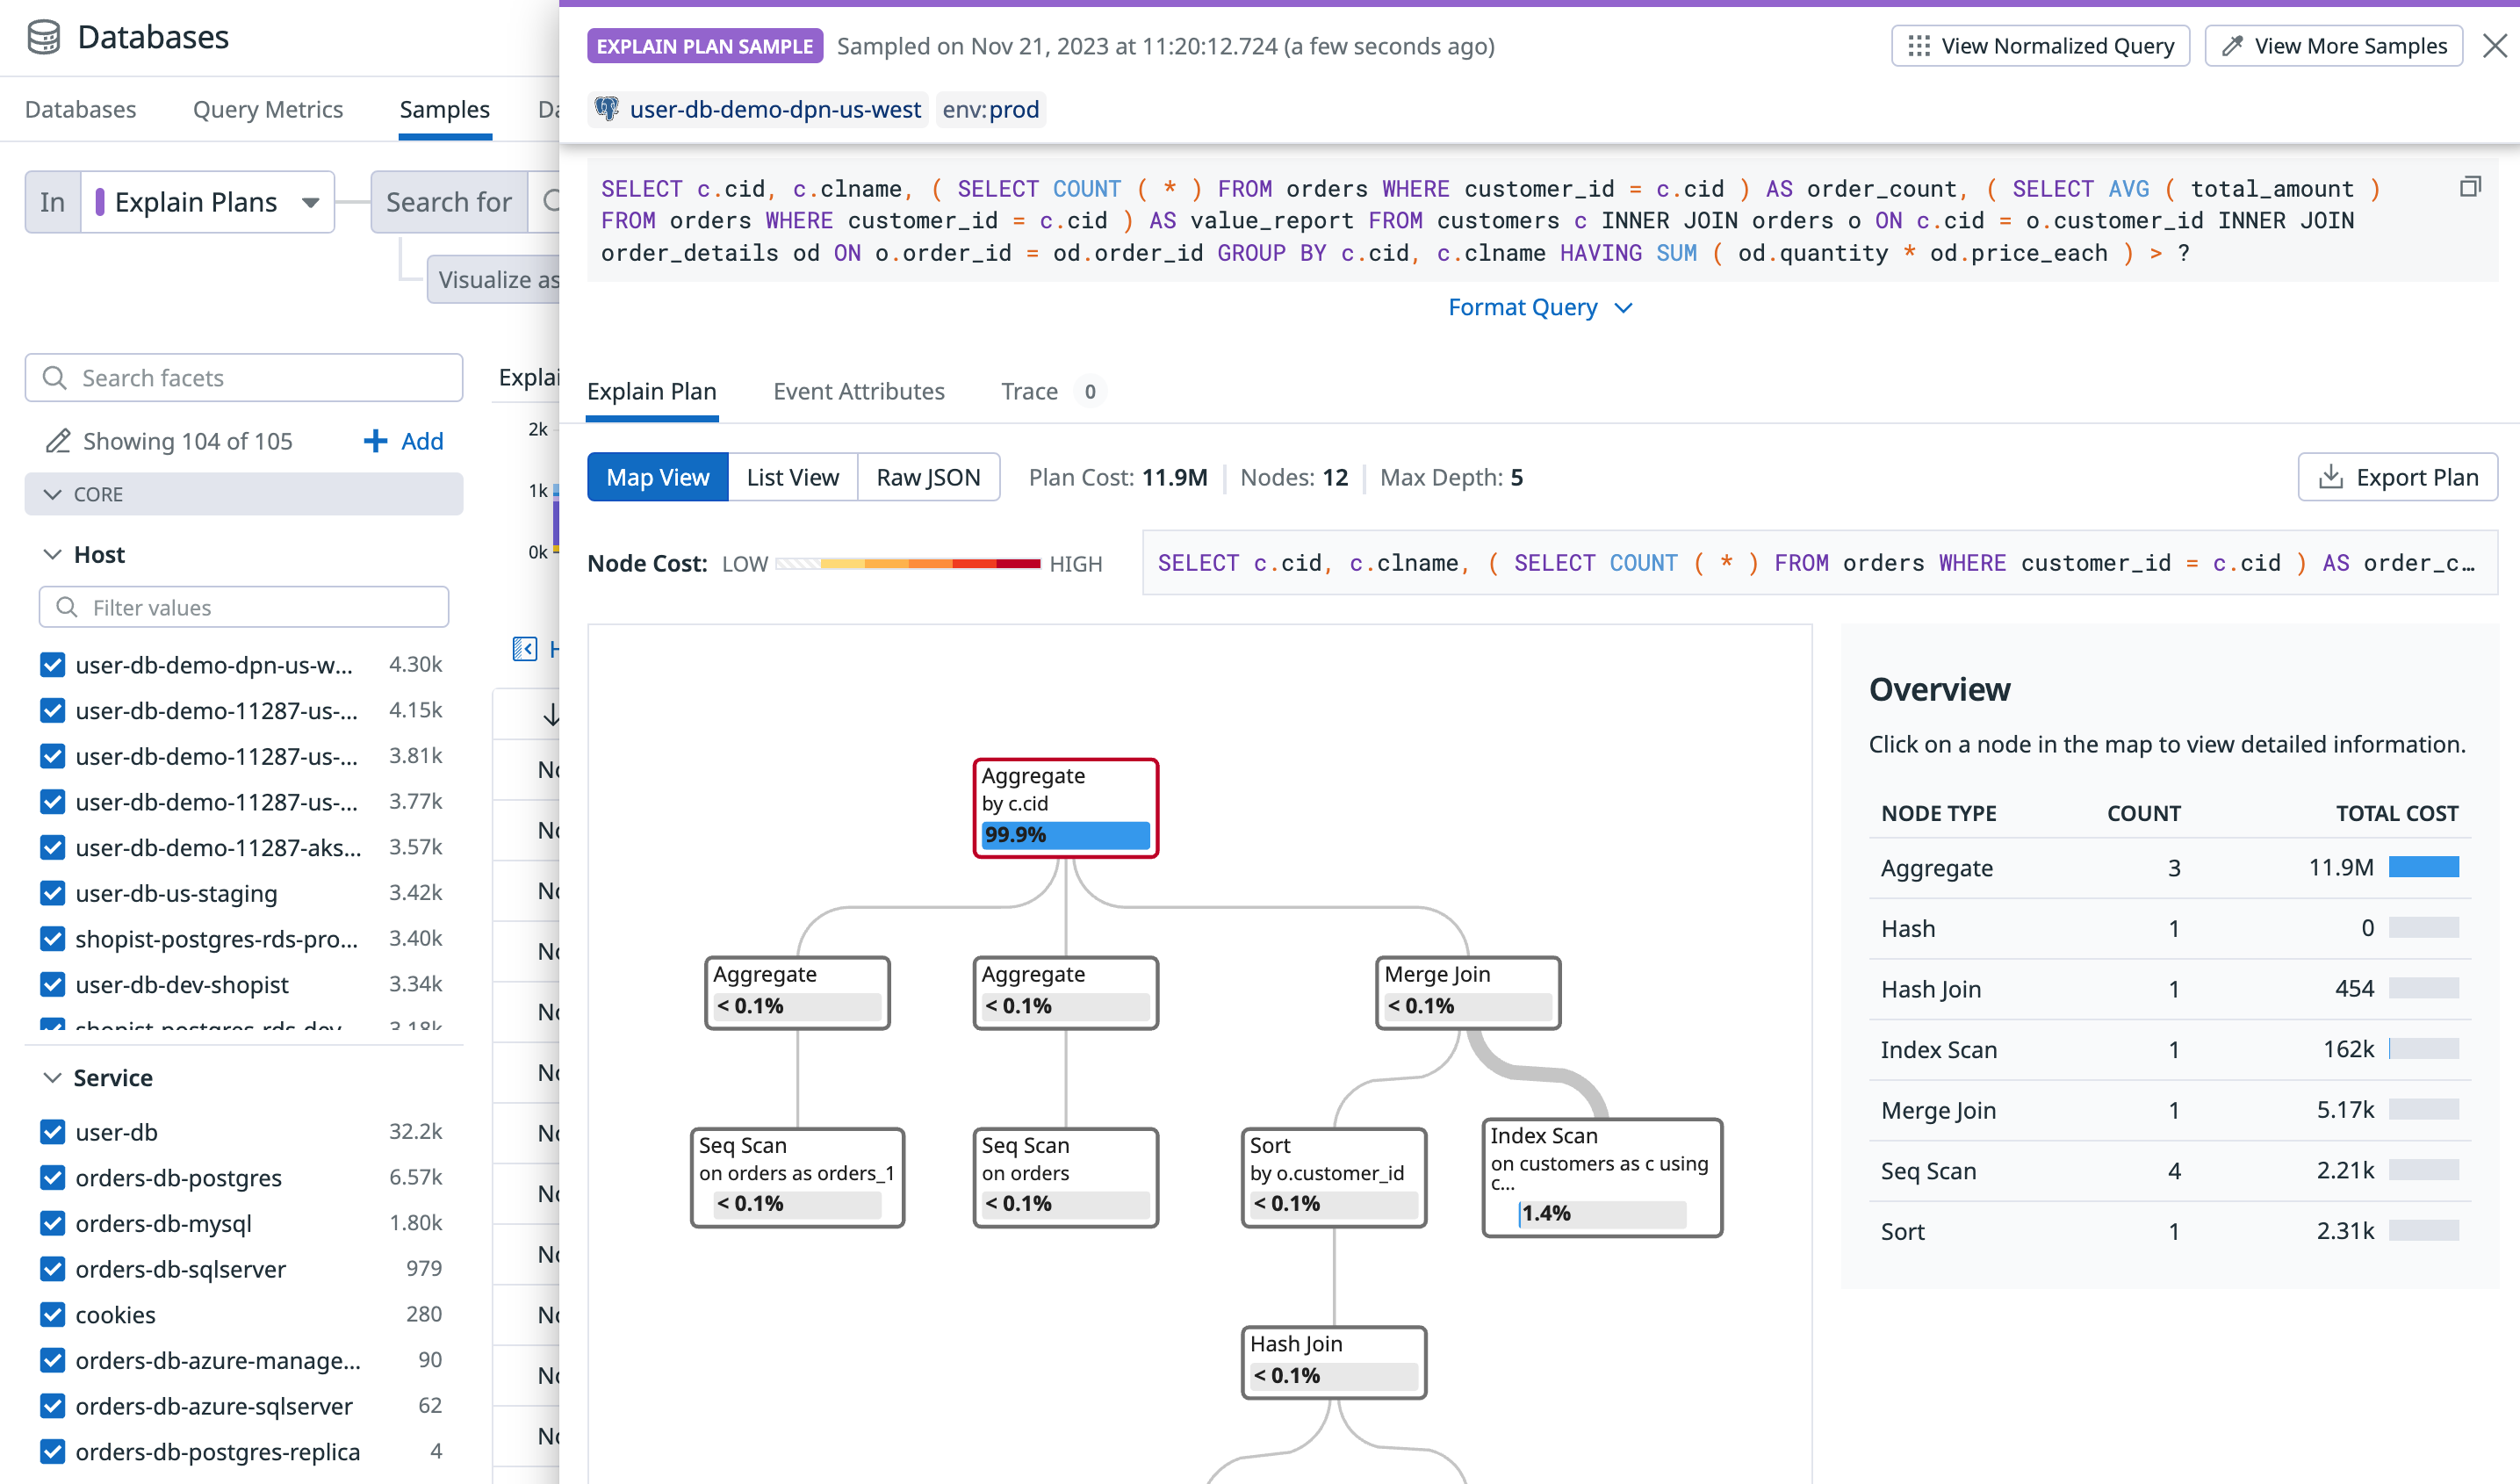
Understand before you run
Explain Plans help you understand how the database plans to execute your queries.
- Step through each operation to identify bottlenecks.
- Improve query efficiency and save on costly sequential scans on large tables.
- See how a query’s plan changes over time.
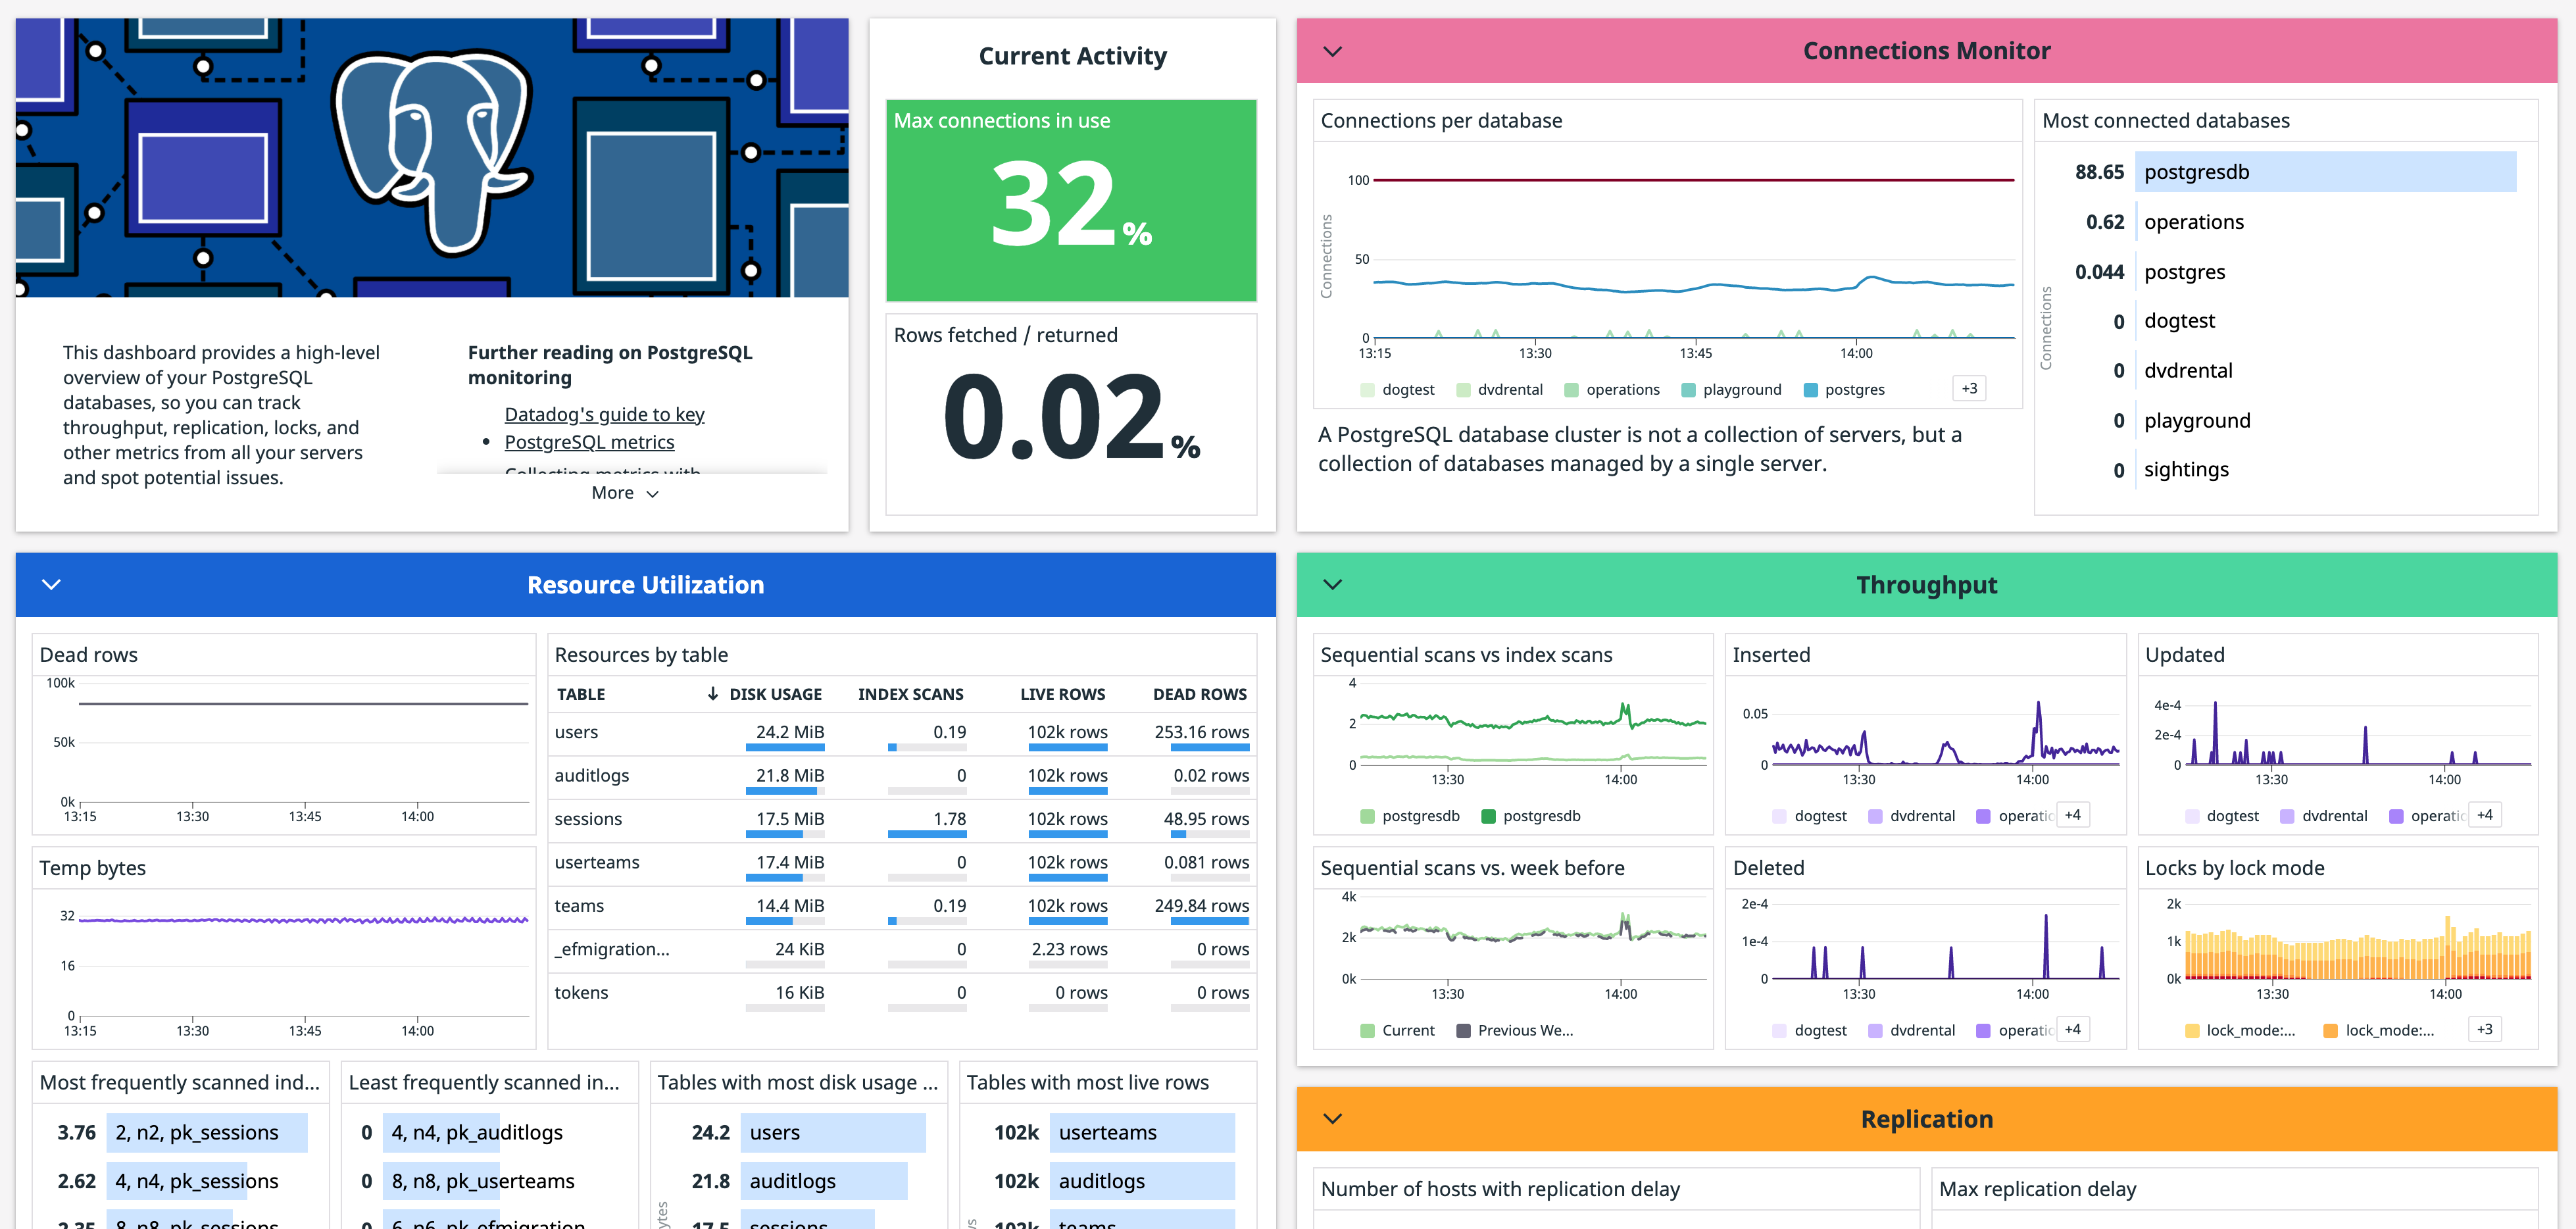
Visualize everything on enriched dashboards
Quickly pinpoint problem areas by viewing database and system metrics together on enriched integration dashboards for both self-hosted and cloud-managed instances. Clone dashboards for customization and enhancement with your own custom metrics. Click the Dashboards link at the top of the Query Metrics and Query Samples pages to go to the Database Monitoring dashboards.
Optimize host health and performance
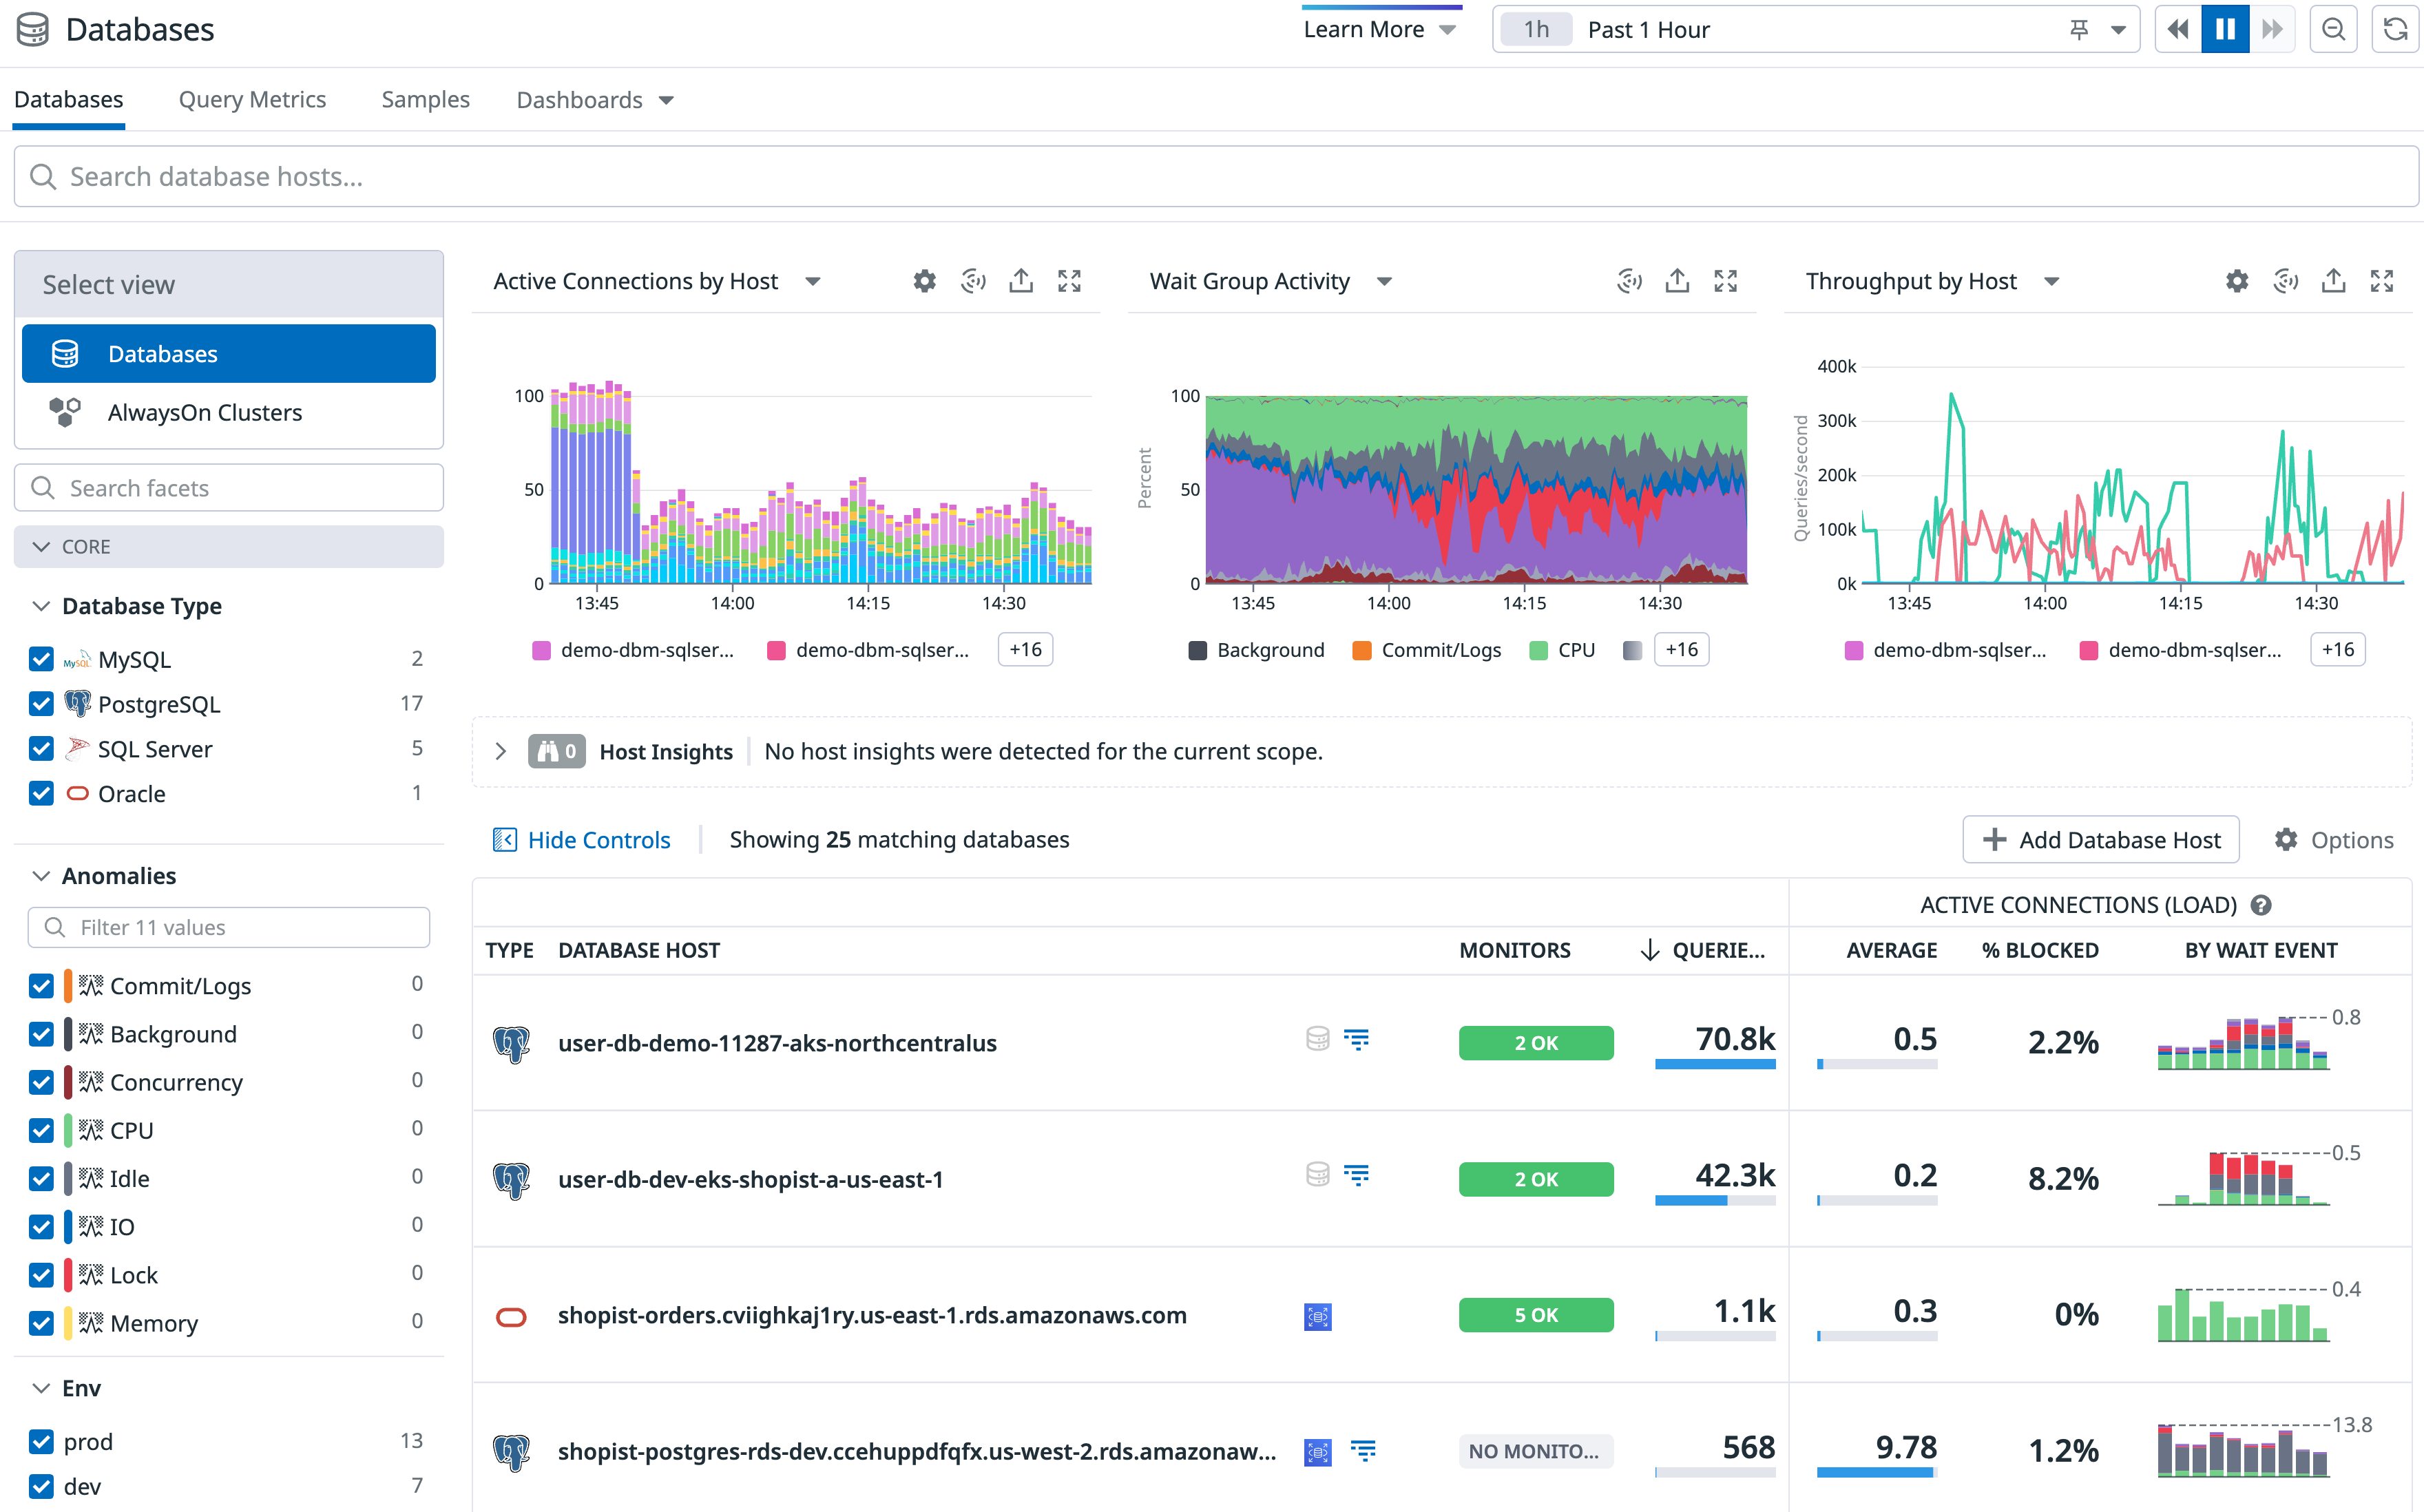
On the Databases page, you can assess the health and activity of your database hosts. Sort and filter the list to prioritize hosts with triggered alerts, high query volume, and other criteria. Click on an individual host to view details such as its configuration, common blocking queries, and calling services. See Exploring Database Hosts for details.
Further Reading

Try Monitoring a Postgres Database with Datadog DBM in the Learning Center
The Datadog Learning Center is full of hands-on courses to help you learn about this topic. Enroll at no cost to identify inefficiencies and optimize your Postgres database.
Additional helpful documentation, links, and articles:


