- Essentials
- Getting Started
- Datadog
- Datadog Site
- DevSecOps
- Serverless for AWS Lambda
- Agent
- Integrations
- Containers
- Dashboards
- Monitors
- Logs
- APM Tracing
- Profiler
- Tags
- API
- Service Catalog
- Session Replay
- Continuous Testing
- Synthetic Monitoring
- Incident Management
- Database Monitoring
- Cloud Security Management
- Cloud SIEM
- Application Security Management
- Workflow Automation
- CI Visibility
- Test Visibility
- Intelligent Test Runner
- Code Analysis
- Learning Center
- Support
- Glossary
- Standard Attributes
- Guides
- Agent
- Integrations
- OpenTelemetry
- Developers
- Authorization
- DogStatsD
- Custom Checks
- Integrations
- Create an Agent-based Integration
- Create an API Integration
- Create a Log Pipeline
- Integration Assets Reference
- Build a Marketplace Offering
- Create a Tile
- Create an Integration Dashboard
- Create a Recommended Monitor
- Create a Cloud SIEM Detection Rule
- OAuth for Integrations
- Install Agent Integration Developer Tool
- Service Checks
- IDE Plugins
- Community
- Guides
- API
- Datadog Mobile App
- CoScreen
- Cloudcraft
- In The App
- Dashboards
- Notebooks
- DDSQL Editor
- Sheets
- Monitors and Alerting
- Infrastructure
- Metrics
- Watchdog
- Bits AI
- Service Catalog
- API Catalog
- Error Tracking
- Service Management
- Infrastructure
- Application Performance
- APM
- Continuous Profiler
- Database Monitoring
- Data Streams Monitoring
- Data Jobs Monitoring
- Digital Experience
- Real User Monitoring
- Product Analytics
- Synthetic Testing and Monitoring
- Continuous Testing
- Software Delivery
- CI Visibility
- CD Visibility
- Test Visibility
- Intelligent Test Runner
- Code Analysis
- Quality Gates
- DORA Metrics
- Security
- Security Overview
- Cloud SIEM
- Cloud Security Management
- Application Security Management
- AI Observability
- Log Management
- Observability Pipelines
- Log Management
- Administration
Distributions
Overview
Distributions are a metric type that aggregate values sent from multiple hosts during a flush interval to measure statistical distributions across your entire infrastructure.
Global distributions instrument logical objects, like services, independently from the underlying hosts. Unlike histograms which aggregate on the Agent-side, global distributions send all raw data collected during the flush interval and the aggregation occurs server-side using Datadog’s DDSketch data structure.
Distributions provide enhanced query functionality and configuration options that aren’t offered with other metric types (count, rate, gauge, histogram):
Calculation of percentile aggregations: Distributions are stored as DDSketch data structures that represent raw, unaggregated data such that globally accurate percentile aggregations (p50, p75, p90, p95, p99 or any percentile of your choosing with up to two decimal points) can be calculated across the raw data from all your hosts. Enabling percentile aggregations can unlock advanced query functionalities such as:
Single percentile value over any timeframe:
“What has the 99.9th percentile load time for my application been over the past week?”
Standard deviation over any timeframe:
“What is the standard deviation (stddev) of my application’s CPU consumption over the past month?”
Percentile thresholds on metric monitors:
“Alert me when the p95 of my application’s request latency is greater than 200 ms for the last 5 min.”
Threshold Queries:
“I’d like to define a 30-day SLO where 95% of requests to my service are completed in under 5 seconds.”
Customization of tagging: This functionality allows you to control the tagging scheme for custom metrics for which host-level granularity is not necessary (for example, transactions per second for a checkout service).
See the Developer Tools section for more implementation details.
Note: Because distributions metric data is stored differently from other types, any metric name used for a distribution should not be used for any other metric types.
Enabling advanced query functionality
Like other metric types, such as gauges or histograms, distributions have the following aggregations available: count, min, max, sum, and avg. Distributions are initially tagged the same way as other metrics, with custom tags set in code. They are then resolved to host tags based on the host that reported the metric.
However, you can enable advanced query functionality such as the calculation of globally accurate percentile aggregations for all queryable tags on your distribution on the Metrics Summary page. This provides aggregations for p50, p75, p90, p95, and p99 or any user-defined percentile of your choosing (with up to two decimal points such as 99.99). Enabling advanced queries also unlocks threshold queries and standard deviation.
After electing to apply percentile aggregations on a distribution metric, these aggregations are automatically available in the graphing UI:
You can use percentile aggregations in a variety of other widgets and for alerting:
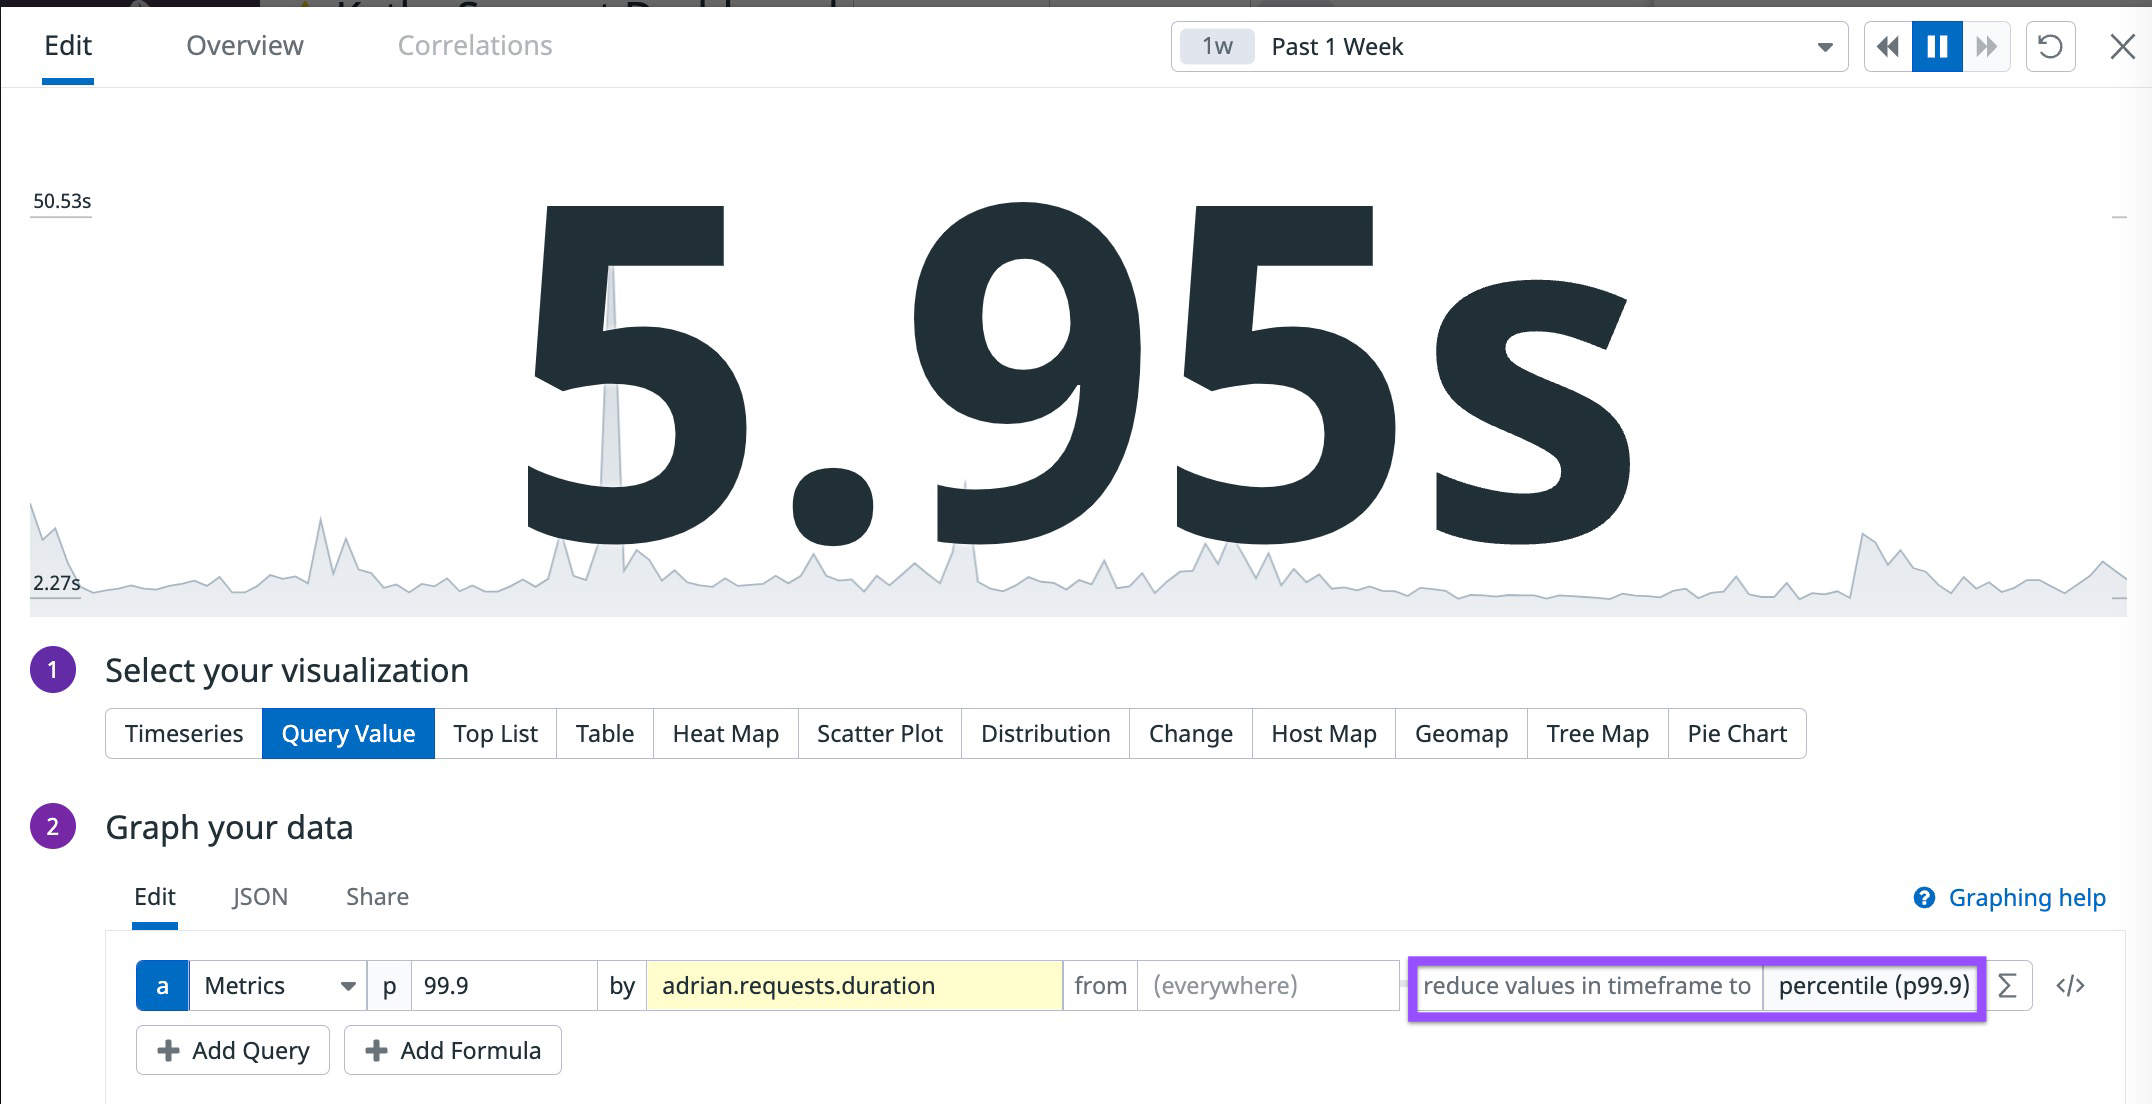
Single percentile value over any timeframe
“What has the 99.9th percentile request duration for my application been over the past week?”
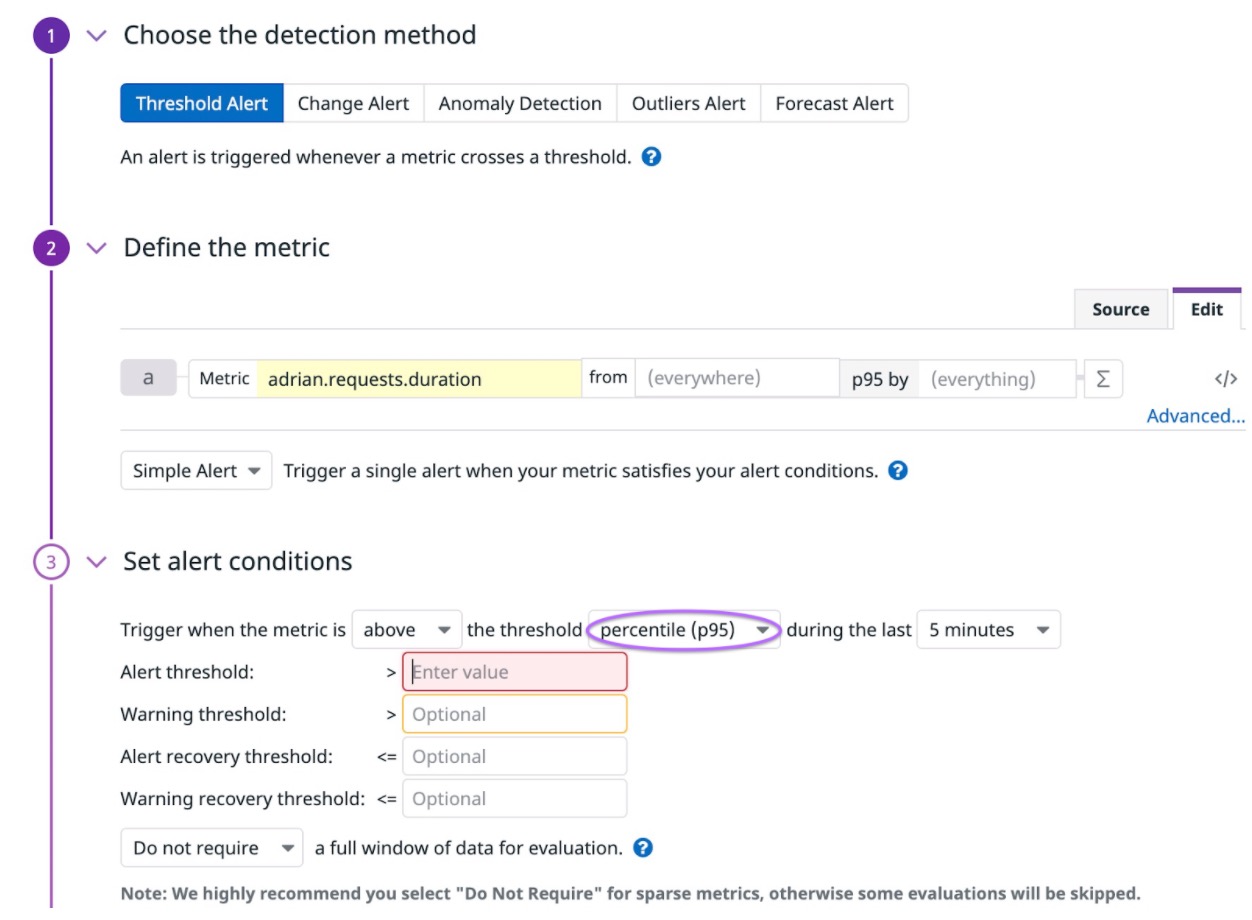
- Percentile thresholds on metric monitors “Alert me when the p95 of my application’s request latency is greater than 200 ms for the last 5 min.”
Threshold Queries
Threshold queries are in public beta.
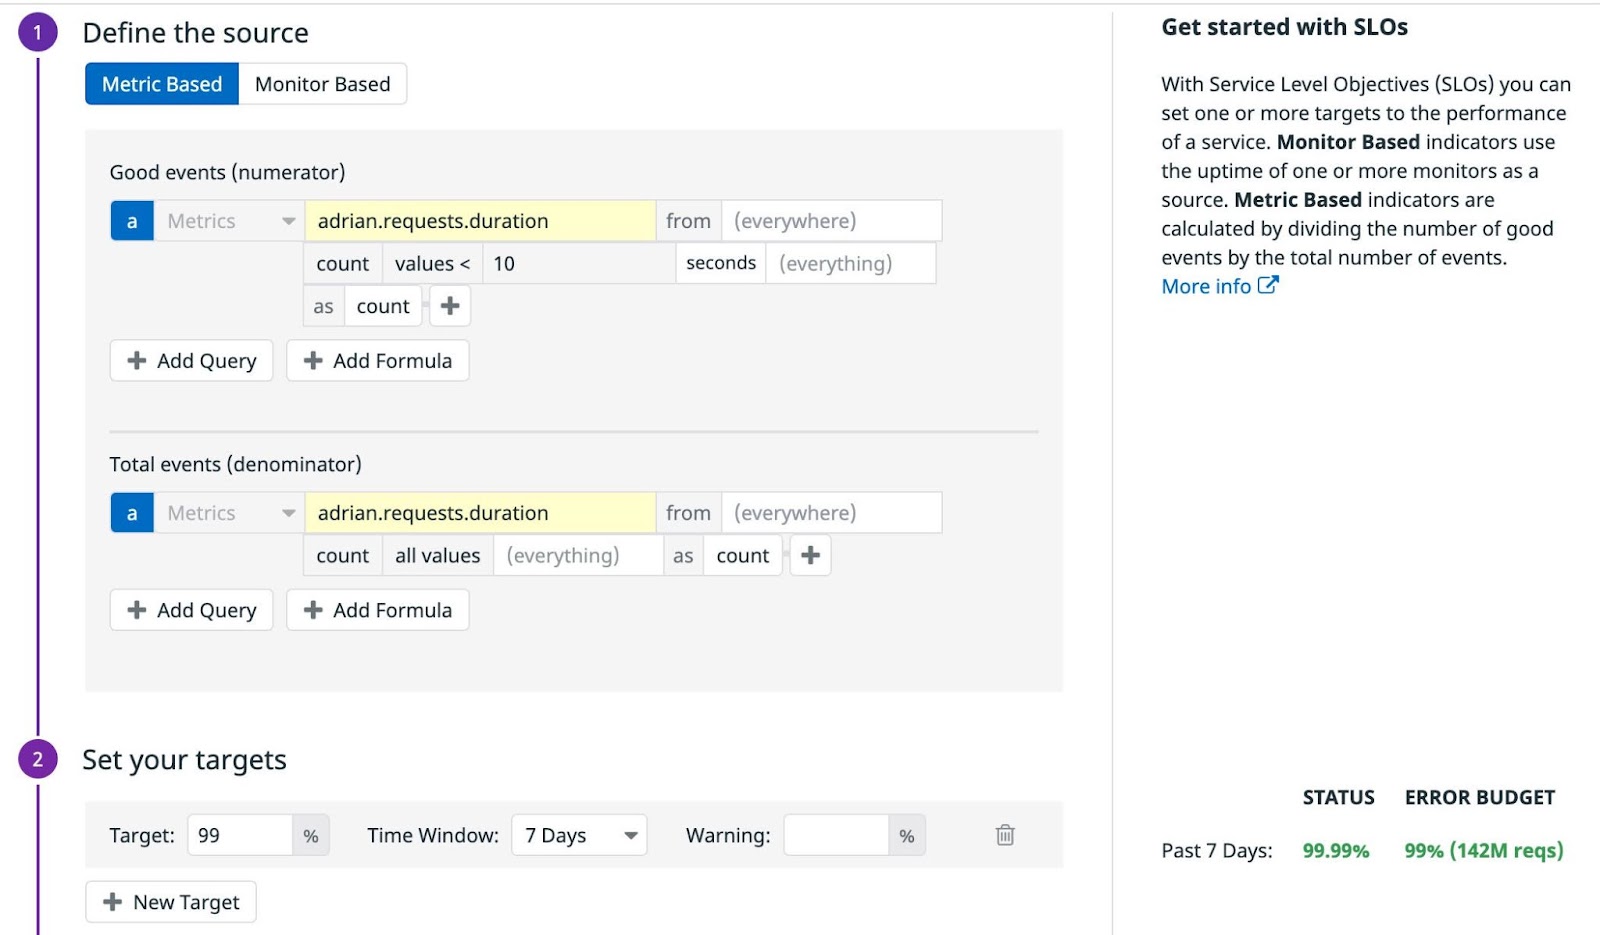
Enabling DDSketch-calculated globally-accurate percentiles on your distribution metrics unlocks threshold queries where you can count the number of raw distribution metric values if they exceed or fall below a numerical threshold. You can use this functionality to count the number of errors or violations compared to an anomalous numerical threshold on dashboards. Or you can also use threshold queries to define SLOs like “95% of requests were completed in under 10 seconds over the past 30 days”.
With threshold queries for distributions with percentiles, you do not need to predefine a threshold value prior to metric submission, and have full flexibility to adjust the threshold value in Datadog.
To use threshold queries:
- Enable percentiles on your distribution metric on the Metrics Summary page.
- Graph your chosen distribution metric using the “count values…” aggregator.
- Specify a threshold value and comparison operator.
You can similarly create a metric-based SLO using threshold queries:
- Enable percentiles on your distribution metric on the Metrics Summary page.
- Create a new Metric-Based SLO and define the numerator as the number of “good” events with a query on your chosen distribution metric using the “count values…” aggregator.
- Specify a threshold value and comparison operator.
Customize tagging
Distributions provide functionality that allows you to control the tagging for custom metrics where host-level granularity does not make sense. Tag configurations are allowlists of the tags you’d like to keep.
To customize tagging:
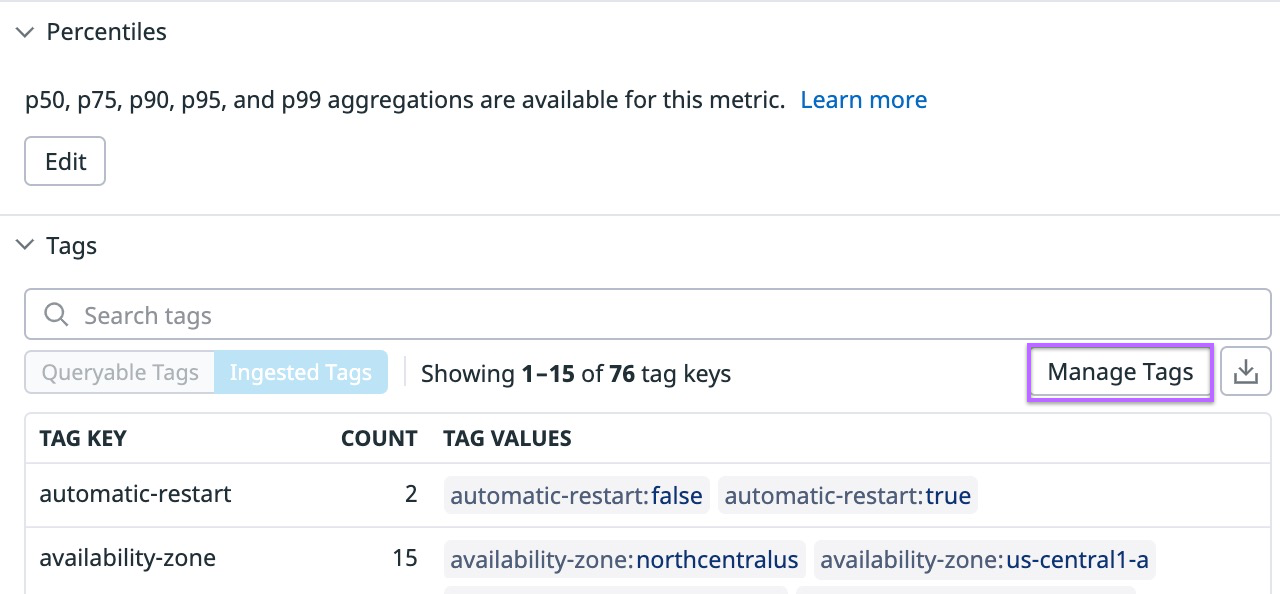
- Click on your custom distribution metric name in the Metrics Summary table to open the metrics details sidepanel.
- Click the Manage Tags button to open the tag configuration modal.
- Click the Custom… tab to customize the tags you’d like to keep available for query.
Note: The exclusion of tags is not supported in the allowlist-based customization of tags. Adding tags starting with ! is not accepted.
Audit events
Any tag configuration or percentile aggregation changes create an event in the event explorer. This event explains the change and displays the user that made the change.
If you created, updated, or removed a tag configuration on a distribution metric, you can see examples with the following event search:
https://app.datadoghq.com/event/stream?tags_execution=and&per_page=30&query=tags%3Aaudit%20status%3Aall%20priority%3Aall%20tag%20configuration
If you added or removed percentile aggregations to a distribution metric, you can see examples with the following event search:
https://app.datadoghq.com/event/stream?tags_execution=and&per_page=30&query=tags%3Aaudit%20status%3Aall%20priority%3Aall%20percentile%20aggregations
Further reading
Additional helpful documentation, links, and articles:


