- Essentials
- Getting Started
- Datadog
- Datadog Site
- DevSecOps
- Serverless for AWS Lambda
- Agent
- Integrations
- Containers
- Dashboards
- Monitors
- Logs
- APM Tracing
- Profiler
- Tags
- API
- Service Catalog
- Session Replay
- Continuous Testing
- Synthetic Monitoring
- Incident Management
- Database Monitoring
- Cloud Security Management
- Cloud SIEM
- Application Security Management
- Workflow Automation
- CI Visibility
- Test Visibility
- Intelligent Test Runner
- Code Analysis
- Learning Center
- Support
- Glossary
- Standard Attributes
- Guides
- Agent
- Integrations
- OpenTelemetry
- Developers
- Authorization
- DogStatsD
- Custom Checks
- Integrations
- Create an Agent-based Integration
- Create an API Integration
- Create a Log Pipeline
- Integration Assets Reference
- Build a Marketplace Offering
- Create a Tile
- Create an Integration Dashboard
- Create a Recommended Monitor
- Create a Cloud SIEM Detection Rule
- OAuth for Integrations
- Install Agent Integration Developer Tool
- Service Checks
- IDE Plugins
- Community
- Guides
- API
- Datadog Mobile App
- CoScreen
- Cloudcraft
- In The App
- Dashboards
- Notebooks
- DDSQL Editor
- Sheets
- Monitors and Alerting
- Infrastructure
- Metrics
- Watchdog
- Bits AI
- Service Catalog
- API Catalog
- Error Tracking
- Service Management
- Infrastructure
- Application Performance
- APM
- Continuous Profiler
- Database Monitoring
- Data Streams Monitoring
- Data Jobs Monitoring
- Digital Experience
- Real User Monitoring
- Product Analytics
- Synthetic Testing and Monitoring
- Continuous Testing
- Software Delivery
- CI Visibility
- CD Visibility
- Test Visibility
- Intelligent Test Runner
- Code Analysis
- Quality Gates
- DORA Metrics
- Security
- Security Overview
- Cloud SIEM
- Cloud Security Management
- Application Security Management
- AI Observability
- Log Management
- Observability Pipelines
- Log Management
- Administration
Datadog Plugin for JetBrains IDEs
Overview
The Datadog plugin for JetBrains IDEs is available for IntelliJ IDEA, GoLand, PhpStorm, and PyCharm. It helps you improve software performance by providing meaningful code-level insights directly in the IDE based on real-time observability data.
The Code Insights view keeps you informed about:
- Issues from Error Tracking
- Vulnerability reports by Application Security Management
- Flaky tests detected by CI Visibility
The Continuous Profiler helps you to reduce latency and lower cloud costs by highlighting code lines that:
- Consume the most CPU
- Allocate the most memory
- Spend the most time on locks, disk I/O, and socket I/O
The Logs support shows observed logs in source code, as detected from Log patterns, and provides links to the Datadog Log Explorer to view logs generated by a specific line of code.
The CI Test Runs feature opens the Continuous Integration Visibility Explorer to show recent runs for a selected test.
The Static Analysis integration analyzes your code (locally) against predefined rules to detect and fix problems before you commit changes.
Requirements
- A Datadog account: The plugin requires a Datadog account (except when using Static Analysis features). If you’re new to Datadog, go to the Datadog website to learn more about Datadog’s observability tools and sign up for a free trial.
- Continuous Profiler: To display profiling data and insights, the plugin requires the Continuous Profiler to be configured for your Services. For more information, see Getting Started with the Continuous Profiler.
- JetBrains Toolbox: To use the View in IDE feature, the plugin requires the JetBrains Toolbox to be installed on the developer’s machine.
Setup
Install the Datadog plugin
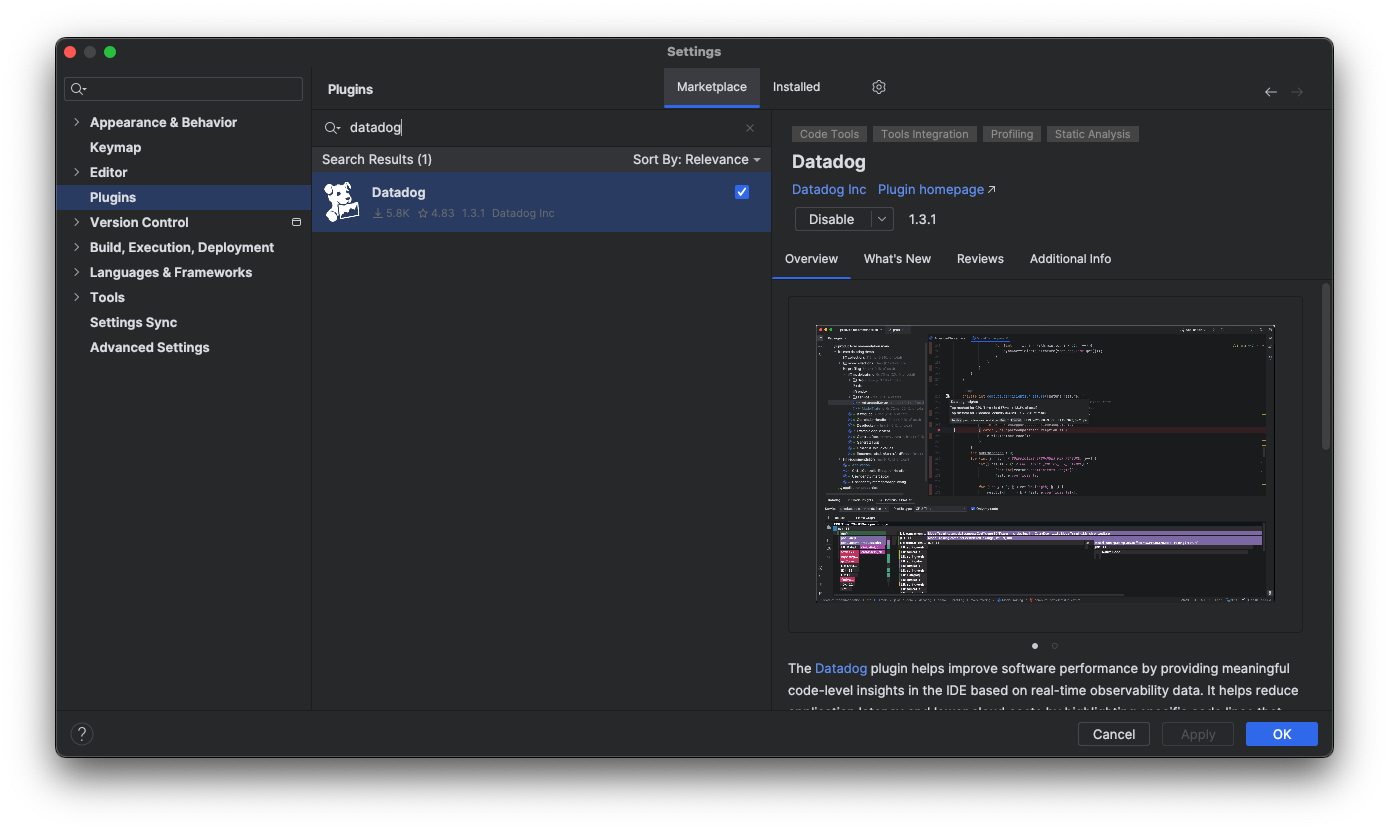
- Click Plugins and search for
Datadog. - Click Install to download and install the plugin in your IDE.
- If you receive a prompt notifying you that Datadog is a third-party plugin, click Accept.
- Click Restart IDE.
Alternatively, you can install the plugin from the JetBrains Marketplace.
Log in to Datadog
After installing the Datadog plugin and restarting the IDE, log in to Datadog:
- With a file or project open in the IDE, click the Datadog tool window.
- Click Log in….
- In the browser window that opens, select your site and organization, then authorize access to the platform.
Note: For most users, one login is all that is required. If you’re using a multi-org setup, check to ensure that the correct account is active. To find out which login your IDE is using, click Settings -> Tools -> Datadog, and check which account is active.
Link a service
To provide relevant data from the Datadog platform, add related services to your project:
- With your project open in the IDE, open the Datadog tool window and select Manage Linked Services… from the Options menu.
- A settings dialog opens, click the plus icon (+).
- Search for and select the services that you want to add to the current project.
To remove a service, select it in the Services table and click the minus icon (-).
The names of linked services persist with the project when you close it.
Code Insights
The Code Insights tab displays insights generated by the Datadog platform that are relevant to your current project. The insights are grouped into three categories: performance, reliability, and security.
Code Insights include a detailed description for each issue, and links to:
- The related source code location
- The Datadog platform for additional information
You can dismiss individual insights and set filters to view the categories of insights that you are interested in.
Continuous Profiler
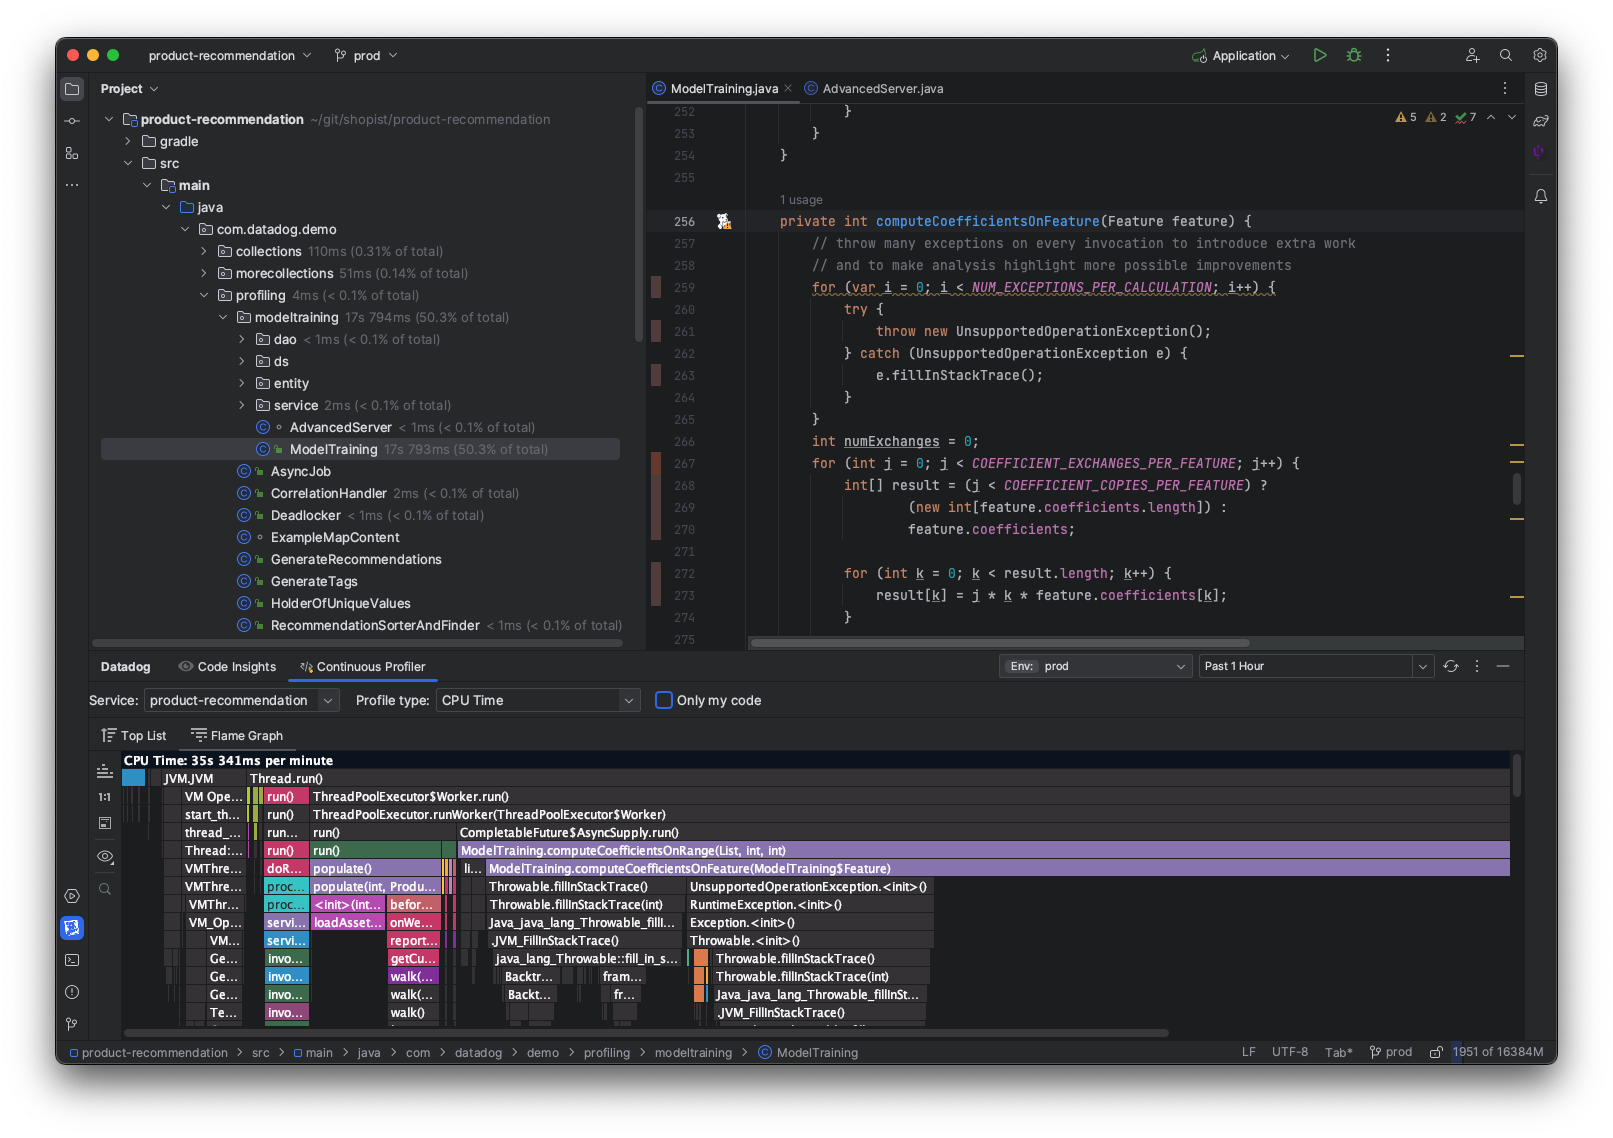
The Continuous Profiler tab shows profiling information for the service in a selected environment, aggregated over a specific time frame. Available views are:
- Top list: Displays a list of the most resource intensive methods for the current profiling measure.
- Flame graph: A flame graph representing stack traces in the profiles.
You can specify the following parameters for the profiling data:
- The profile type to be displayed
- The environment in which the service is running
- The time frame for the profile samples to be aggregated
The available profiling types usually include options like CPU Time and Allocated Memory, but are determined by the platform and vary by language.
Top list
The Top List sub-tab shows the methods that consume the most resources based on the aggregated profile data loaded from the Datadog servers. These are the methods that are most likely candidates for optimization.
- Double-clicking an item in the list (or selecting Jump to Source from the context menu) opens a source code editor showing where the method is defined.
- To see a flame graph visualization of a method, select Search in Flame Graph from the context menu.
Call tree
The call tree to the right of the Top List shows the paths that lead to (and from) the selected method.
The default Caller Hierarchy view shows the callers (or predecessors) of the target method and the frequency with which they appear in the call stack. To view the callees (or successors), click the Callee Hierarchy button on the toolbar.
Right-click on a method in the call tree to see options to navigate to the source editor or flame graph.
Flame graph
A flame graph is a visualization of profiling samples that shows stack traces and their relative frequency during the sample period. The Datadog plugin collects multiple individual profiles from the requested time frame, and aggregates them. Each individual profile covers a 60 second interval within the requested time frame.
Each time you change the profile type, the time frame, or the environment, the Datadog plugin generates a new flame graph.
You can navigate the flame graph in several ways:
- Double-click on any frame to focus on that method and all the methods that it has called during the sampling period.
- Use the minimap to pan around the graph.
- Right-click on a method and select Jump to Source to go to the corresponding point in the source code.
Hovering over a method displays a tooltip with the following information:
- The class name and method signature
- The package name
- The profiling metric value and percentage breakdown.
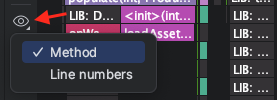
Profiling samples include stack trace and line number information. Use the Separate Flame Graph by button to switch between separating frames by method or line number.
Source highlighting
When the Continuous Profiler tab is active, the plugin adds code highlights to the source code editor margin. For Top Methods, an icon appears in the editor margin, and line-level highlights appear in the code based on the active Profiling data.
- Hover over the icon to see more information.
- Click the icon to open the top list Profiling tab or open Profiling in Datadog.
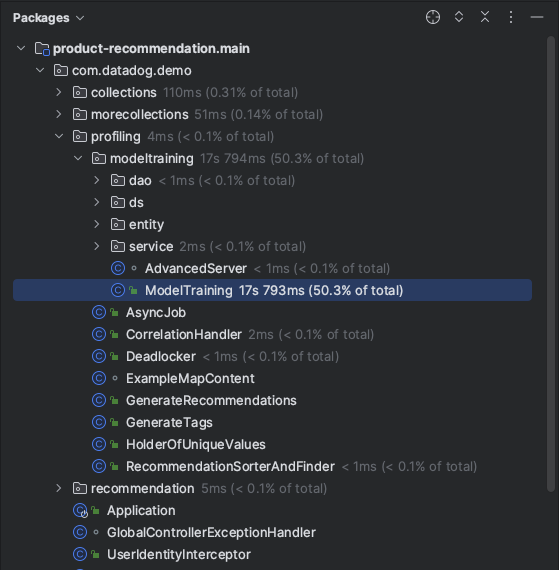
The active Profiling tab also affects the project tree view, which is annotated with the selected profile’s metrics:
Logs insights
Log patterns from Datadog are matched directly to lines of code in your editor for your Java, Go, and Python source files:
A popup shows runtime values from the log entries:
Click the log icon to open the Log Explorer on the Datadog platform with a pre-filled query that matches the logger name, log level, and log message as closely as possible:
CI Test Runs
You can view recent test runs in the Continuous Integration Visibility Explorer by navigating directly from your source files. Look for the View Test Runs links following test method declarations in your source code:
Clicking the link opens the Test Runs tab showing the recent history for one test case.
View in IDE
The View in IDE feature provides a link from the Datadog platform directly to the source files in your IDE. Look for the button next to frames in stack traces displayed on the platform (for example, in Error Tracking):
This feature has two prerequisites: (1) Source Code Integration is configured for your service and (2) the JetBrains Toolbox is installed on your development machine.
Static Analysis
The Datadog plugin runs Static Analysis rules on your source files as you edit them. The goal is to detect and fix problems such as maintainability issues, bugs, or security vulnerabilities in your code before you commit your changes.
Static Analysis supports scanning for many programming languages. For a complete list, see Static Analysis Rules. For file types belonging to supported languages, issues are shown in the source code editor with the JetBrains inspection system, and suggested fixes can be applied directly:
Additionally, all issues detected by this feature are listed in the standard Problems view.
Getting started
When you start editing a source file supported by Static Analysis, the plugin checks for static-analysis.datadog.yml at your source repository’s root. It prompts you to create the file if necessary:
Once the configuration file is created, the static analyzer runs automatically in the background.
The Static Analysis feature does not require a Datadog account as source files are analyzed locally.
Feedback
You can give feedback in the discussion forum, or send an e-mail to team-ide-integration@datadoghq.com.
Further reading
Additional helpful documentation, links, and articles:


