- Essentials
- Getting Started
- Datadog
- Datadog Site
- DevSecOps
- Serverless for AWS Lambda
- Agent
- Integrations
- Containers
- Dashboards
- Monitors
- Logs
- APM Tracing
- Profiler
- Tags
- API
- Service Catalog
- Session Replay
- Continuous Testing
- Synthetic Monitoring
- Incident Management
- Database Monitoring
- Cloud Security Management
- Cloud SIEM
- Application Security Management
- Workflow Automation
- CI Visibility
- Test Visibility
- Intelligent Test Runner
- Code Analysis
- Learning Center
- Support
- Glossary
- Standard Attributes
- Guides
- Agent
- Integrations
- OpenTelemetry
- Developers
- Authorization
- DogStatsD
- Custom Checks
- Integrations
- Create an Agent-based Integration
- Create an API Integration
- Create a Log Pipeline
- Integration Assets Reference
- Build a Marketplace Offering
- Create a Tile
- Create an Integration Dashboard
- Create a Recommended Monitor
- Create a Cloud SIEM Detection Rule
- OAuth for Integrations
- Install Agent Integration Developer Tool
- Service Checks
- IDE Plugins
- Community
- Guides
- API
- Datadog Mobile App
- CoScreen
- Cloudcraft
- In The App
- Dashboards
- Notebooks
- DDSQL Editor
- Sheets
- Monitors and Alerting
- Infrastructure
- Metrics
- Watchdog
- Bits AI
- Service Catalog
- API Catalog
- Error Tracking
- Service Management
- Infrastructure
- Application Performance
- APM
- Continuous Profiler
- Database Monitoring
- Data Streams Monitoring
- Data Jobs Monitoring
- Digital Experience
- Real User Monitoring
- Product Analytics
- Synthetic Testing and Monitoring
- Continuous Testing
- Software Delivery
- CI Visibility
- CD Visibility
- Test Visibility
- Intelligent Test Runner
- Code Analysis
- Quality Gates
- DORA Metrics
- Security
- Security Overview
- Cloud SIEM
- Cloud Security Management
- Application Security Management
- AI Observability
- Log Management
- Observability Pipelines
- Log Management
- Administration
DORA Metrics Data Collected
DORA Metrics is not available in the selected site () at this time.
DORA Metrics is in public beta.
Overview
DORA Metrics generates metrics for each one of the four core DORA Metrics, as well as events with associated tags and attributes that are available in the Events Explorer.
Default metrics
DORA Metrics provides the following default metrics:
| Metric | Type | Description |
|---|---|---|
dora.deployments.count | count | The number of deployments detected by Datadog based on your selected deployment data source. |
dora.change_lead_time | distribution | The age in seconds of associated Git commits at the time of deployment. |
dora.incidents_impact | count | Tracks the services or teams impacted by incidents. Used for change failure rate with the formula dora.incidents_impact / dora.deployments.count. A big time rollup of at least 1 week is recommended to account for the time difference between deployments and when the impact starts. |
dora.time_to_restore | distribution | The time in seconds between an incident’s started_at and finished_at timestamps. |
Default tags
All default metrics contain the following tags if any are available:
serviceteamenvrepository_id
Note: The severity tag is available for dora.incidents_impact and dora.time_to_restore metrics when it is provided by the failure’s data source.
For more information about using env, service, and version tags, see Getting Started with Tags.
Change lead time metrics
Datadog breaks down change lead time into the following metrics, which represent the different stages from commit creation to deployment.
| Metric | Type | Description |
|---|---|---|
dora.time_to_pr_ready | duration | Time from when the commit is created until the PR is ready for review. This metric is only available for commits that were made before the PR was marked as ready for review. |
dora.review_time | duration | Time from when the PR is marked ready for review until it receives the last approval. This metric is only available for commits that were made before the PR is approved. |
dora.merge_time | duration | Time from the last approval until the PR is merged. |
dora.time_to_deploy | duration | Time from PR merge to start of deployment. If a commit does not have an associated PR, this metric is calculated as the time from commit creation to start of deployment. |
dora.deploy_time | duration | Time from start of deployment to end of deployment. This metric is not available if there is no deployment duration information. |
These metrics are only computed when the source of the repository metadata is GitHub, and there must be a pull request (PR) associated with a commit, if any. A commit is associated with a PR if the commit is first introduced to the target branch when merging that PR. If a commit does not have an associated PR, only dora.time_to_deploy and dora.deploy_time metrics are available.
Note: These metrics are emitted for every commit and not per deployment.
Examine metrics in Event Management
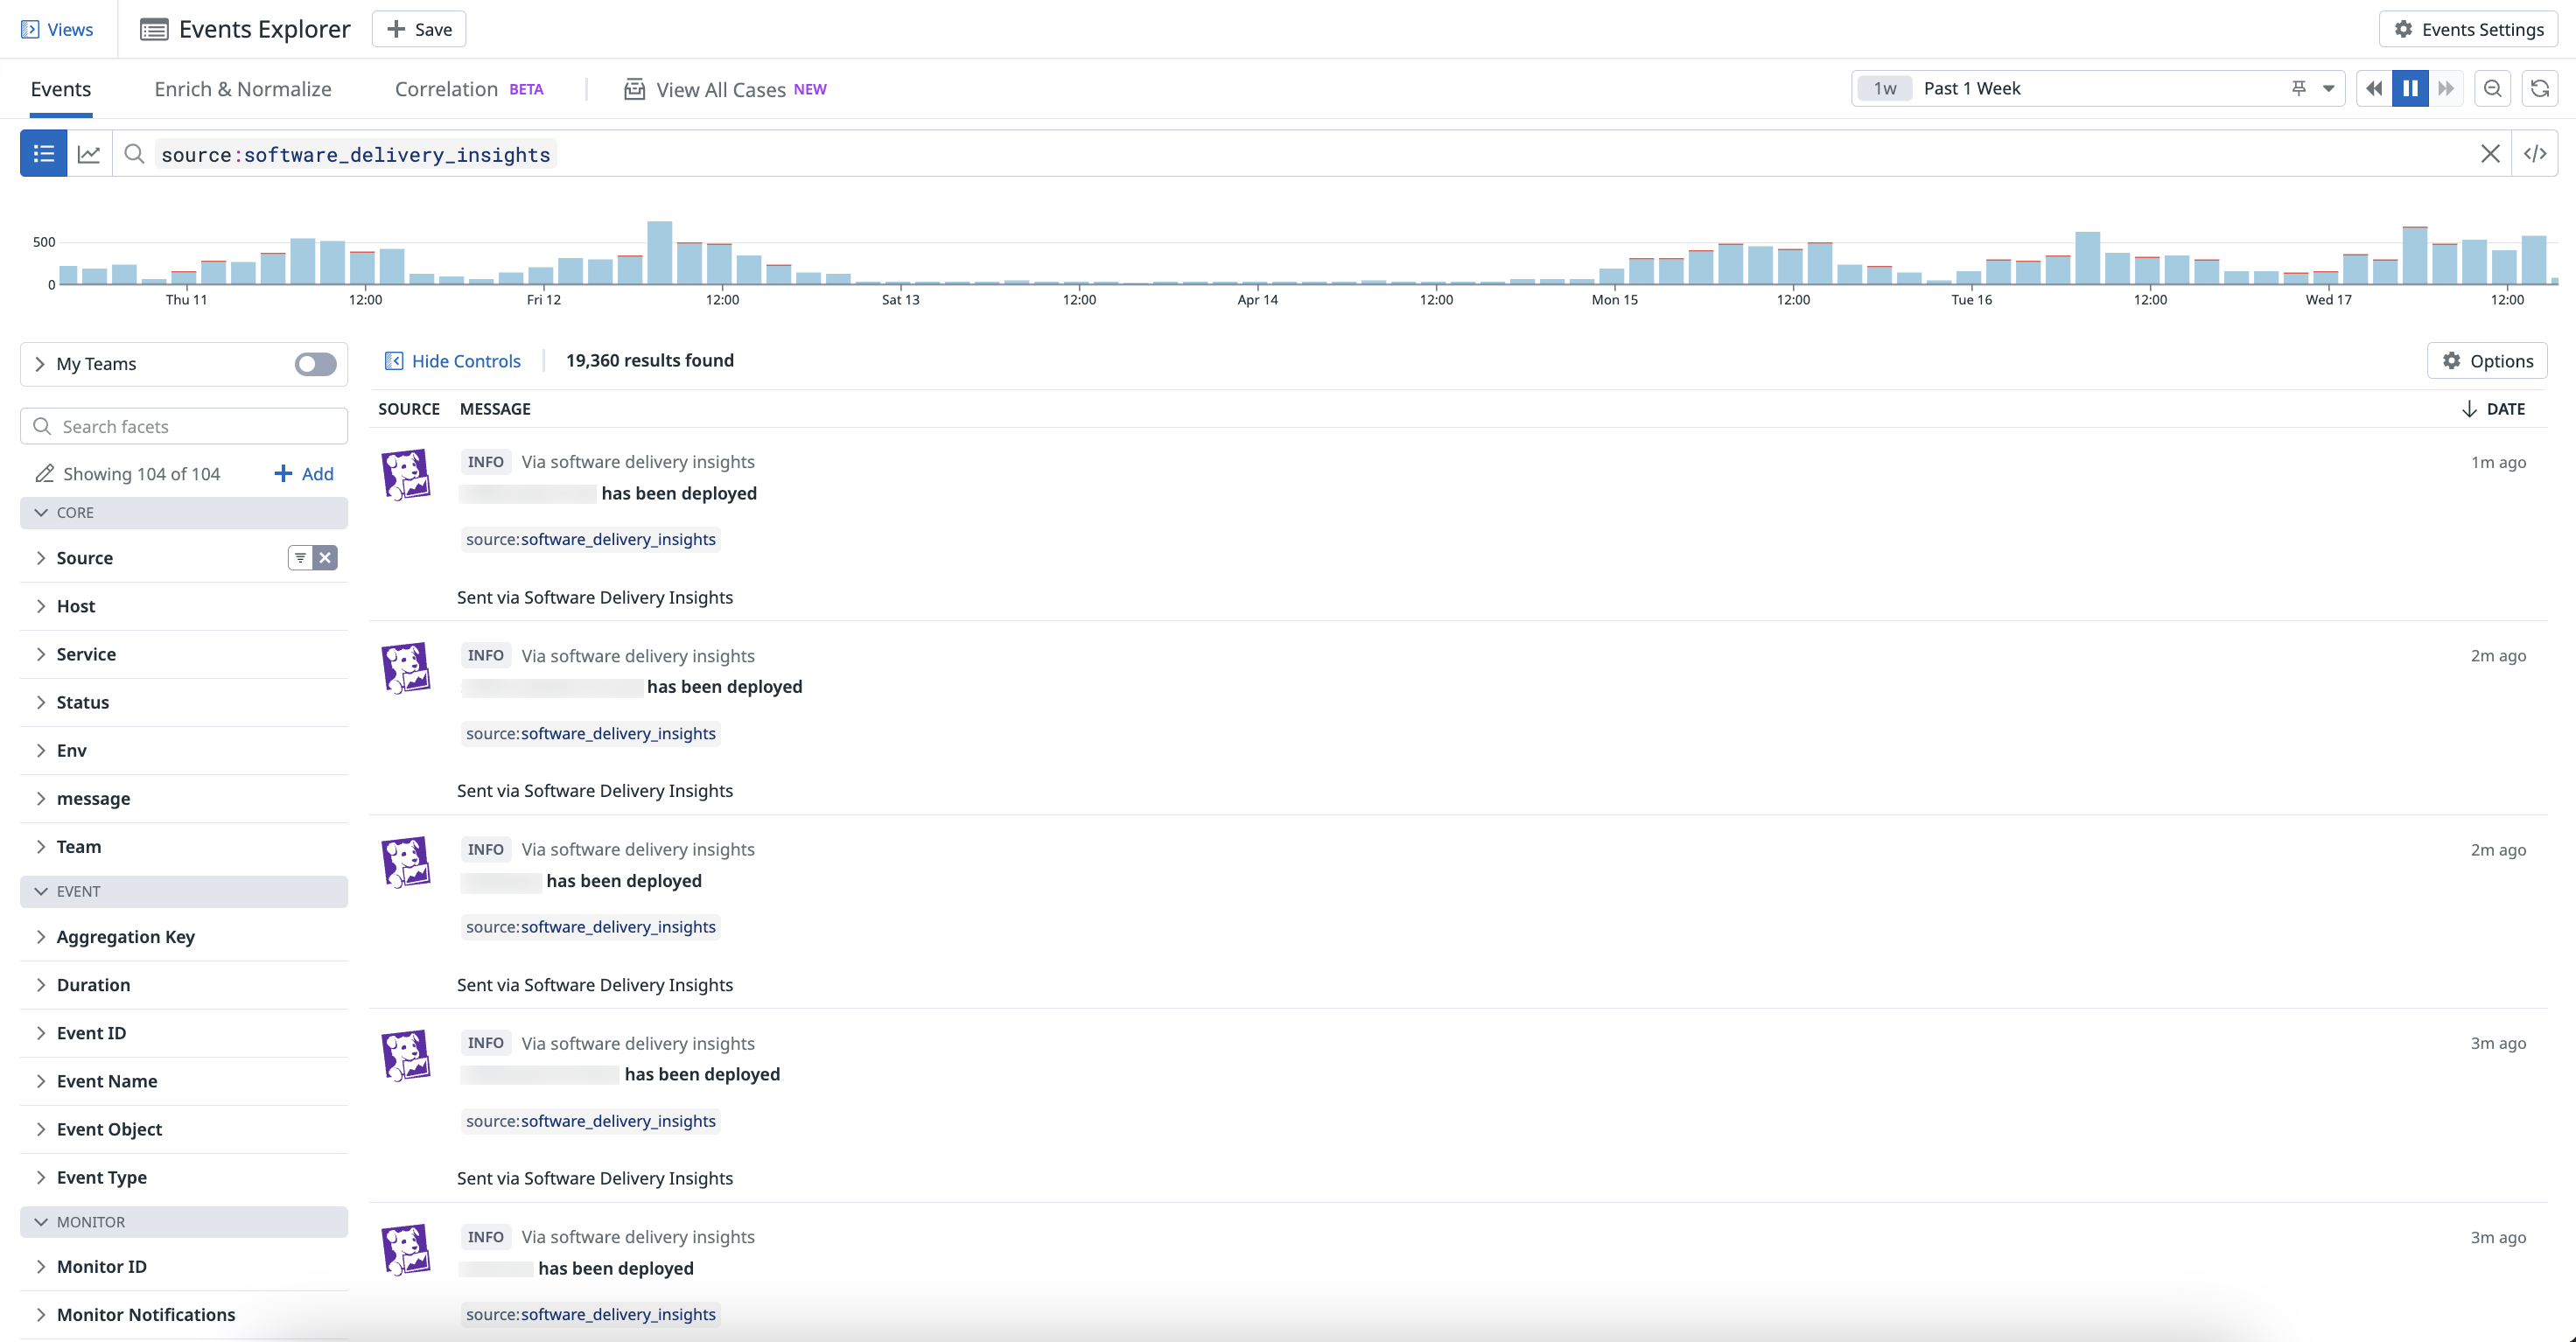
Default DORA Metrics are available in the Events Explorer. To search and filter on your DORA Metrics events, navigate to Service Management > Event Management > Explorer and enter source:software_delivery_insights in the search query.
These metrics can be queried programmatically by using the Query timeseries points and Query timeseries data across multiple products API endpoints with the source software_delivery_insights.
Further Reading
Additional helpful documentation, links, and articles:

