- Essentials
- Getting Started
- Datadog
- Datadog Site
- DevSecOps
- Serverless for AWS Lambda
- Agent
- Integrations
- Containers
- Dashboards
- Monitors
- Logs
- APM Tracing
- Profiler
- Tags
- API
- Service Catalog
- Session Replay
- Continuous Testing
- Synthetic Monitoring
- Incident Management
- Database Monitoring
- Cloud Security Management
- Cloud SIEM
- Application Security Management
- Workflow Automation
- CI Visibility
- Test Visibility
- Intelligent Test Runner
- Code Analysis
- Learning Center
- Support
- Glossary
- Standard Attributes
- Guides
- Agent
- Integrations
- OpenTelemetry
- Developers
- Authorization
- DogStatsD
- Custom Checks
- Integrations
- Create an Agent-based Integration
- Create an API Integration
- Create a Log Pipeline
- Integration Assets Reference
- Build a Marketplace Offering
- Create a Tile
- Create an Integration Dashboard
- Create a Recommended Monitor
- Create a Cloud SIEM Detection Rule
- OAuth for Integrations
- Install Agent Integration Developer Tool
- Service Checks
- IDE Plugins
- Community
- Guides
- API
- Datadog Mobile App
- CoScreen
- Cloudcraft
- In The App
- Dashboards
- Notebooks
- DDSQL Editor
- Sheets
- Monitors and Alerting
- Infrastructure
- Metrics
- Watchdog
- Bits AI
- Service Catalog
- API Catalog
- Error Tracking
- Service Management
- Infrastructure
- Application Performance
- APM
- Continuous Profiler
- Database Monitoring
- Data Streams Monitoring
- Data Jobs Monitoring
- Digital Experience
- Real User Monitoring
- Product Analytics
- Synthetic Testing and Monitoring
- Continuous Testing
- Software Delivery
- CI Visibility
- CD Visibility
- Test Visibility
- Intelligent Test Runner
- Code Analysis
- Quality Gates
- DORA Metrics
- Security
- Security Overview
- Cloud SIEM
- Cloud Security Management
- Application Security Management
- AI Observability
- Log Management
- Observability Pipelines
- Log Management
- Administration
Error Tracking
Overview
It is critical for your system’s health to consistently monitor the errors collected by Datadog. When there are many individual error events, it becomes hard to prioritize errors for troubleshooting.
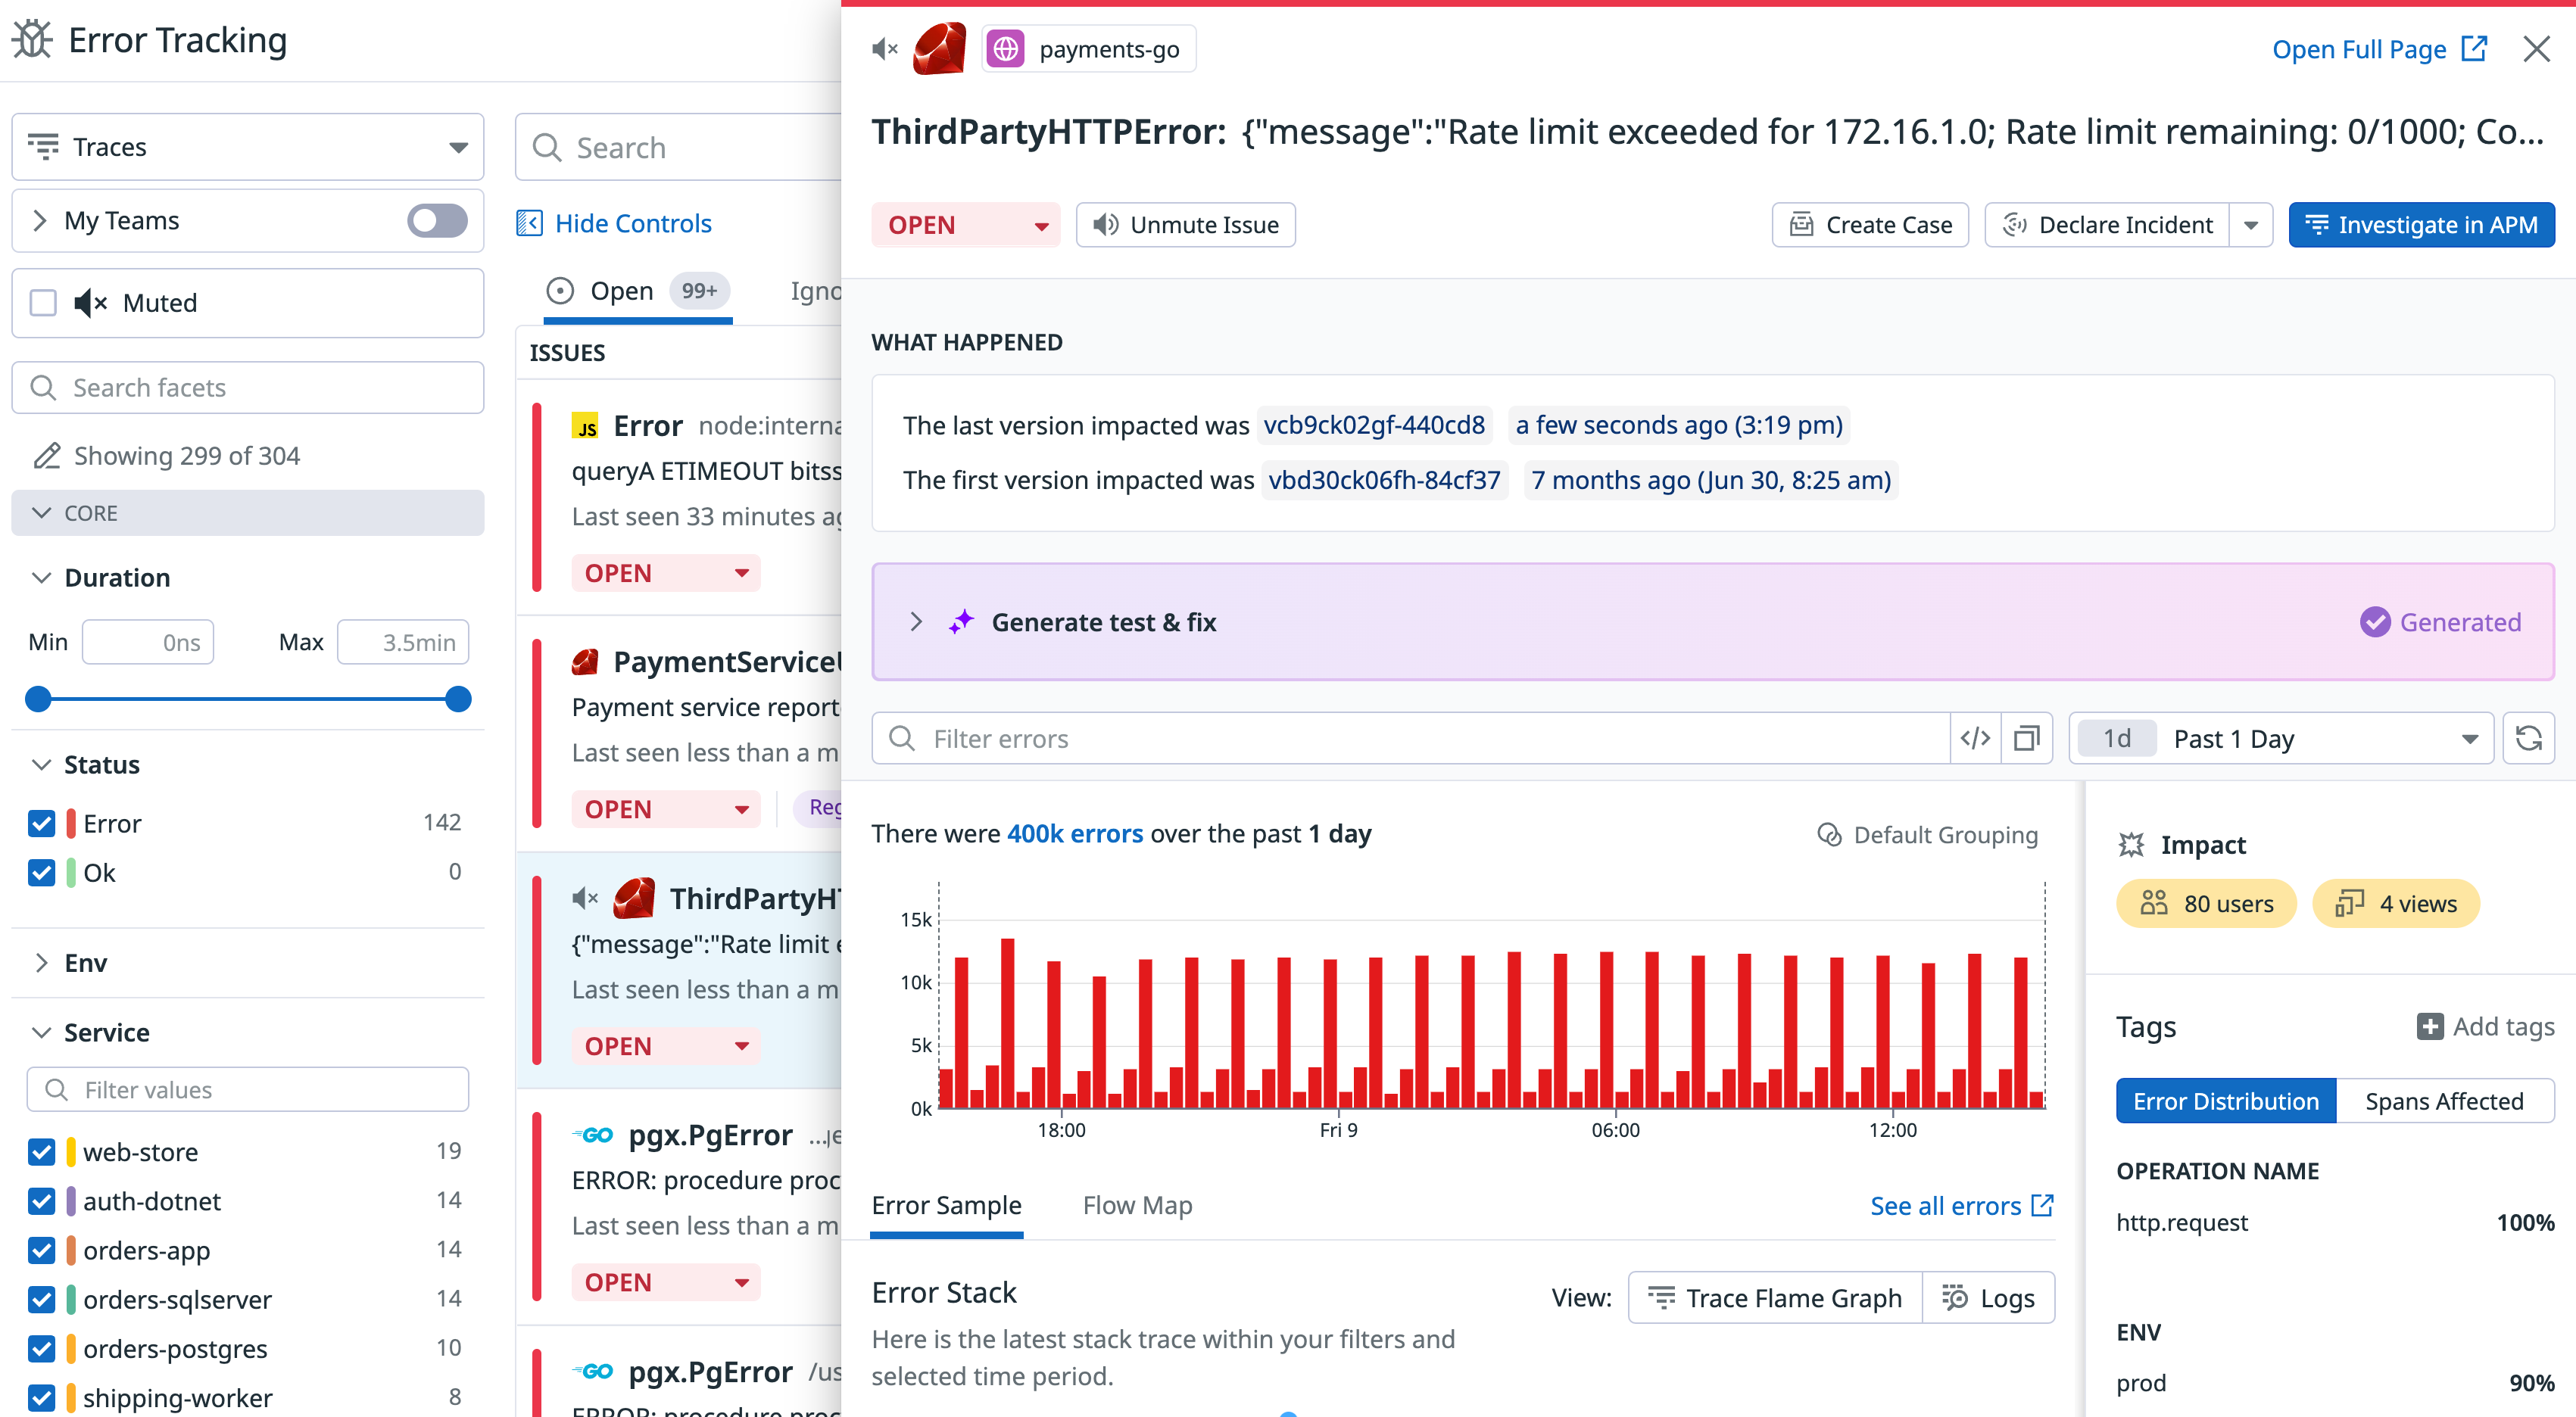
Error Tracking simplifies debugging by grouping thousands of similar errors into a single issue. An issue is an aggregation of error data that provides insights such as
- How many users have been impacted
- When the error first occurred
- Which commit probably caused the error
Error Tracking enables you to:
- Track, triage, and debug fatal errors
- Group similar errors into issues, so that you can more easily identify important errors and reduce noise
- Set monitors on error tracking events, such as high error volume or new issues
- Follow issues over time to know when they first started, if they are still ongoing, and how often they occur
Additional features are available depending on the source of the error. See supported error sources.
Getting started
- Take a tour of key Error Tracking features in the Error Tracking Explorer documentation.
- Use the product-specific links in the next section to set up Error Tracking for a particular error source.
Supported error sources
Error Tracking captures and processes errors across your web, mobile, and backend applications. You can instrument your applications and services using the Browser SDK, Mobile SDK, or ingest errors from your Logs, Traces, and Real User Monitoring events.
Additional features are available depending on the source of the error. For example, in errors originating from an APM trace, the Execution Replay feature automatically captures production variable values.
For details, see the product-specific Error Tracking documentation:

