- Principales informations
- Getting Started
- Datadog
- Site Datadog
- DevSecOps
- Serverless for AWS Lambda
- Agent
- Intégrations
- Conteneurs
- Dashboards
- Monitors
- Logs
- Tracing
- Profileur
- Tags
- API
- Service Catalog
- Session Replay
- Continuous Testing
- Surveillance Synthetic
- Incident Management
- Database Monitoring
- Cloud Security Management
- Cloud SIEM
- Application Security Management
- Workflow Automation
- CI Visibility
- Test Visibility
- Intelligent Test Runner
- Code Analysis
- Learning Center
- Support
- Glossary
- Standard Attributes
- Guides
- Agent
- Intégrations
- OpenTelemetry
- Développeurs
- Authorization
- DogStatsD
- Checks custom
- Intégrations
- Create an Agent-based Integration
- Create an API Integration
- Create a Log Pipeline
- Integration Assets Reference
- Build a Marketplace Offering
- Create a Tile
- Create an Integration Dashboard
- Create a Recommended Monitor
- Create a Cloud SIEM Detection Rule
- OAuth for Integrations
- Install Agent Integration Developer Tool
- Checks de service
- IDE Plugins
- Communauté
- Guides
- API
- Application mobile
- CoScreen
- Cloudcraft
- In The App
- Dashboards
- Notebooks
- DDSQL Editor
- Alertes
- Infrastructure
- Métriques
- Watchdog
- Bits AI
- Service Catalog
- API Catalog
- Error Tracking
- Service Management
- Infrastructure
- Universal Service Monitoring
- Conteneurs
- Sans serveur
- Surveillance réseau
- Cloud Cost
- Application Performance
- APM
- Profileur en continu
- Database Monitoring
- Agent Integration Overhead
- Setup Architectures
- Configuration de Postgres
- Configuration de MySQL
- Configuration de SQL Server
- Setting Up Oracle
- Setting Up MongoDB
- Connecting DBM and Traces
- Données collectées
- Exploring Database Hosts
- Explorer les métriques de requête
- Explorer des échantillons de requêtes
- Dépannage
- Guides
- Data Streams Monitoring
- Data Jobs Monitoring
- Digital Experience
- RUM et Session Replay
- Product Analytics
- Surveillance Synthetic
- Continuous Testing
- Software Delivery
- CI Visibility
- CD Visibility
- Test Visibility
- Exécuteur de tests intelligent
- Code Analysis
- Quality Gates
- DORA Metrics
- Securité
- Security Overview
- Cloud SIEM
- Cloud Security Management
- Application Security Management
- AI Observability
- Log Management
- Pipelines d'observabilité
- Log Management
- Administration
Getting Started
Cette page n'est pas encore disponible en français, sa traduction est en cours.
Si vous avez des questions ou des retours sur notre projet de traduction actuel, n'hésitez pas à nous contacter.
Si vous avez des questions ou des retours sur notre projet de traduction actuel, n'hésitez pas à nous contacter.
Overview
Network Device Monitoring helps you gain insights into the health and performance of your on-prem routers, switches, and firewalls. Once the Datadog Agent is installed on a host that has access to the network, the Agent can autodiscover network devices and collect metrics right out of the box.
This guide explains how to configure Network Device Monitoring on your hosts, enrich device tags, view and set up device profiles, view your data in NetFlow Monitoring, and validate your data in the provided dashboards and in the Device Topology Map.
Phase 1: Prerequisites
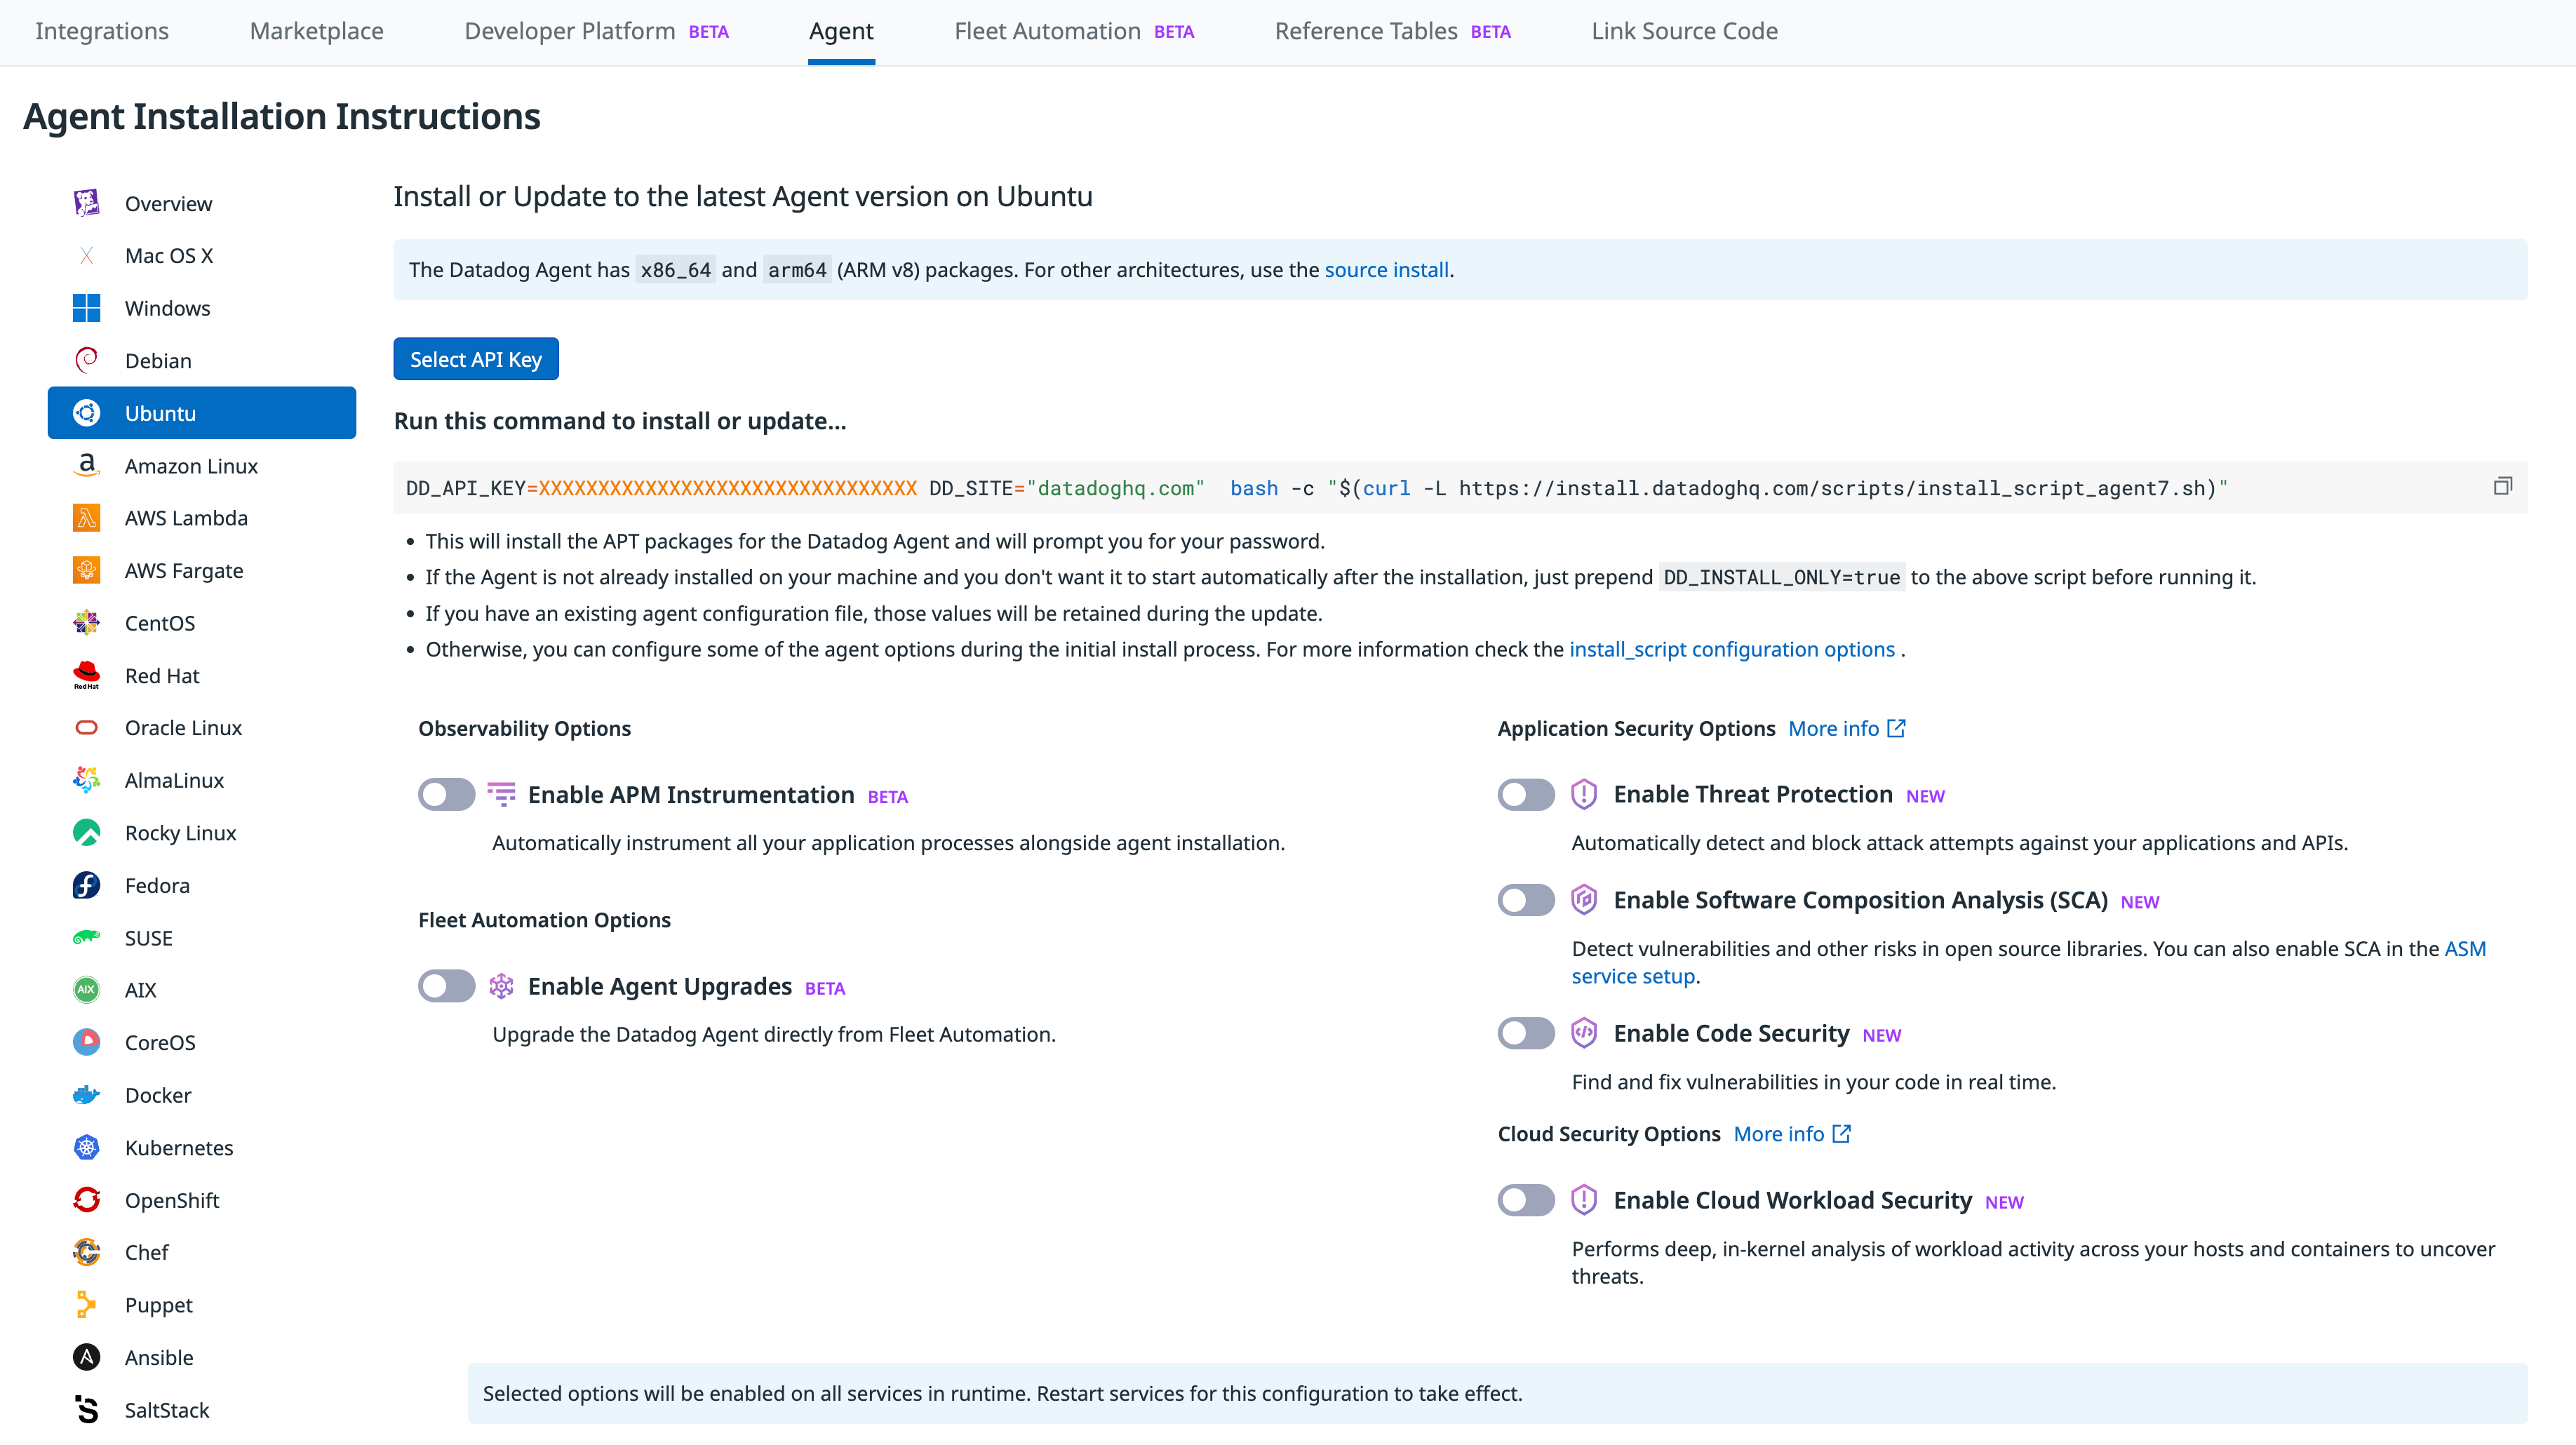
Install the Agent
Navigate to the Agent installation page, and install the Datadog Agent on your host (usually a server that is not the monitored device).
Phase 2: Setup
Integration Configuration
To begin monitoring your network devices, enable the SNMP integration using one of the following methods:
- Individual devices
- Configure SNMP monitoring on your individual devices.
- Autodiscovery
- Configure SNMP monitoring using Autodiscovery.
- Ping
- Additionally, SNMP supports enabling ping on your devices.
Phase 3: Additional customizations (optional)
SD-WAN monitoring
Alongside SNMP devices, you can monitor wireless and SD-WAN (Software-Defined Wide Area Network) environments for select vendors. Collect metrics from wireless access points, and monitor the health of SD-WAN tunnels and edge devices.
SD-WAN is a type of networking technology that uses software-defined networking (SDN) principles to manage and optimize the performance of wide area networks (WANs). It is mainly used to interconnect remote offices and data centers across different transports (MPLS, Broadband, 5G, and so on). SD-WAN benefits from automatic load balancing and failure detection across these transports.
Datadog supports the following vendors for SD-WAN network monitoring:
- Meraki SD-WAN (public beta)
- Cisco SD-WAN (public beta)
Enrich network devices with tags
Once NDM is configured on your devices, you can further enrich them by adding network device tags using the following methods:
- Datadog Agent
- The Agent can collect device tags when configuring individual devices or with Autodiscovery.
- Device profiles
- Configure the Agent to collect and customize specific metrics and tags by creating device profiles directly in the app.
- ServiceNow integration
- Dynamically enrich network devices monitored by Datadog Network Device Monitoring with data defined in ServiceNow’s CMDB (Configuration Management Database).
- Network Device Monitoring API
- Utilize the Network Device Monitoring API to programmatically add tags to your network devices.
Customize metrics and tags
Customize metrics and tags on your devices by viewing the Supported Devices page to view out-of-the-box device profiles. If you would like to edit or add more metrics, the following options are available:
- Device profiles
- Directly edit metrics and tags in the Datadog Agent
yamlfile with with device profiles. - GUI based profile authoring
- Take advantage of Datadog Network Monitoring’s GUI based device onboarding experience where you can add custom metrics and tags to your devices.
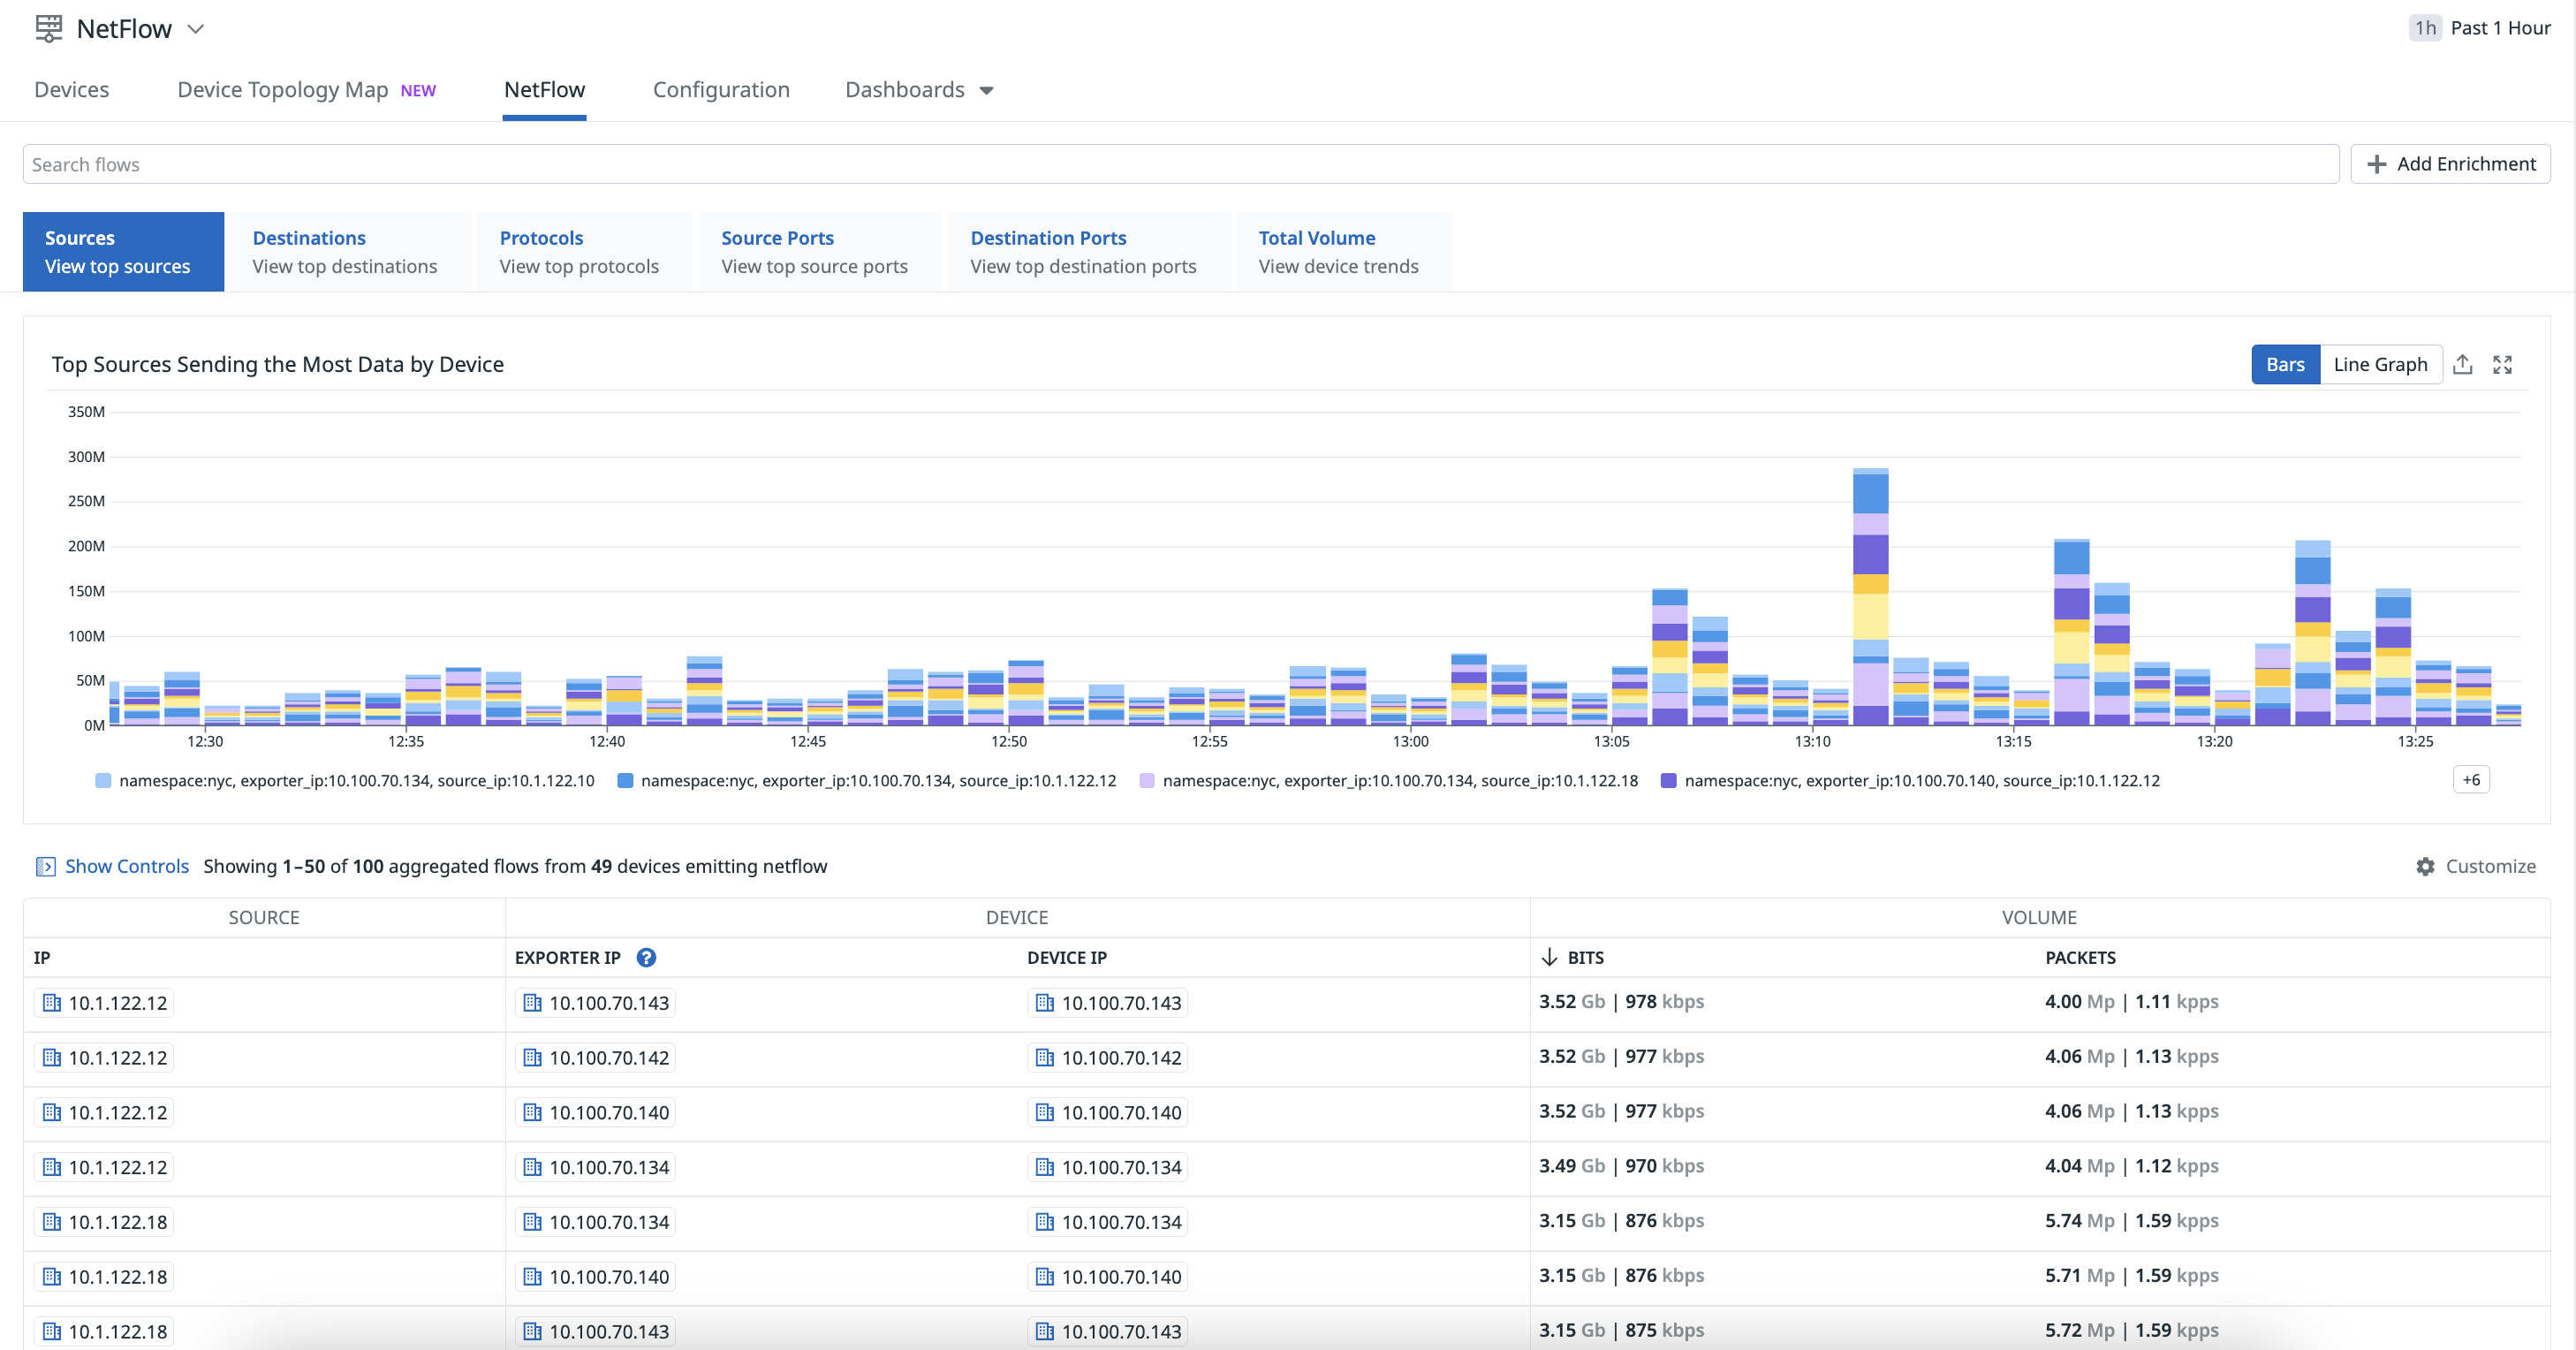
NetFlow Monitoring
Configure NetFlow Monitoring to visualize and monitor your flow records from your NetFlow-enabled devices.
Phase 4: Validate your data
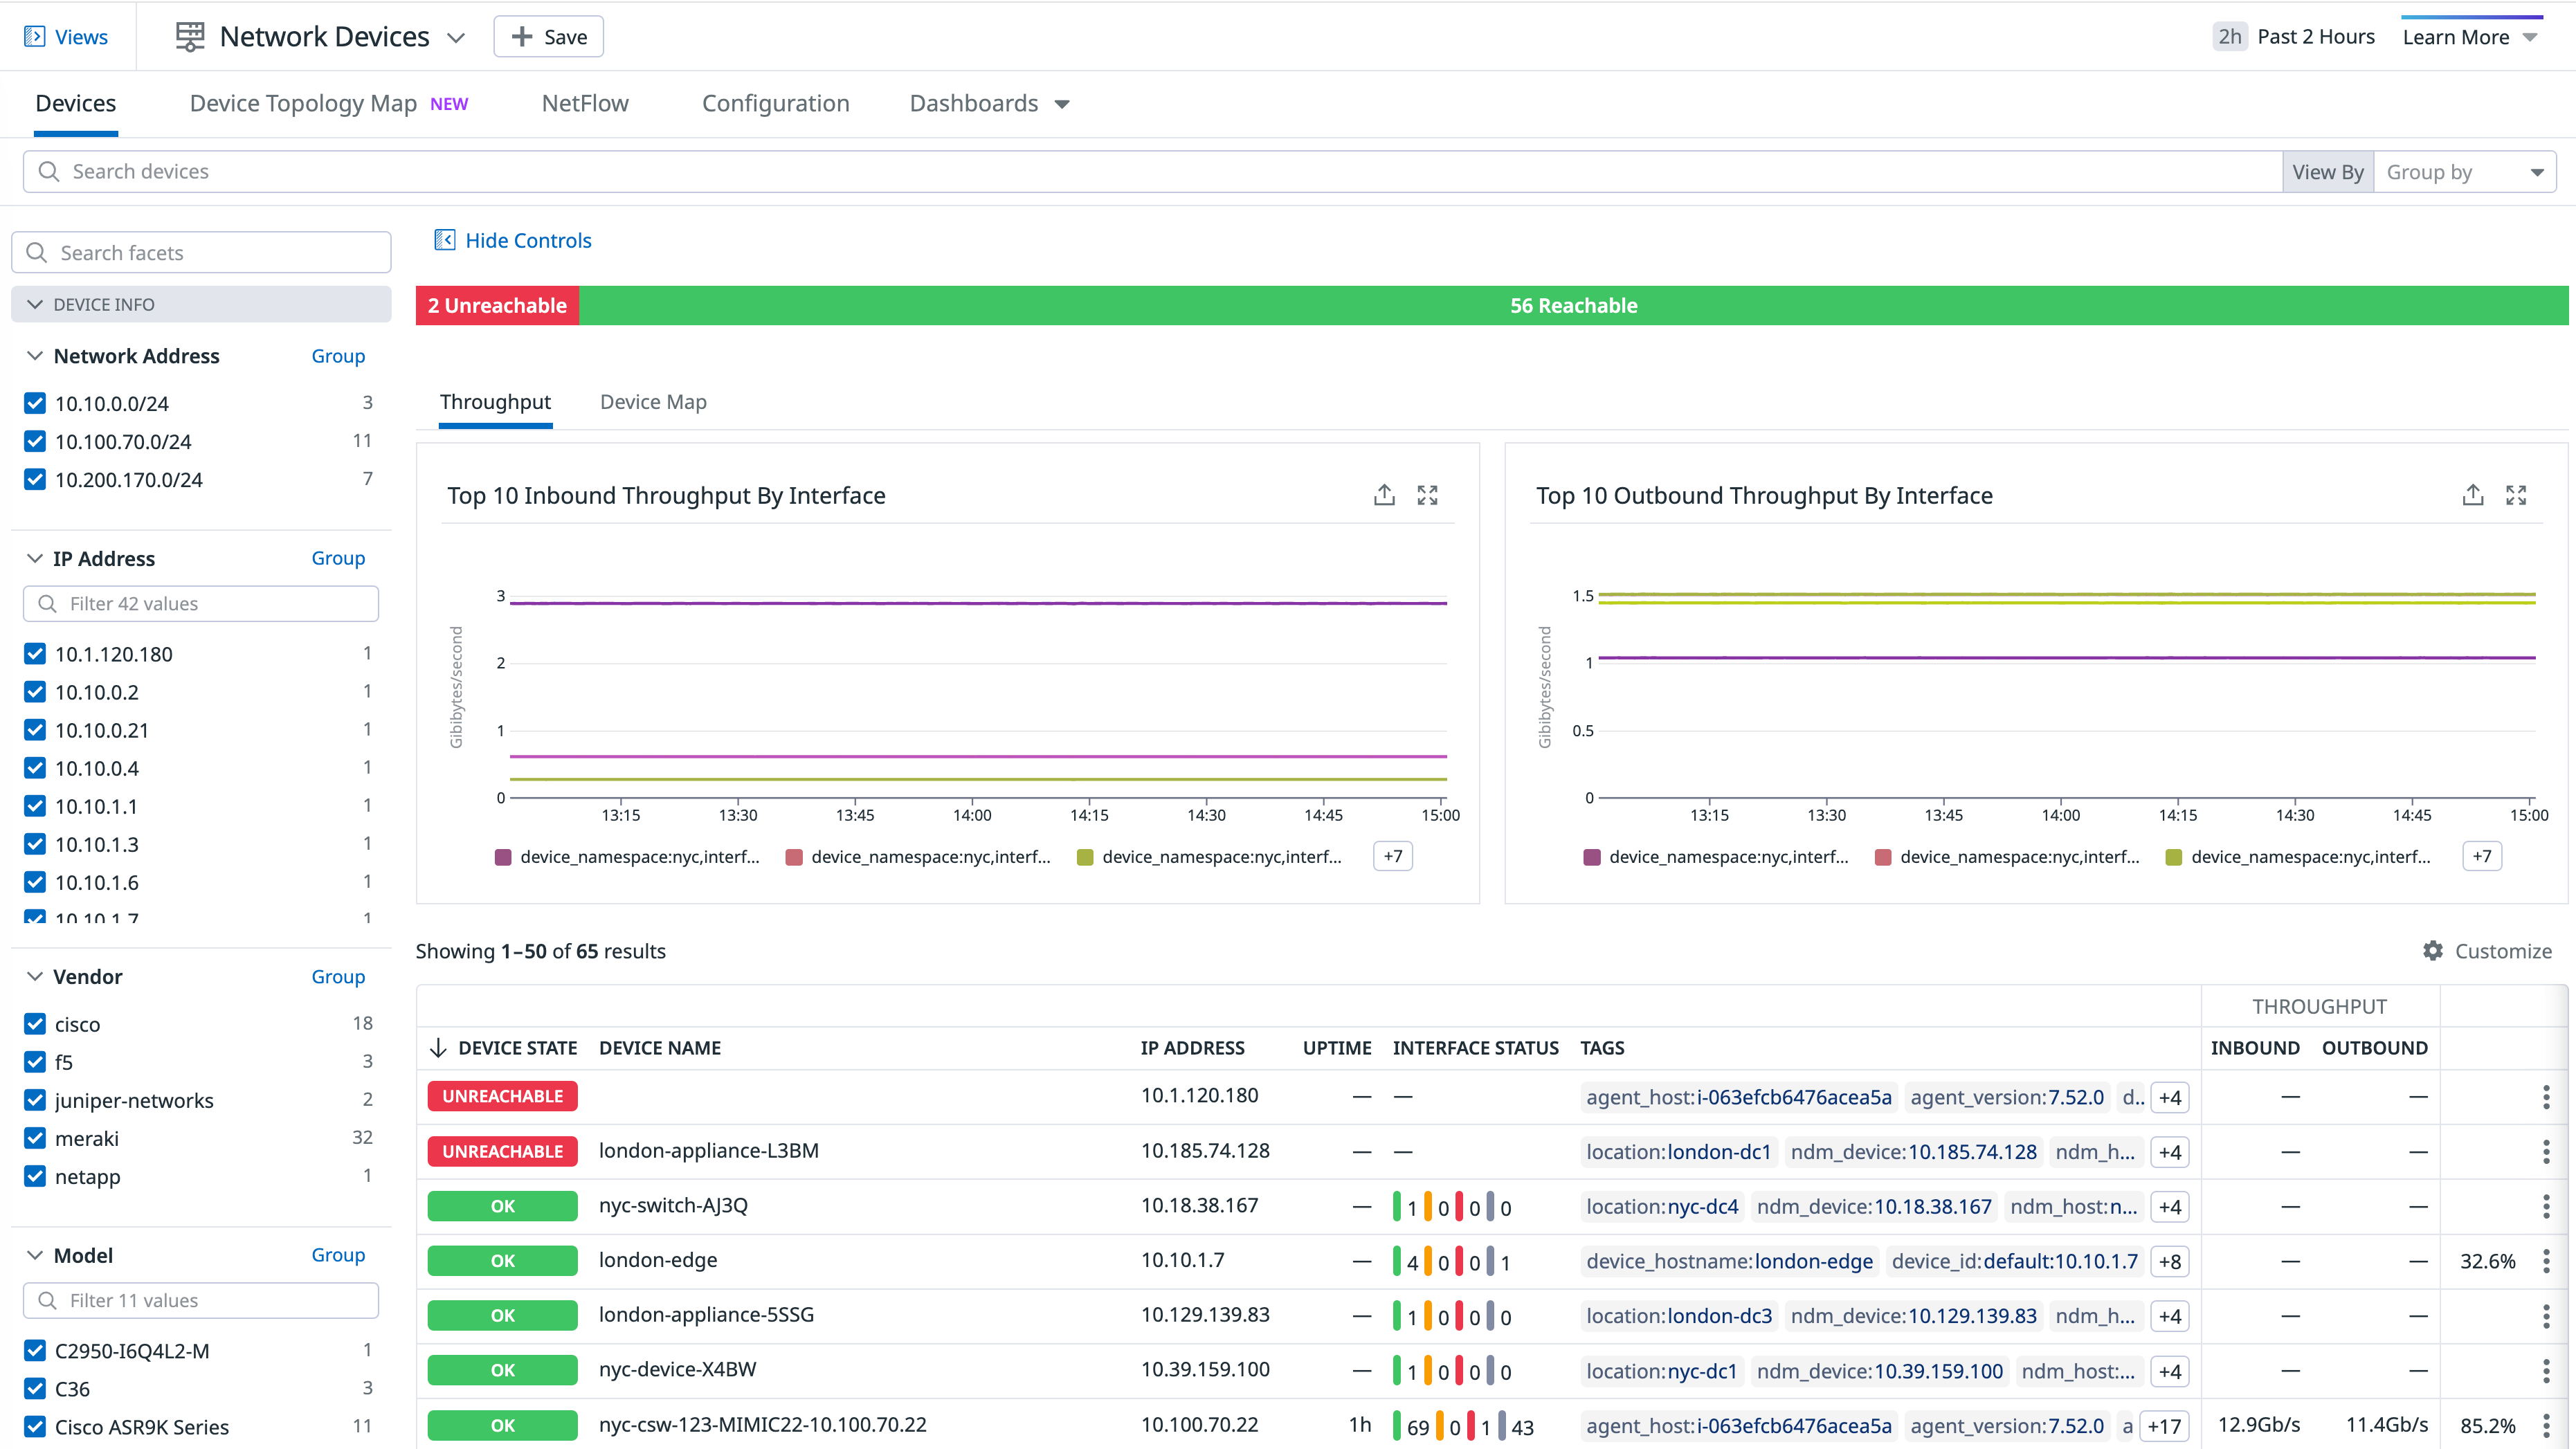
- Start monitoring your entire network infrastructure on the Network Devices page.
- View metrics collected on Datadog’s out-of-the-box dashboards:
- Use the Network Device Topology Map to identify and troubleshoot issues with your devices.
Troubleshooting
- See the Network Device Troubleshooting page for more information on troubleshooting your NDM issues.
Further Reading
Documentation, liens et articles supplémentaires utiles:


