- Principales informations
- Getting Started
- Datadog
- Site Datadog
- DevSecOps
- Serverless for AWS Lambda
- Agent
- Intégrations
- Conteneurs
- Dashboards
- Monitors
- Logs
- Tracing
- Profileur
- Tags
- API
- Service Catalog
- Session Replay
- Continuous Testing
- Surveillance Synthetic
- Incident Management
- Database Monitoring
- Cloud Security Management
- Cloud SIEM
- Application Security Management
- Workflow Automation
- CI Visibility
- Test Visibility
- Intelligent Test Runner
- Code Analysis
- Learning Center
- Support
- Glossary
- Standard Attributes
- Guides
- Agent
- Intégrations
- OpenTelemetry
- Développeurs
- Authorization
- DogStatsD
- Checks custom
- Intégrations
- Create an Agent-based Integration
- Create an API Integration
- Create a Log Pipeline
- Integration Assets Reference
- Build a Marketplace Offering
- Create a Tile
- Create an Integration Dashboard
- Create a Recommended Monitor
- Create a Cloud SIEM Detection Rule
- OAuth for Integrations
- Install Agent Integration Developer Tool
- Checks de service
- IDE Plugins
- Communauté
- Guides
- API
- Application mobile
- CoScreen
- Cloudcraft
- In The App
- Dashboards
- Notebooks
- DDSQL Editor
- Alertes
- Infrastructure
- Métriques
- Watchdog
- Bits AI
- Service Catalog
- API Catalog
- Error Tracking
- Service Management
- Infrastructure
- Universal Service Monitoring
- Conteneurs
- Sans serveur
- Surveillance réseau
- Cloud Cost
- Application Performance
- APM
- Profileur en continu
- Database Monitoring
- Agent Integration Overhead
- Setup Architectures
- Configuration de Postgres
- Configuration de MySQL
- Configuration de SQL Server
- Setting Up Oracle
- Setting Up MongoDB
- Connecting DBM and Traces
- Données collectées
- Exploring Database Hosts
- Explorer les métriques de requête
- Explorer des échantillons de requêtes
- Dépannage
- Guides
- Data Streams Monitoring
- Data Jobs Monitoring
- Digital Experience
- RUM et Session Replay
- Product Analytics
- Surveillance Synthetic
- Continuous Testing
- Software Delivery
- CI Visibility
- CD Visibility
- Test Visibility
- Exécuteur de tests intelligent
- Code Analysis
- Quality Gates
- DORA Metrics
- Securité
- Security Overview
- Cloud SIEM
- Cloud Security Management
- Application Security Management
- AI Observability
- Log Management
- Pipelines d'observabilité
- Log Management
- Administration
Segmentation
Cette page n'est pas encore disponible en français, sa traduction est en cours.
Si vous avez des questions ou des retours sur notre projet de traduction actuel, n'hésitez pas à nous contacter.
Si vous avez des questions ou des retours sur notre projet de traduction actuel, n'hésitez pas à nous contacter.
Overview
Segmentation is a feature in Product Analytics that allows you to analyze and understand specific groups or segments of your user base. By segmenting your users based on various characteristics and behaviors, you can uncover valuable insights, identify trends, and make data-driven decisions to optimize your product and user experience. For example, you can segment users by purchase amount, active users in a given country, users in a trial, or users in a trial who then converted to a paying organization.
Build a segment
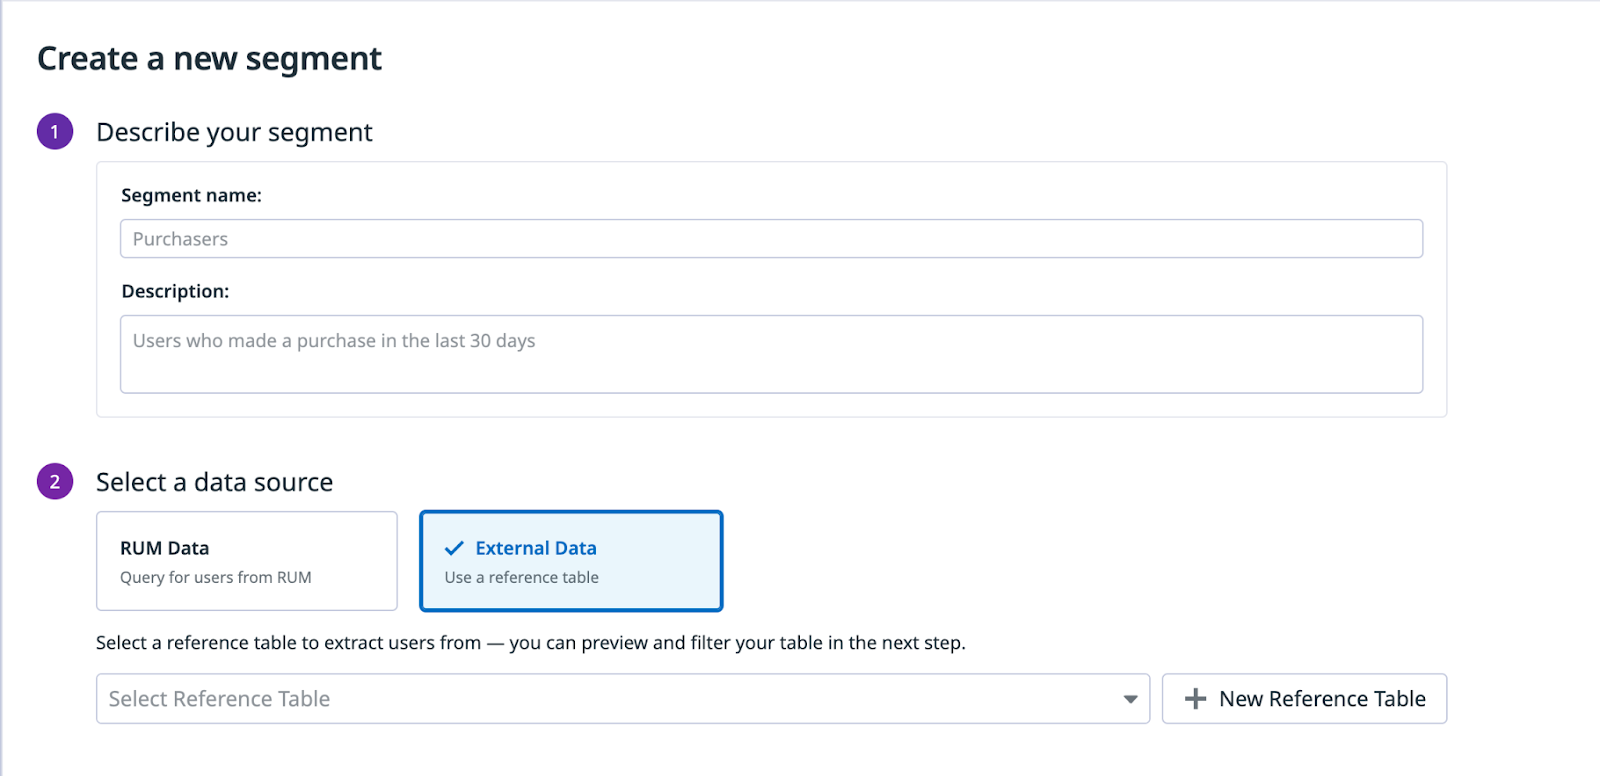
To create a new segment, navigate to Digital Experience Monitoring > Product Analytics > User Segments from the navigation. You have two sources you can choose from when building a new segment:
- Product Analytics data
- External data (upload a Reference Table)
Using Product Analytics data
To create a new segment using Product Analytics data:
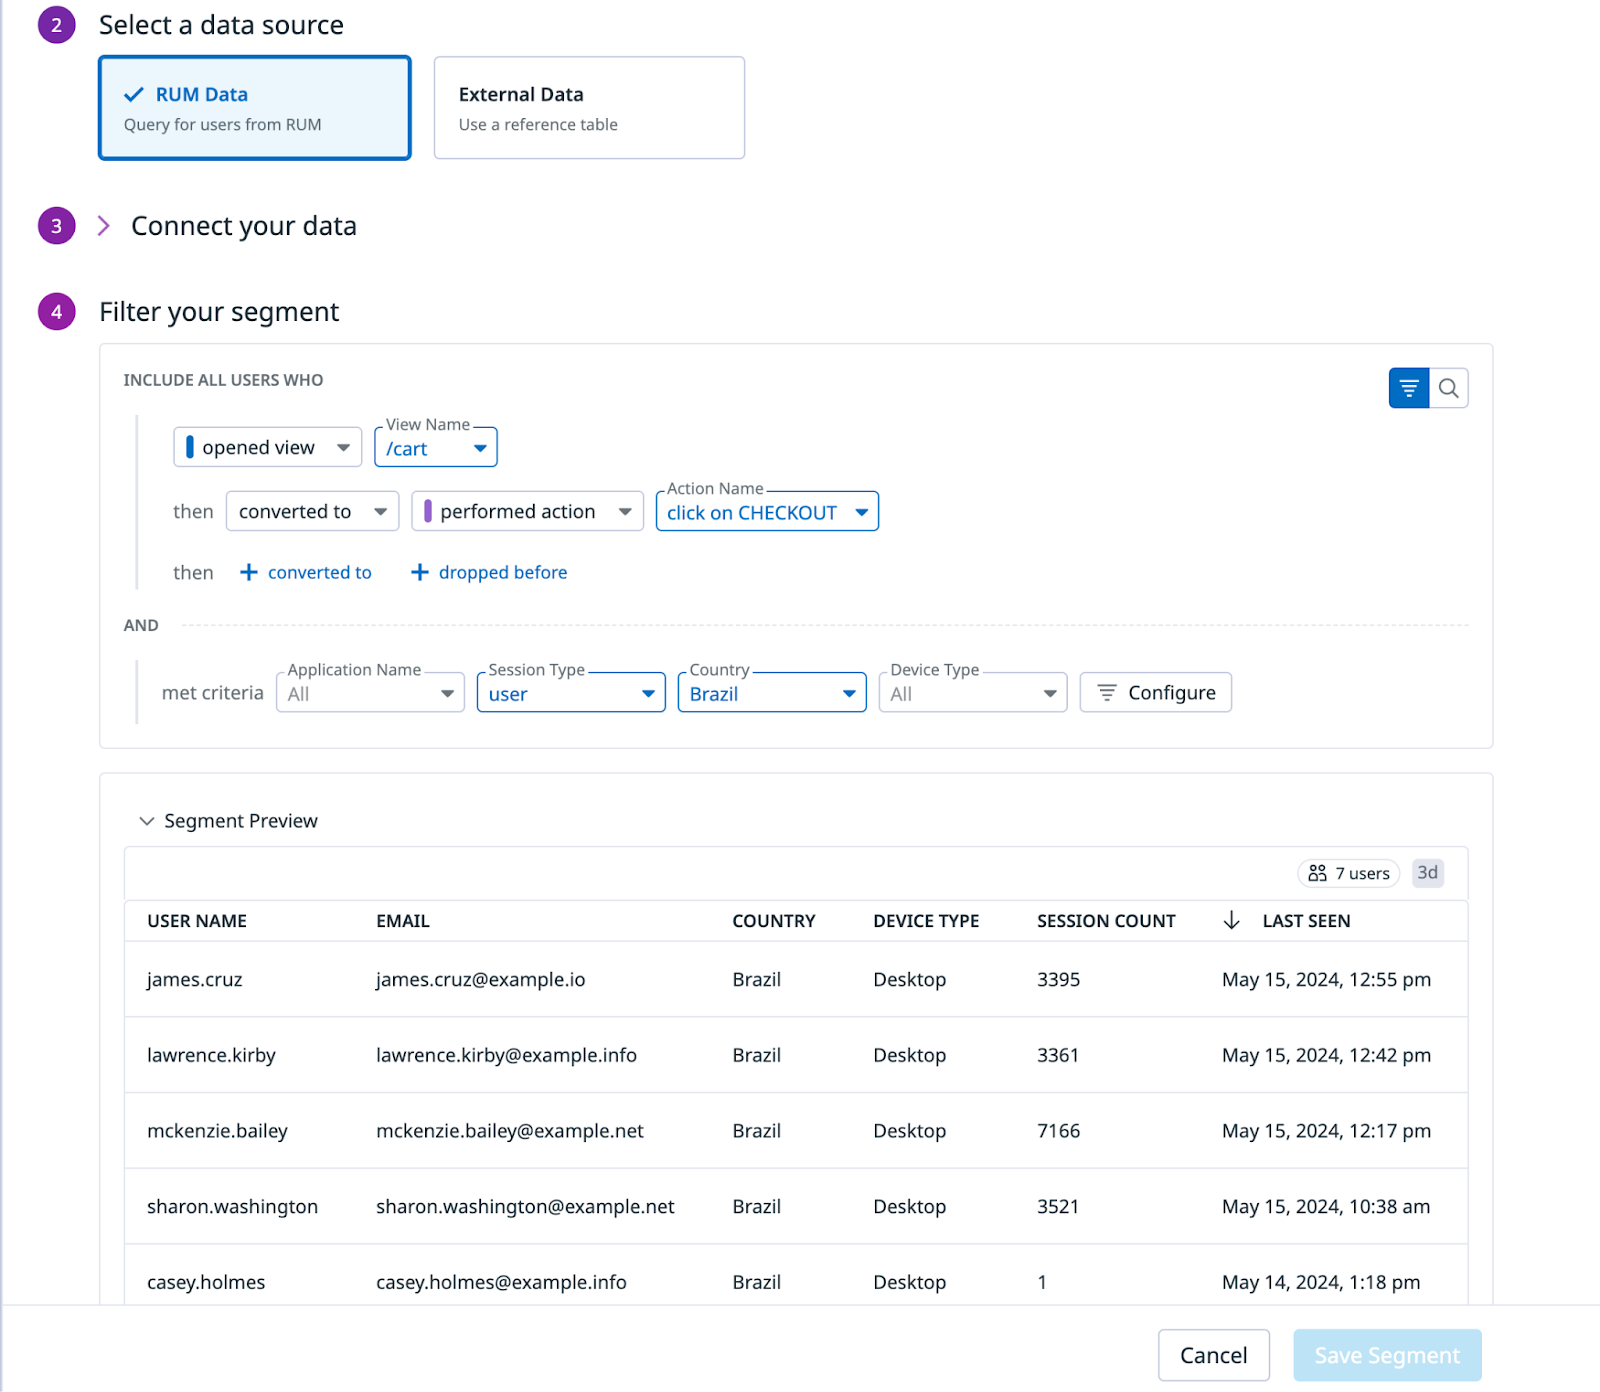
Choose the user attribute you want to connect your data with. In the below example, it is
usr.id, but you can use any user attribute available, such asusr.emailorusr.name.Under the Filter your segment section, you can filter on any attribute collected by the SDK, or custom attributes you added to create a granular user segment.
In the below example, the segment is filtered to all users who were on the
/cartpage and then clicked on the checkout button (and did so from Brazil):
Using external or third-party data
To create a segment using external or third-party data:
- See the Reference Tables documentation for how to upload and create a Reference Table.
- Make sure to properly connect the data type (for example,
usr.id,usr.name, orusr.email) to the column name. - For accuracy, ensure there is data in Product Analytics for users in the segment.
Leverage segments across Product Analytics
In sankeys
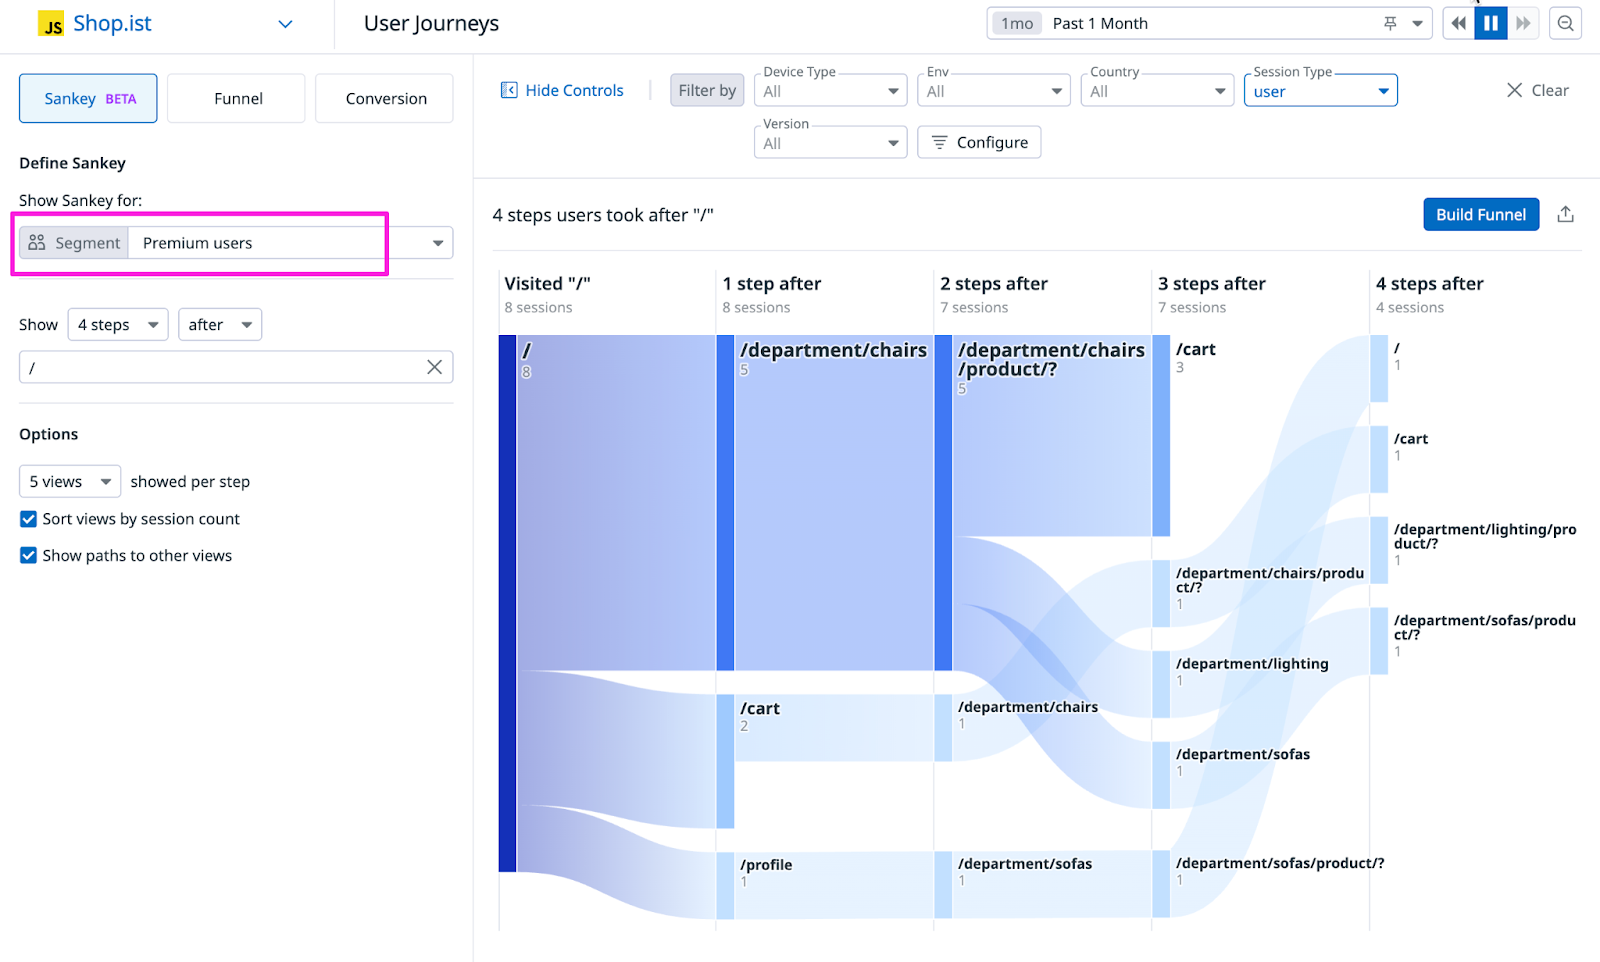
In the Sankey page, you can filter the data in the visualization to reflect a selected segment of users. This allows you to look at the experience and traffic patterns of a particular set of users in a given segment. The below example shows a Sankey diagram only for users in the “Premium users” segment.
In Analytics Explorer
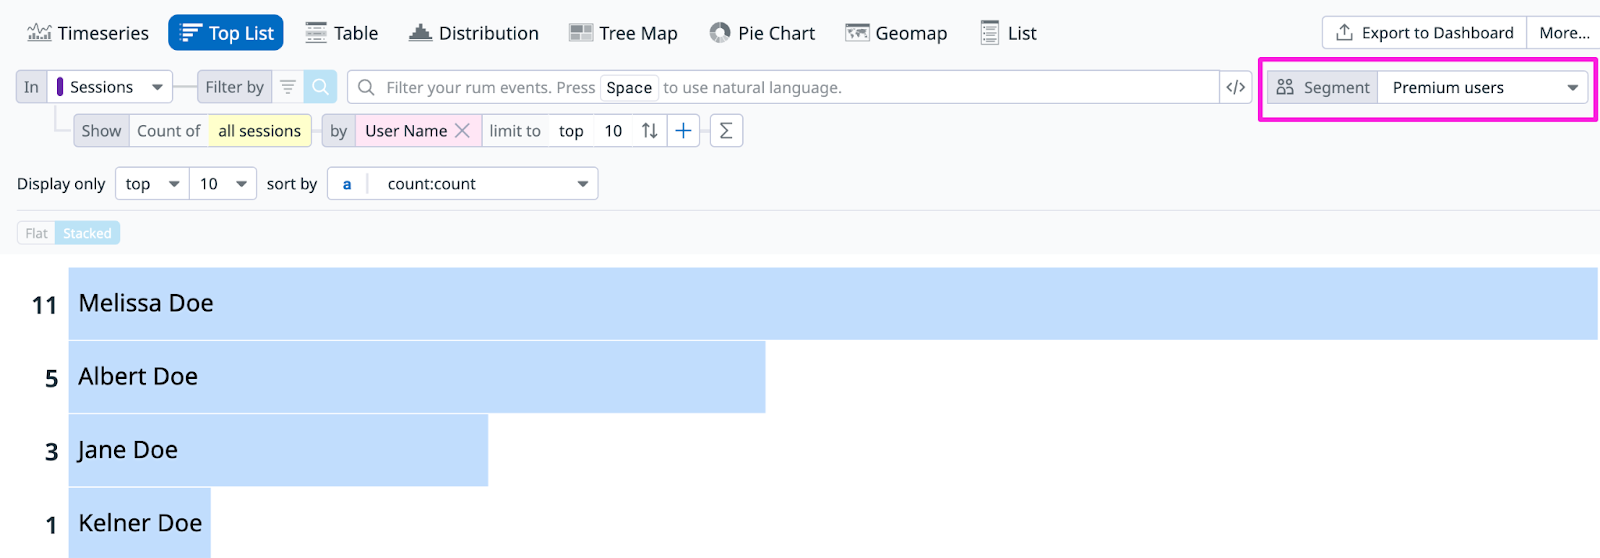
You can filter the data in the Analytics Explorer to reflect a selected set of users that are in a given segment. The example below shows a list of users in the “Premium users” segment who were active in the last month, organized by the number of sessions they had.
Further Reading
Documentation, liens et articles supplémentaires utiles:


