- 重要な情報
- はじめに
- Datadog
- Datadog サイト
- DevSecOps
- AWS Lambda のサーバーレス
- エージェント
- インテグレーション
- コンテナ
- ダッシュボード
- アラート設定
- ログ管理
- トレーシング
- プロファイラー
- タグ
- API
- Service Catalog
- Session Replay
- Continuous Testing
- Synthetic モニタリング
- Incident Management
- Database Monitoring
- Cloud Security Management
- Cloud SIEM
- Application Security Management
- Workflow Automation
- CI Visibility
- Test Visibility
- Intelligent Test Runner
- Code Analysis
- Learning Center
- Support
- 用語集
- Standard Attributes
- ガイド
- インテグレーション
- エージェント
- OpenTelemetry
- 開発者
- 認可
- DogStatsD
- カスタムチェック
- インテグレーション
- Create an Agent-based Integration
- Create an API Integration
- Create a Log Pipeline
- Integration Assets Reference
- Build a Marketplace Offering
- Create a Tile
- Create an Integration Dashboard
- Create a Recommended Monitor
- Create a Cloud SIEM Detection Rule
- OAuth for Integrations
- Install Agent Integration Developer Tool
- サービスのチェック
- IDE インテグレーション
- コミュニティ
- ガイド
- API
- モバイルアプリケーション
- CoScreen
- Cloudcraft
- アプリ内
- Service Management
- インフラストラクチャー
- アプリケーションパフォーマンス
- APM
- Continuous Profiler
- データベース モニタリング
- Data Streams Monitoring
- Data Jobs Monitoring
- Digital Experience
- Software Delivery
- CI Visibility (CI/CDの可視化)
- CD Visibility
- Test Visibility
- Intelligent Test Runner
- Code Analysis
- Quality Gates
- DORA Metrics
- セキュリティ
- セキュリティの概要
- Cloud SIEM
- クラウド セキュリティ マネジメント
- Application Security Management
- AI Observability
- ログ管理
- Observability Pipelines(観測データの制御)
- ログ管理
- 管理
Exploring APIs
このページは日本語には対応しておりません。随時翻訳に取り組んでいます。翻訳に関してご質問やご意見ございましたら、お気軽にご連絡ください。
Exploring endpoints
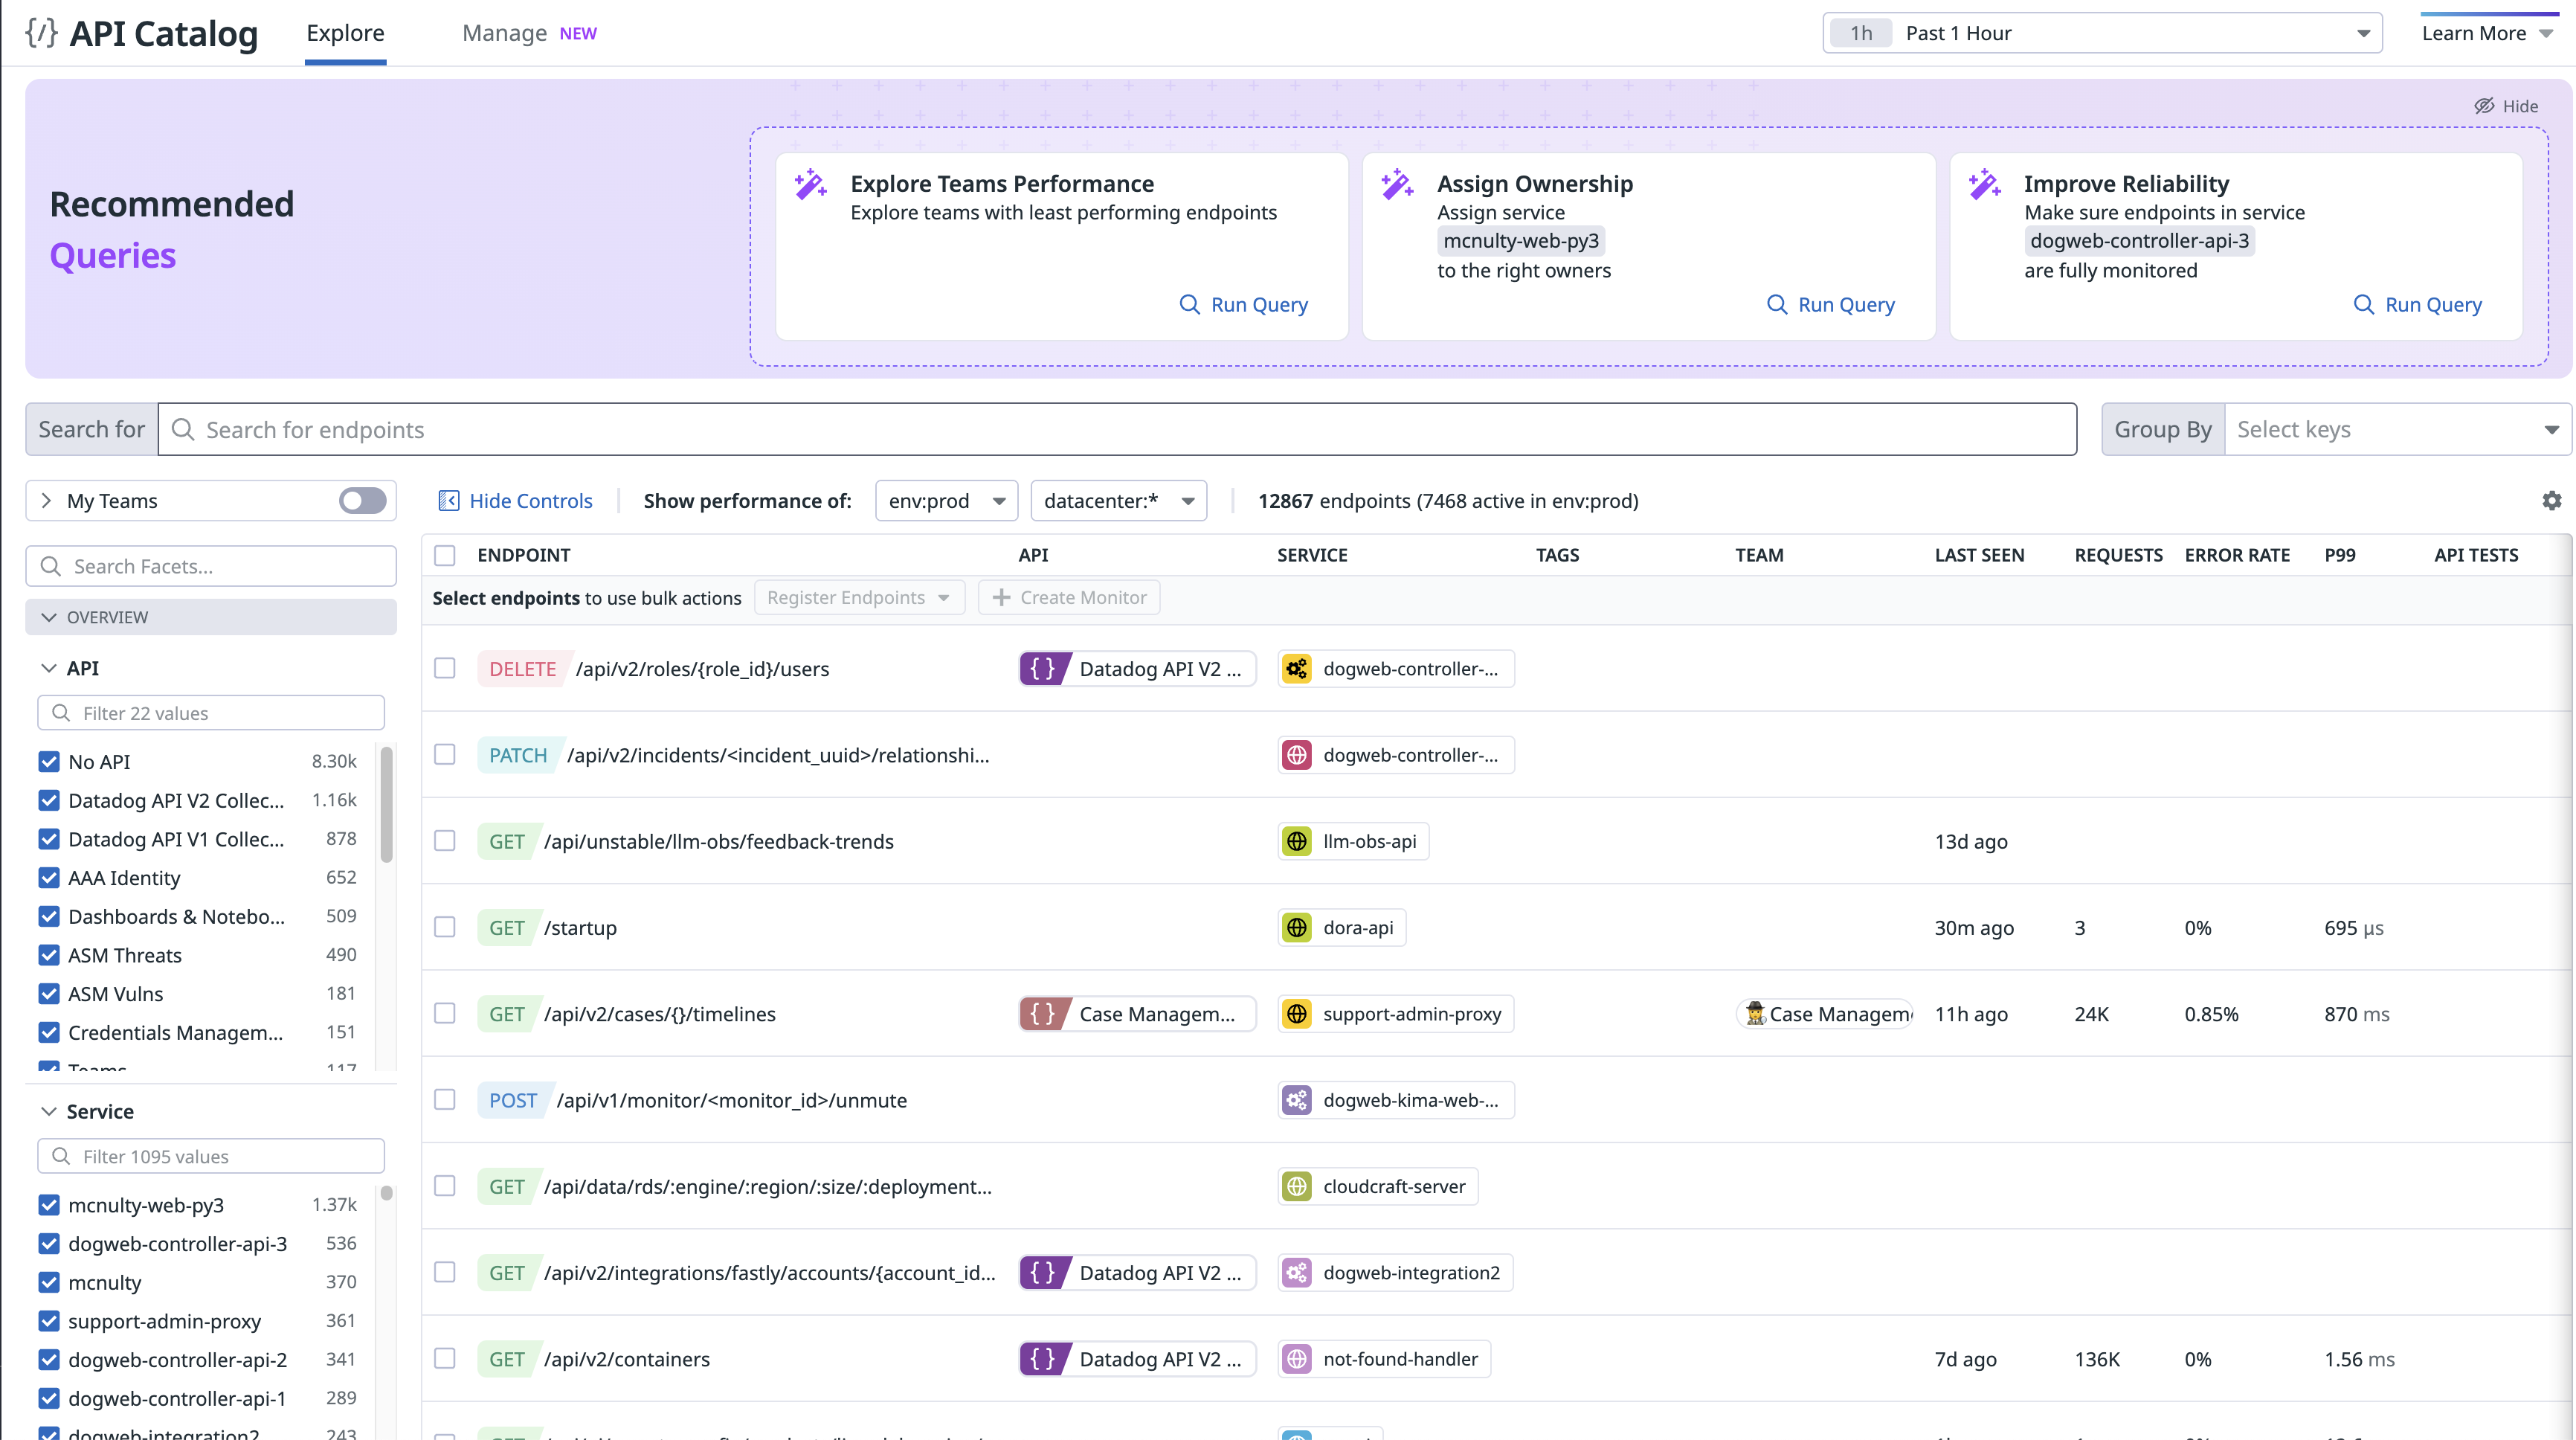
The API Catalog shows all endpoints in all environments in your Datadog organization. The performance data shown for each endpoint is scoped to the environment and time frame you select. You can browse and ask questions by querying different properties and metrics for more precise results, and you can filter using facets and tags.
Sort by a column in the table: Click a header to sort by. For example, click P99 to see endpoints with the highest 99th percentile for latency. Note: the P99 column may not be displayed by default.
View API ownership information: View the TEAM column for an endpoint. This information is inherited from the associated service definition in the Service Catalog. The service owner owns all of the endpoints connected to the service.
Filter or search the list of endpoints: Enter a query in the Search field. Search by service, path, or any other primary tag. Alternatively, select a combination of facets to filter by the Service or the Team the endpoint belongs to.
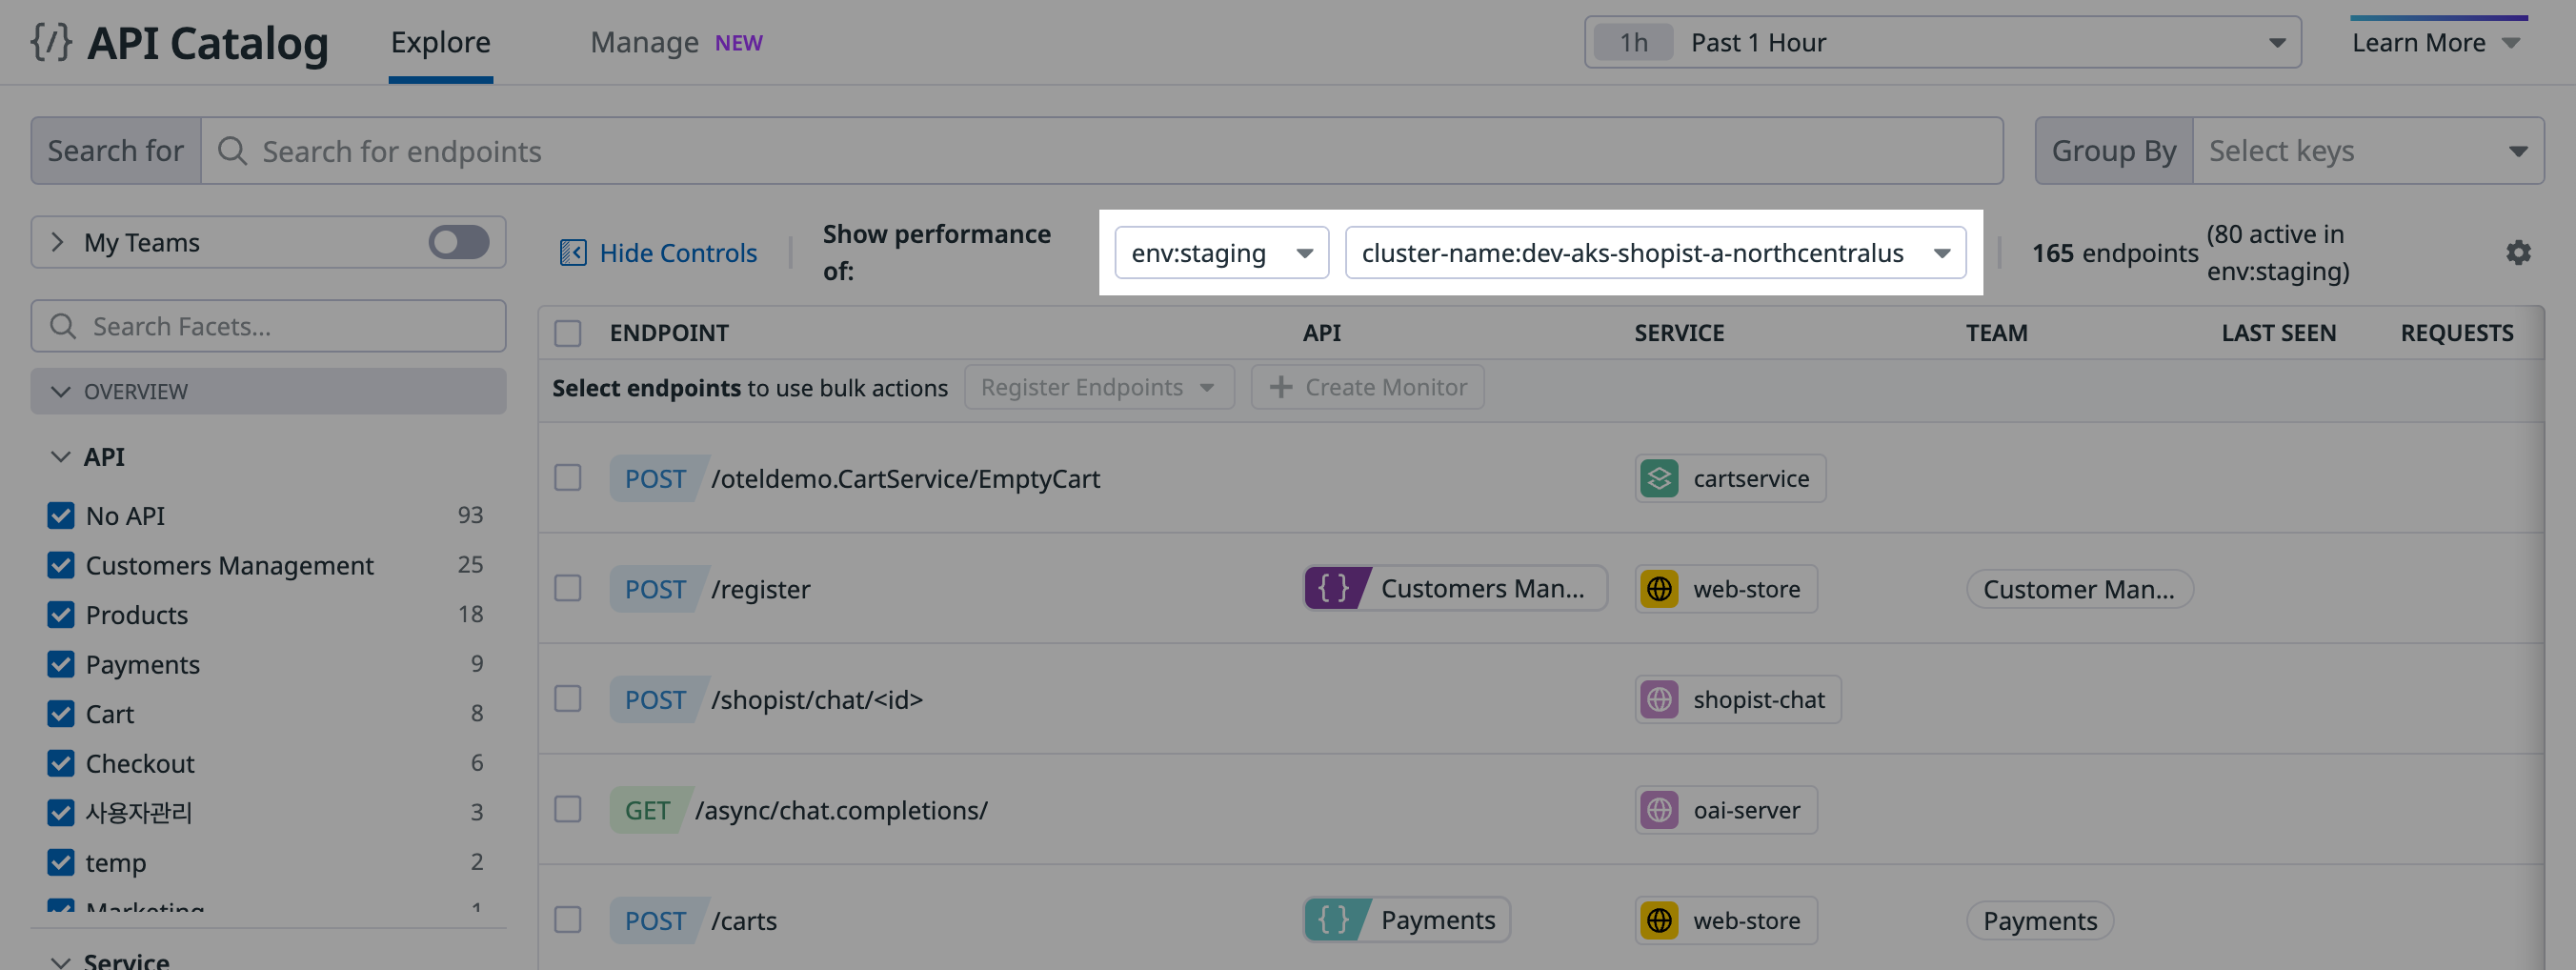
Scope the displayed data: Specify an environment, another primary tag (such as
datacenter), and a time frame in Show performance of:.
The following example shows how to scope the displayed data to a specific environment and cluster-name:
Detecting underperforming APIs and identifying opportunities for optimization
When exploring an endpoint, getting a higher resolution view of the API endpoint details is helpful.
Use the filtering, sorting, and searching options in API Catalog to find endpoints of interest. Click an endpoint to view its details page. Here you can see performance, errors, issues, deployments, monitors, ownership, a dependency map, and metadata information in one central location. From the details page, you can also add custom tags to the endpoint. You can also investigate the various types of telemetry using links to other areas of Datadog.
In the details page, you can:
- Look up a specific endpoint by path (for example,
/checkout) when it shows a high error rate and a high request count. - View the Requests & Errors graph and correlated Response Code graph to identify issues.
- Navigate to related telemetry like traces, logs, and errors.
The graphs on the details page are initially scoped to the same settings as the Explorer page. You can change those settings on the details page to suit your investigation by using the time frame selector and other scope dropdown menus.
Further reading
お役に立つドキュメント、リンクや記事:


