- 重要な情報
- はじめに
- Datadog
- Datadog サイト
- DevSecOps
- AWS Lambda のサーバーレス
- エージェント
- インテグレーション
- コンテナ
- ダッシュボード
- アラート設定
- ログ管理
- トレーシング
- プロファイラー
- タグ
- API
- Service Catalog
- Session Replay
- Continuous Testing
- Synthetic モニタリング
- Incident Management
- Database Monitoring
- Cloud Security Management
- Cloud SIEM
- Application Security Management
- Workflow Automation
- CI Visibility
- Test Visibility
- Intelligent Test Runner
- Code Analysis
- Learning Center
- Support
- 用語集
- Standard Attributes
- ガイド
- インテグレーション
- エージェント
- OpenTelemetry
- 開発者
- 認可
- DogStatsD
- カスタムチェック
- インテグレーション
- Create an Agent-based Integration
- Create an API Integration
- Create a Log Pipeline
- Integration Assets Reference
- Build a Marketplace Offering
- Create a Tile
- Create an Integration Dashboard
- Create a Recommended Monitor
- Create a Cloud SIEM Detection Rule
- OAuth for Integrations
- Install Agent Integration Developer Tool
- サービスのチェック
- IDE インテグレーション
- コミュニティ
- ガイド
- API
- モバイルアプリケーション
- CoScreen
- Cloudcraft
- アプリ内
- Service Management
- インフラストラクチャー
- アプリケーションパフォーマンス
- APM
- Continuous Profiler
- データベース モニタリング
- Data Streams Monitoring
- Data Jobs Monitoring
- Digital Experience
- Software Delivery
- CI Visibility (CI/CDの可視化)
- CD Visibility
- Test Visibility
- Intelligent Test Runner
- Code Analysis
- Quality Gates
- DORA Metrics
- セキュリティ
- セキュリティの概要
- Cloud SIEM
- クラウド セキュリティ マネジメント
- Application Security Management
- AI Observability
- ログ管理
- Observability Pipelines(観測データの制御)
- ログ管理
- 管理
遅いトレースやエンドポイントを調査する
本番環境においてアプリケーションのパフォーマンスに問題がある場合、分散型トレーシングとプロファイリングによるコードスタックトレースのベンチマークを統合することで、パフォーマンスのボトルネックを特定する強力な方法となります。APM 分散型トレーシングと Continuous Profiler の両方が有効になっているアプリケーションプロセスは、自動的にリンクされます。
Code Hotspots タブでスパン情報からプロファイリングデータに直接移動し、パフォーマンス問題に関連する特定のコード行を見つけることができます。同様に、低速でリソースを消費するエンドポイントも、プロファイリング UI で直接デバッグできます。
遅いトレースのコードのホットスポットを特定する
前提条件
Code Hotspots identification is enabled by default when you turn on profiling for your Java service on Linux and macOS. The feature is not available on Windows.
For manually instrumented code, continuous profiler requires scope activation of spans:
final Span span = tracer.buildSpan("ServicehandlerSpan").start();
try (final Scope scope = tracer.activateSpan(span)) { // mandatory for Datadog continuous profiler to link with span
    // worker thread impl
  } finally {
    // Step 3: Finish Span when work is complete
    span.finish();
  }
Java Flight Recorder (JFR) の代わりに Datadog プロファイラーを使用することを強くお勧めします。
Python サービスのプロファイリングを起動すると、コードのホットスポット識別がデフォルトで有効化されます。
dd-trace-py バージョン 0.44.0+ が必要です。
To enable the timeline feature:
- Upgrade
dd-trace-pyto version 2.10.5 or later - Set environment variable
DD_PROFILING_TIMELINE_ENABLEDtotrue
Ruby サービスのプロファイリングを起動すると、コードのホットスポット識別がデフォルトで有効化されます。
The new timeline feature is enabled by default in dd-trace-rb 1.21.1+.
To additionally enable showing GC in timeline:
- set
DD_PROFILING_FORCE_ENABLE_GC=true
Linux と macOS で Node.js サービスのプロファイリングを有効にすると、Code Hotspots の識別がデフォルトで有効になります。Windows ではこの機能は利用できません。
dd-trace-js のバージョン 5.0.0 以降、4.24.0 以降または 3.45.0 以降が必要です。
The new timeline feature is enabled by default in dd-trace-js 5.11.0+, 4.35.0+, and 3.56.0+.
Go サービスのプロファイリングを起動すると、コードのホットスポット識別がデフォルトで有効化されます。
To enable the new timeline feature, set the environment variables below:
os.Setenv("DD_PROFILING_EXECUTION_TRACE_ENABLED", "true")
os.Setenv("DD_PROFILING_EXECUTION_TRACE_PERIOD", "15m")
Setting these variables will record up to 1 minute (or 5 MiB) of execution tracing data every 15 minutes.
このデータは、
- 検索クエリに
go_execution_traced:yesを追加して Profile List で表示できます。プロファイルをクリックすると Profile Timeline が表示されます。さらに深く見るには、プロファイルをダウンロードし、go tool traceまたは gotraceui を使用して、含まれているgo.traceファイルを表示します。 - 検索クエリに
@go_execution_traced:yes(@に注意) を追加してトレースエクスプローラーで表示できます。スパンをクリックし、Code Hotspotsタブを選択してスパンタイムラインを表示します。
実行トレースを記録している間、アプリケーションがガベージコレクションのように CPU 使用率の増加を観測する可能性があります。ほとんどのアプリケーションでは大きな影響はないはずですが、Go 1.21 にはこのオーバーヘッドをなくすためのパッチが含まれています。
This capability requires dd-trace-go version 1.37.0+ (1.52.0+ for timeline view) and works best with Go version 1.18 or later (1.21 or later for timeline view).
.NET サービスのプロファイリングを起動すると、コードのホットスポット識別がデフォルトで有効化されます。
This capability requires dd-trace-dotnet version 2.30.0+.
PHP サービスのプロファイリングを起動すると、コードのホットスポット識別がデフォルトで有効化されます。
Requires dd-trace-php version 0.71+.
To enable the timeline feature:
- Upgrade to
dd-trace-phpversion 0.98+. - Set the environment variable
DD_PROFILING_TIMELINE_ENABLED=1or INI settingdatadog.profiling.timeline_enabled=1
スパン実行の内訳
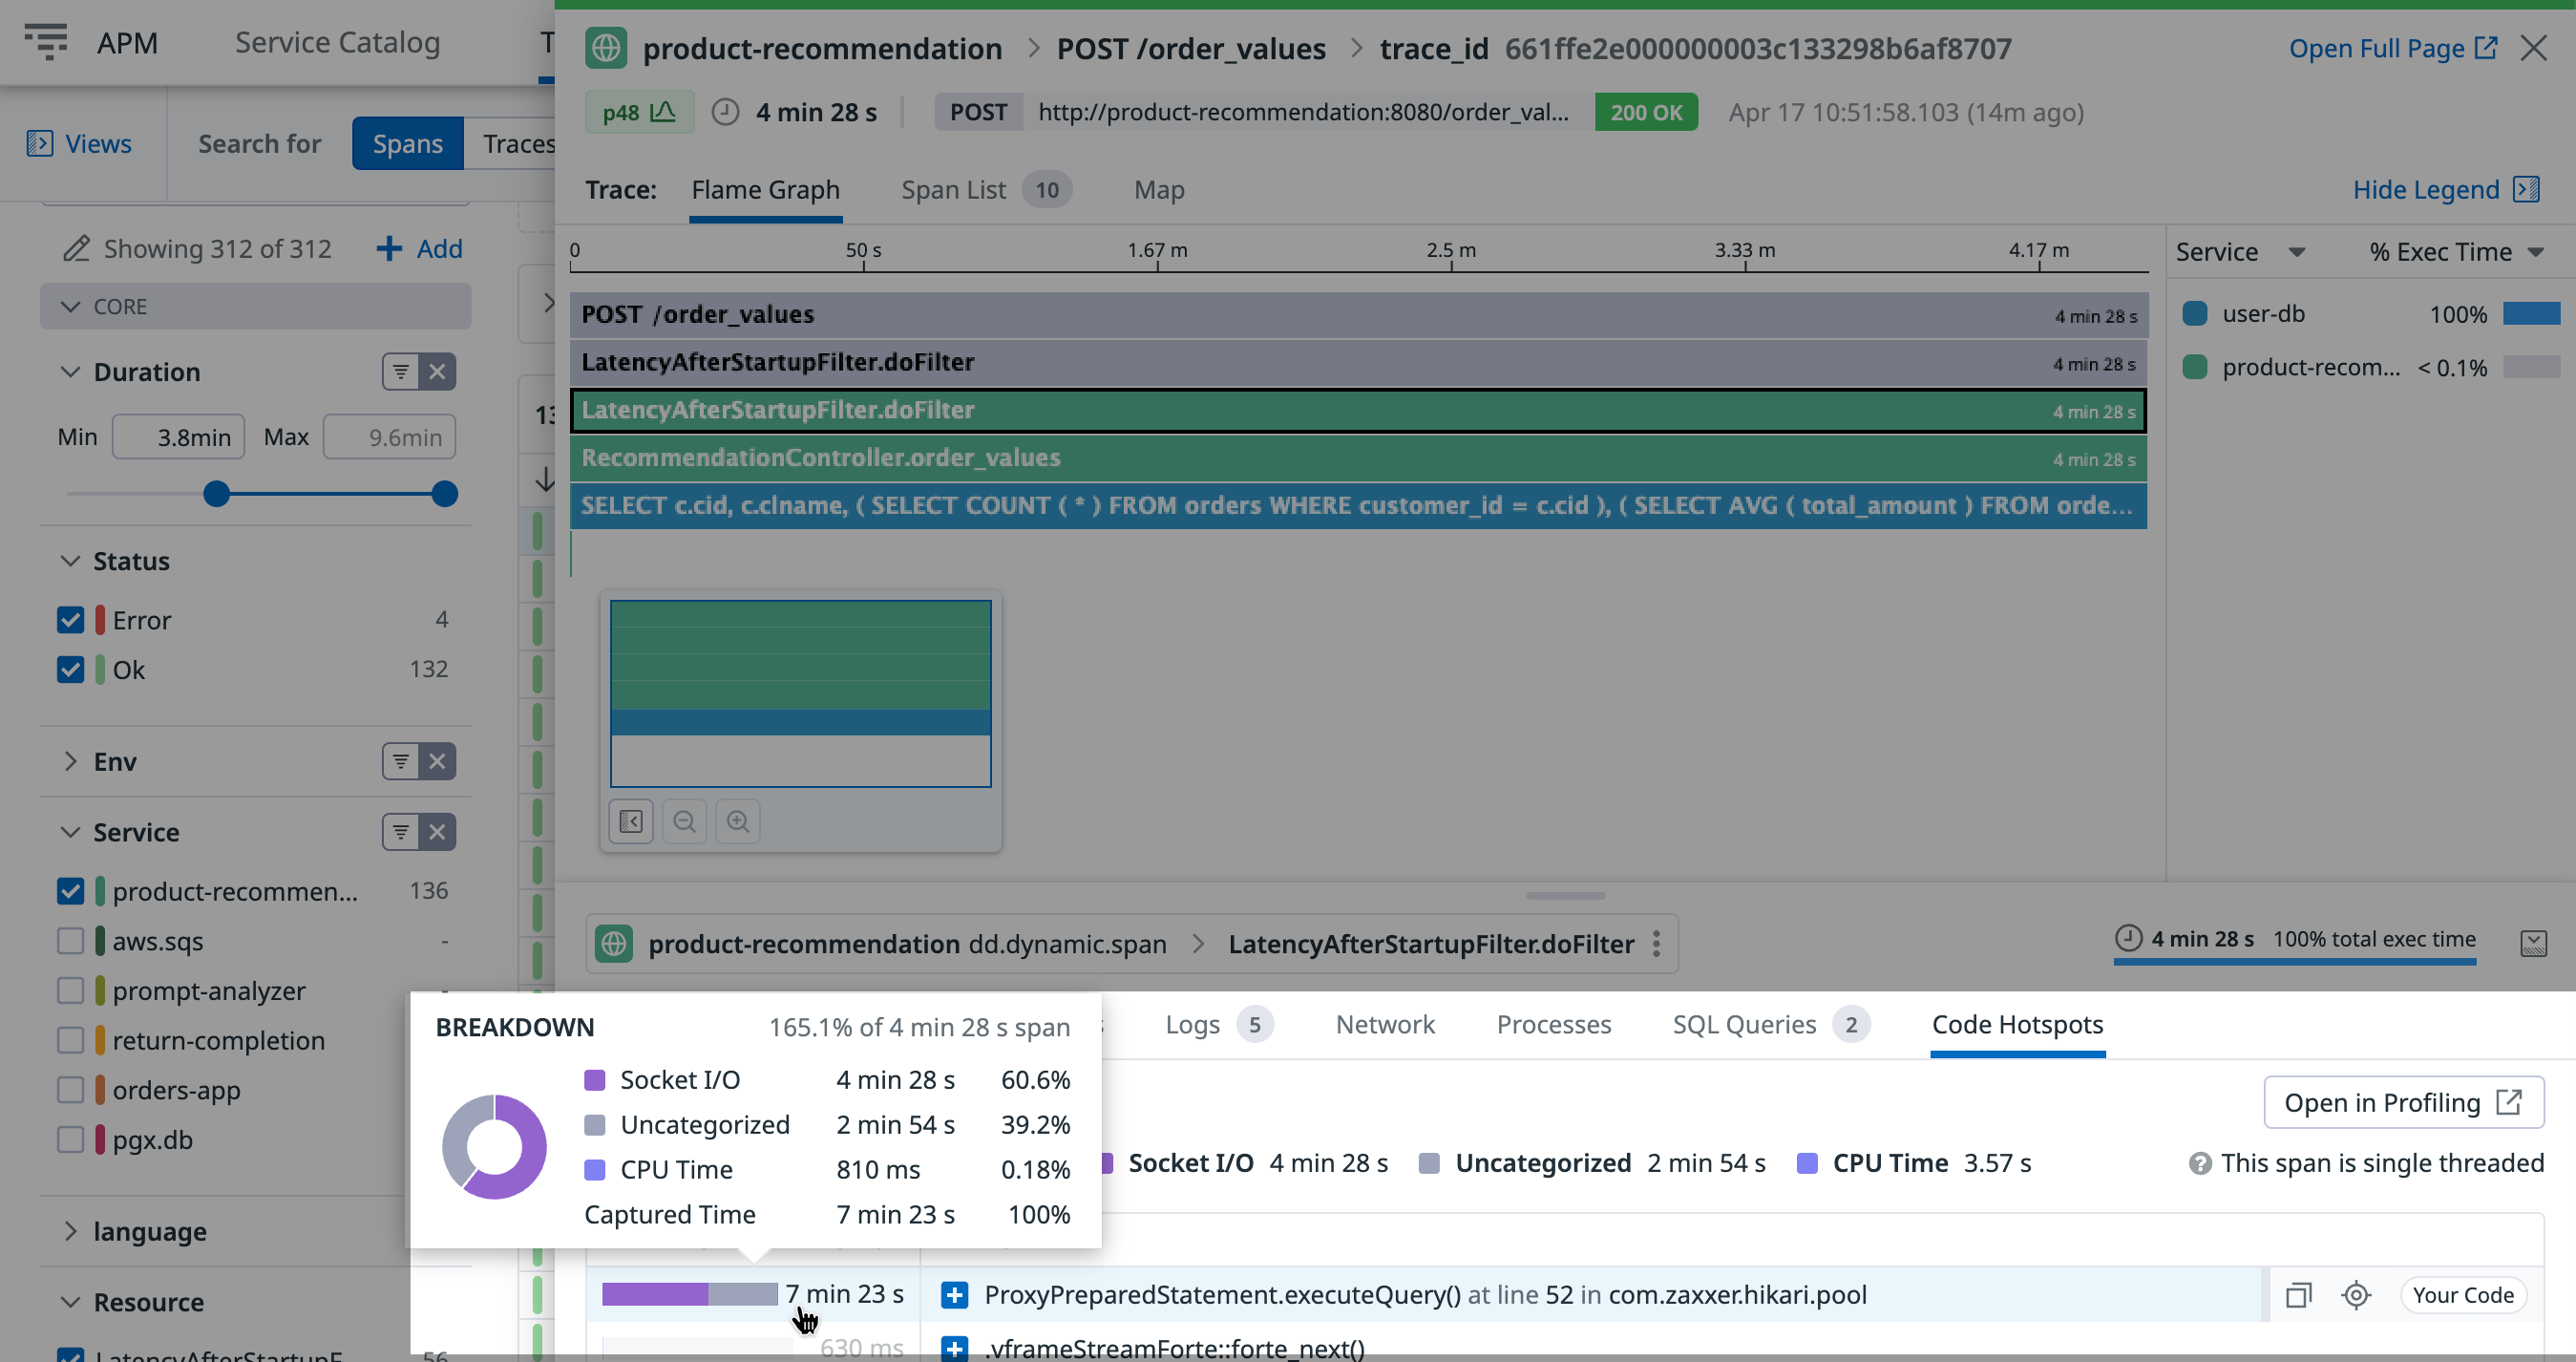
各トレースのビューから、選択したスパンの範囲内のプロファイリングデータが Code Hotspots タブに表示されます。
左側の値は、選択されたスパンの間にそのメソッド呼び出しに費やされた時間を表します。ランタイムと言語によって、カテゴリーは異なります。
- CPU は、CPU タスクを実行するのに費やした時間を示します。
- Synchronization は、モニター待ちの時間、スレッドがスリープしている時間、パークしている時間などを表示します。
- VM operations は、VM オペレーション (例えば、ガベージコレクション、コンパイル、セーフポイント、ヒープダンプ) の待ち時間を示します。
- ファイル I/O は、ディスクの読み取り/書き込み動作の実行待ちに費やした時間を示します。
- ソケット I/O は、ネットワークの読み取り/書き込み動作の実行待ちに費やした時間を示します。
- Monitor enter は、スレッドがロックでブロックされている時間を表示します。
- Uncategorized は、前述のカテゴリーに分類できないスパンの実行に要した時間を表示します。
- CPU は、CPU タスクを実行するのに費やした時間を示します。
- Lock Wait は、スレッドがロックでブロックされている時間を表示します。
- Uncategorized は、前述のカテゴリーに分類できないスパンの実行に要した時間を表示します。
- CPU は、CPU タスクを実行するのに費やした時間を示します。
- Uncategorized は、CPU 実行以外のスパン実行に要した時間を表示します。
- CPU は、CPU タスクの実行にかかった時間を示します。Node.js experimental CPU プロファイラーで収集されたプロファイルにのみ表示されます。
- Uncategorized は、CPU 実行以外のスパン実行に要した時間を表示します。
- CPU は、CPU タスクを実行するのに費やした時間を示します。
- Off-CPU は、CPU 実行以外のスパン実行に要した時間を表示します。
- CPU は、CPU タスクを実行するのに費やした時間を示します。
- Lock Wait は、スレッドがロックでブロックされている時間を表示します。
- Uncategorized は、前述のカテゴリーに分類できないスパンの実行に要した時間を表示します。
- CPU は、CPU タスクを実行するのに費やした時間を示します。
- Uncategorized は、CPU 実行以外のスパン実行に要した時間を表示します。
Click the plus icon + to expand the stack trace to that method in reverse order. Hover over the value to see the percentage of time explained by category.
Span execution timeline view
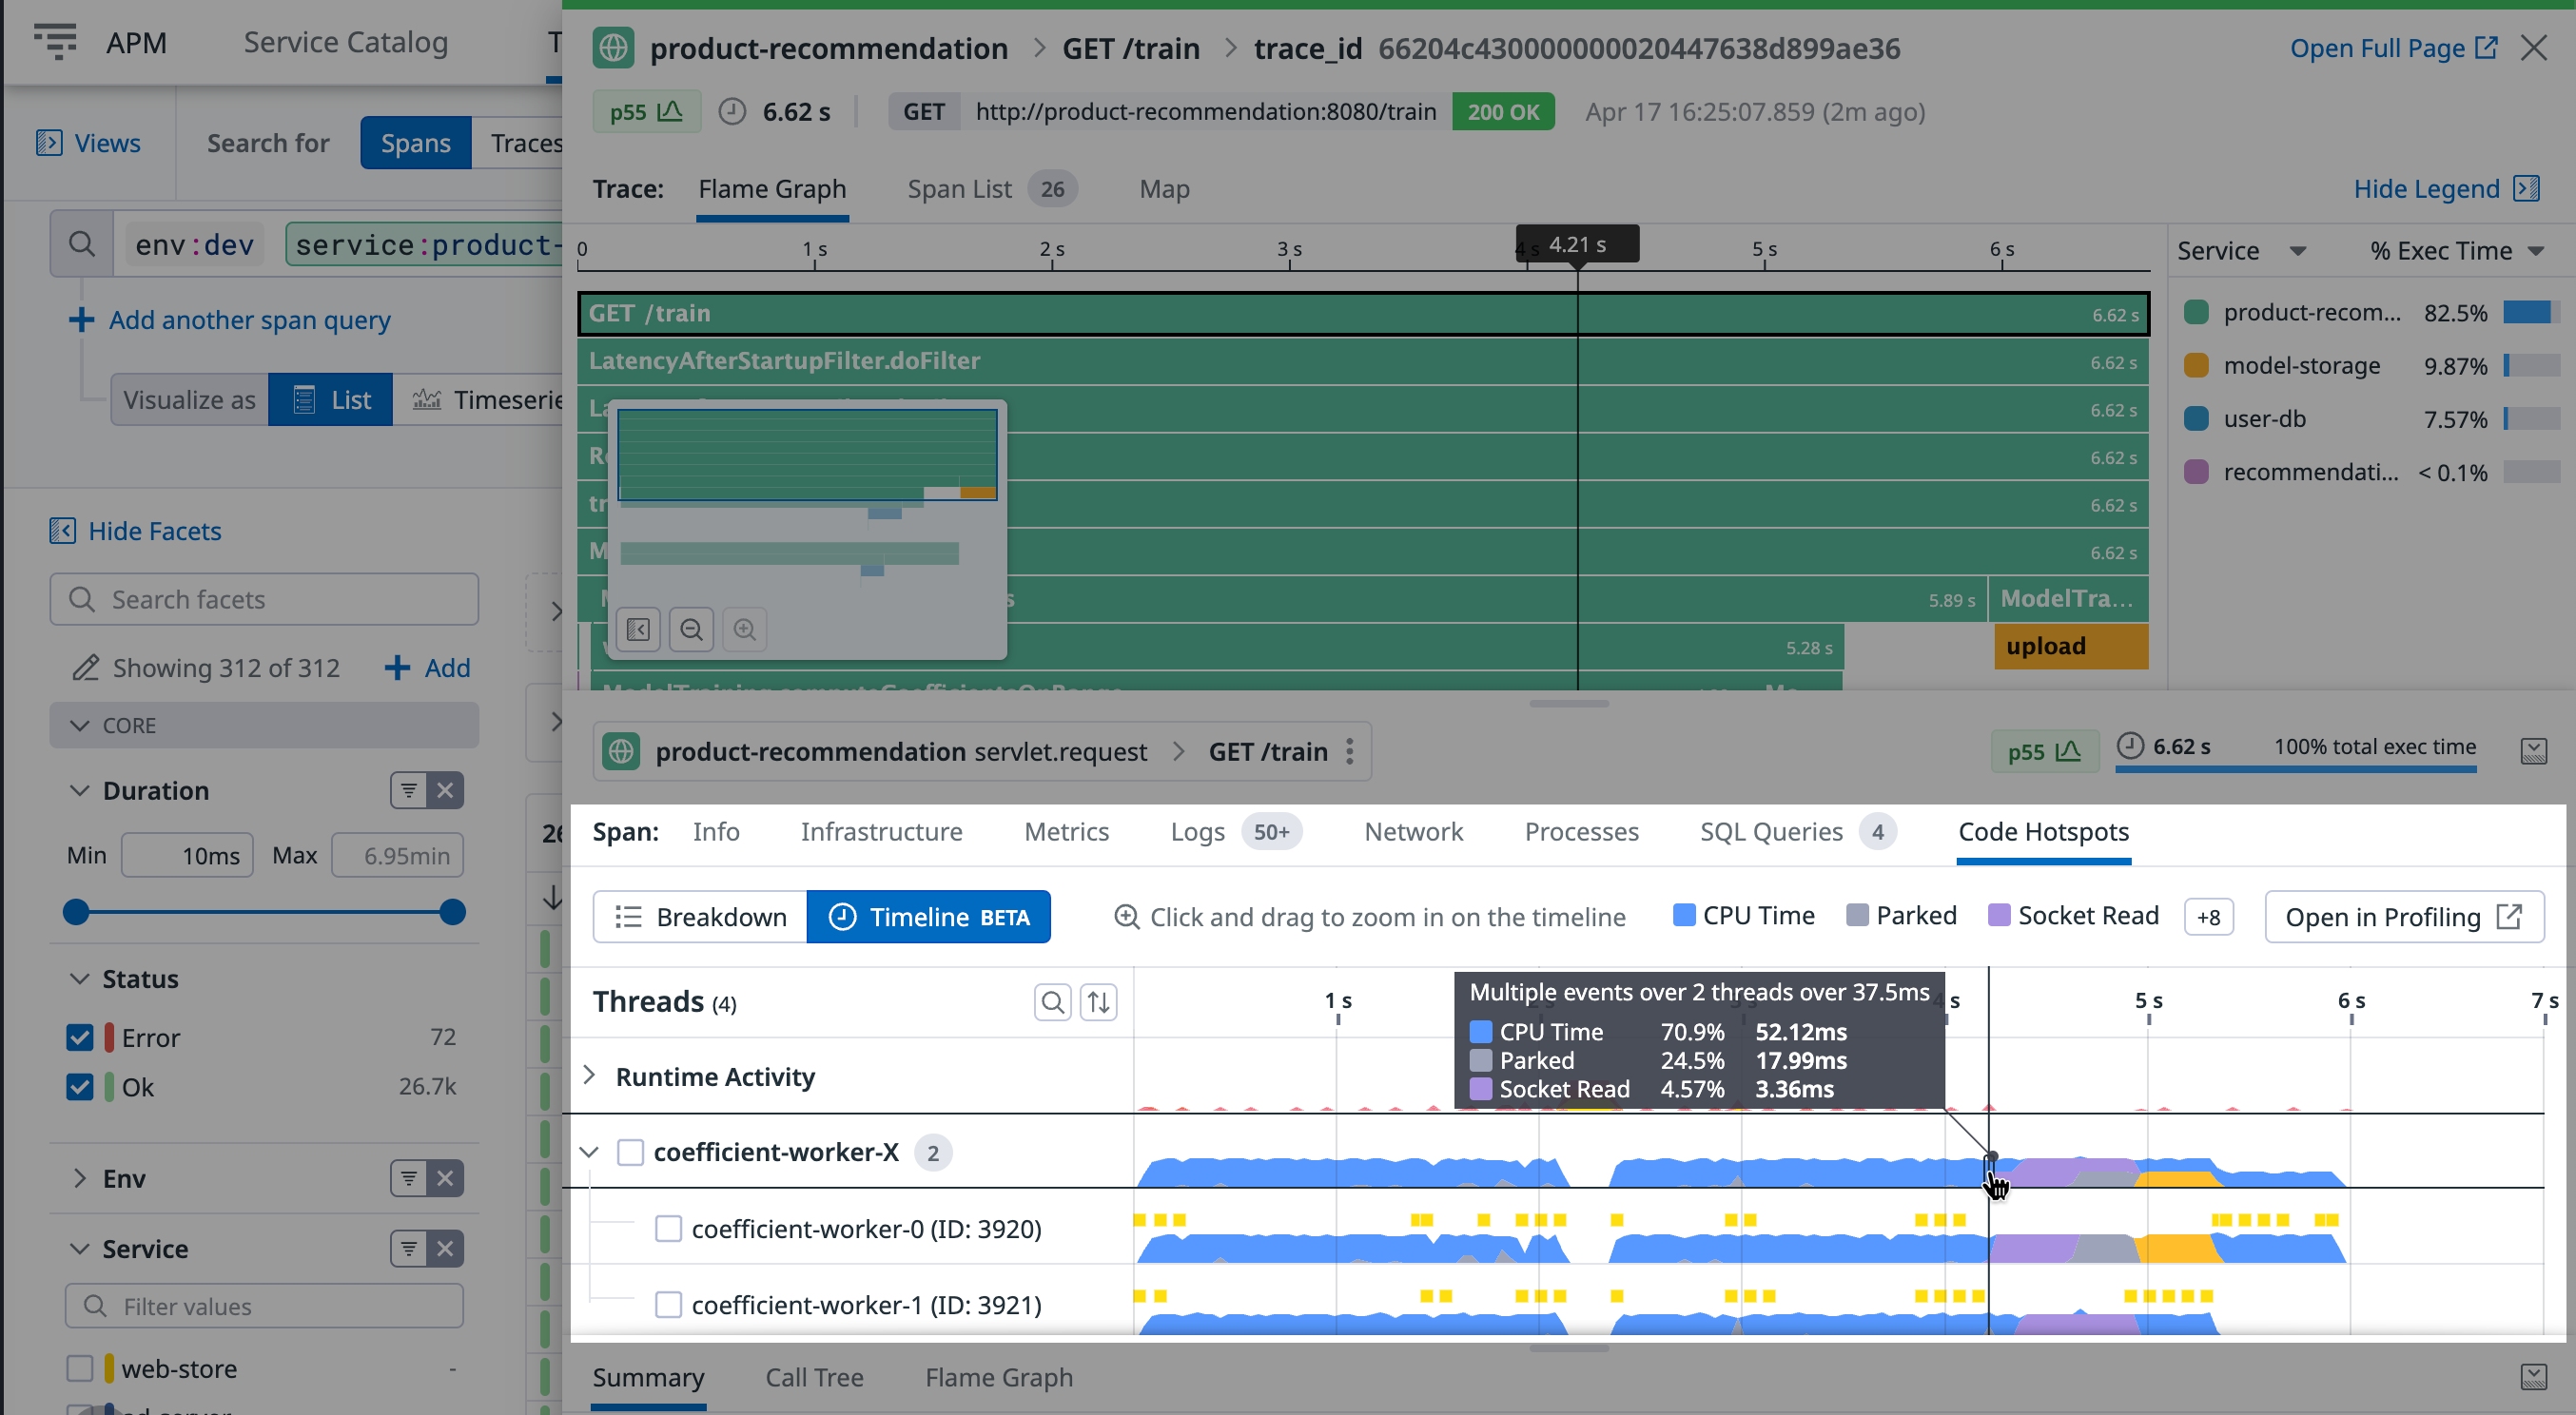
Timeline ビューは、スパンの期間における時間ベースのパターンと作業分布を表示します。
スパンの Timeline ビューでは、次のことが可能です。
- 時間のかかるメソッドを分離する。
- スレッド間の複雑な相互作用を整理する。
- Surface runtime activity that impacted the request.
ランタイムや言語によって、レーンは異なります。
Each lane represents a thread. Threads from a common pool are grouped together. You can expand the pool to view details for each thread.
上のレーンは、余分なレイテンシーを追加するかもしれないランタイムアクティビティです。これらはリクエスト自体に関係ないこともあります。
For additional information about debugging slow p95 requests or timeouts using the timeline, see the blog post Understanding Request Latency with Profiling.
See prerequisites to learn how to enable this feature for Python.
Each lane represents a thread. Threads from a common pool are grouped together. You can expand the pool to view details for each thread.
Each lane represents a goroutine. This includes the goroutine that started the selected span, as well as any goroutines it created and their descendants. Goroutines created by the same go statement are grouped together. You can expand the group to view details for each goroutine.
上のレーンは、余分なレイテンシーを追加するかもしれないランタイムアクティビティです。これらはリクエスト自体に関係ないこともあります。
タイムラインを使って p95 リクエストの遅延やタイムアウトをデバッグする方法については、ブログ記事 Datadog のプロファイリングタイムラインによる Go リクエストレイテンシーのデバッグを参照してください。
See prerequisites to learn how to enable this feature for Ruby.
Each lane represents a thread. Threads from a common pool are grouped together. You can expand the pool to view details for each thread.
Each lane represents a thread. Threads from a common pool are grouped together. You can expand the pool to view details for each thread.
上部のレーンは、余分なレイテンシーを追加する可能性のあるランタイムアクティビティを表しています。これらはリクエスト自体に関係ないこともあります。
Node.js でこの機能を有効にする方法については、前提条件を参照してください。
JavaScript のスレッドには 1 つのレーンがあります。
上のレーンはガベージコレクターのランタイムアクティビティで、リクエストに余分なレイテンシーを追加する可能性があります。
PHP でこの機能を有効にする方法については、前提条件を参照してください。
There is one lane for each PHP thread (in PHP NTS, this is only one lane). Fibers that run in this thread are represented in the same lane.
Lanes on the top are runtime activities that may add extra latency to your request, due to file compilation and garbage collection.
プロファイルをトレースから閲覧する
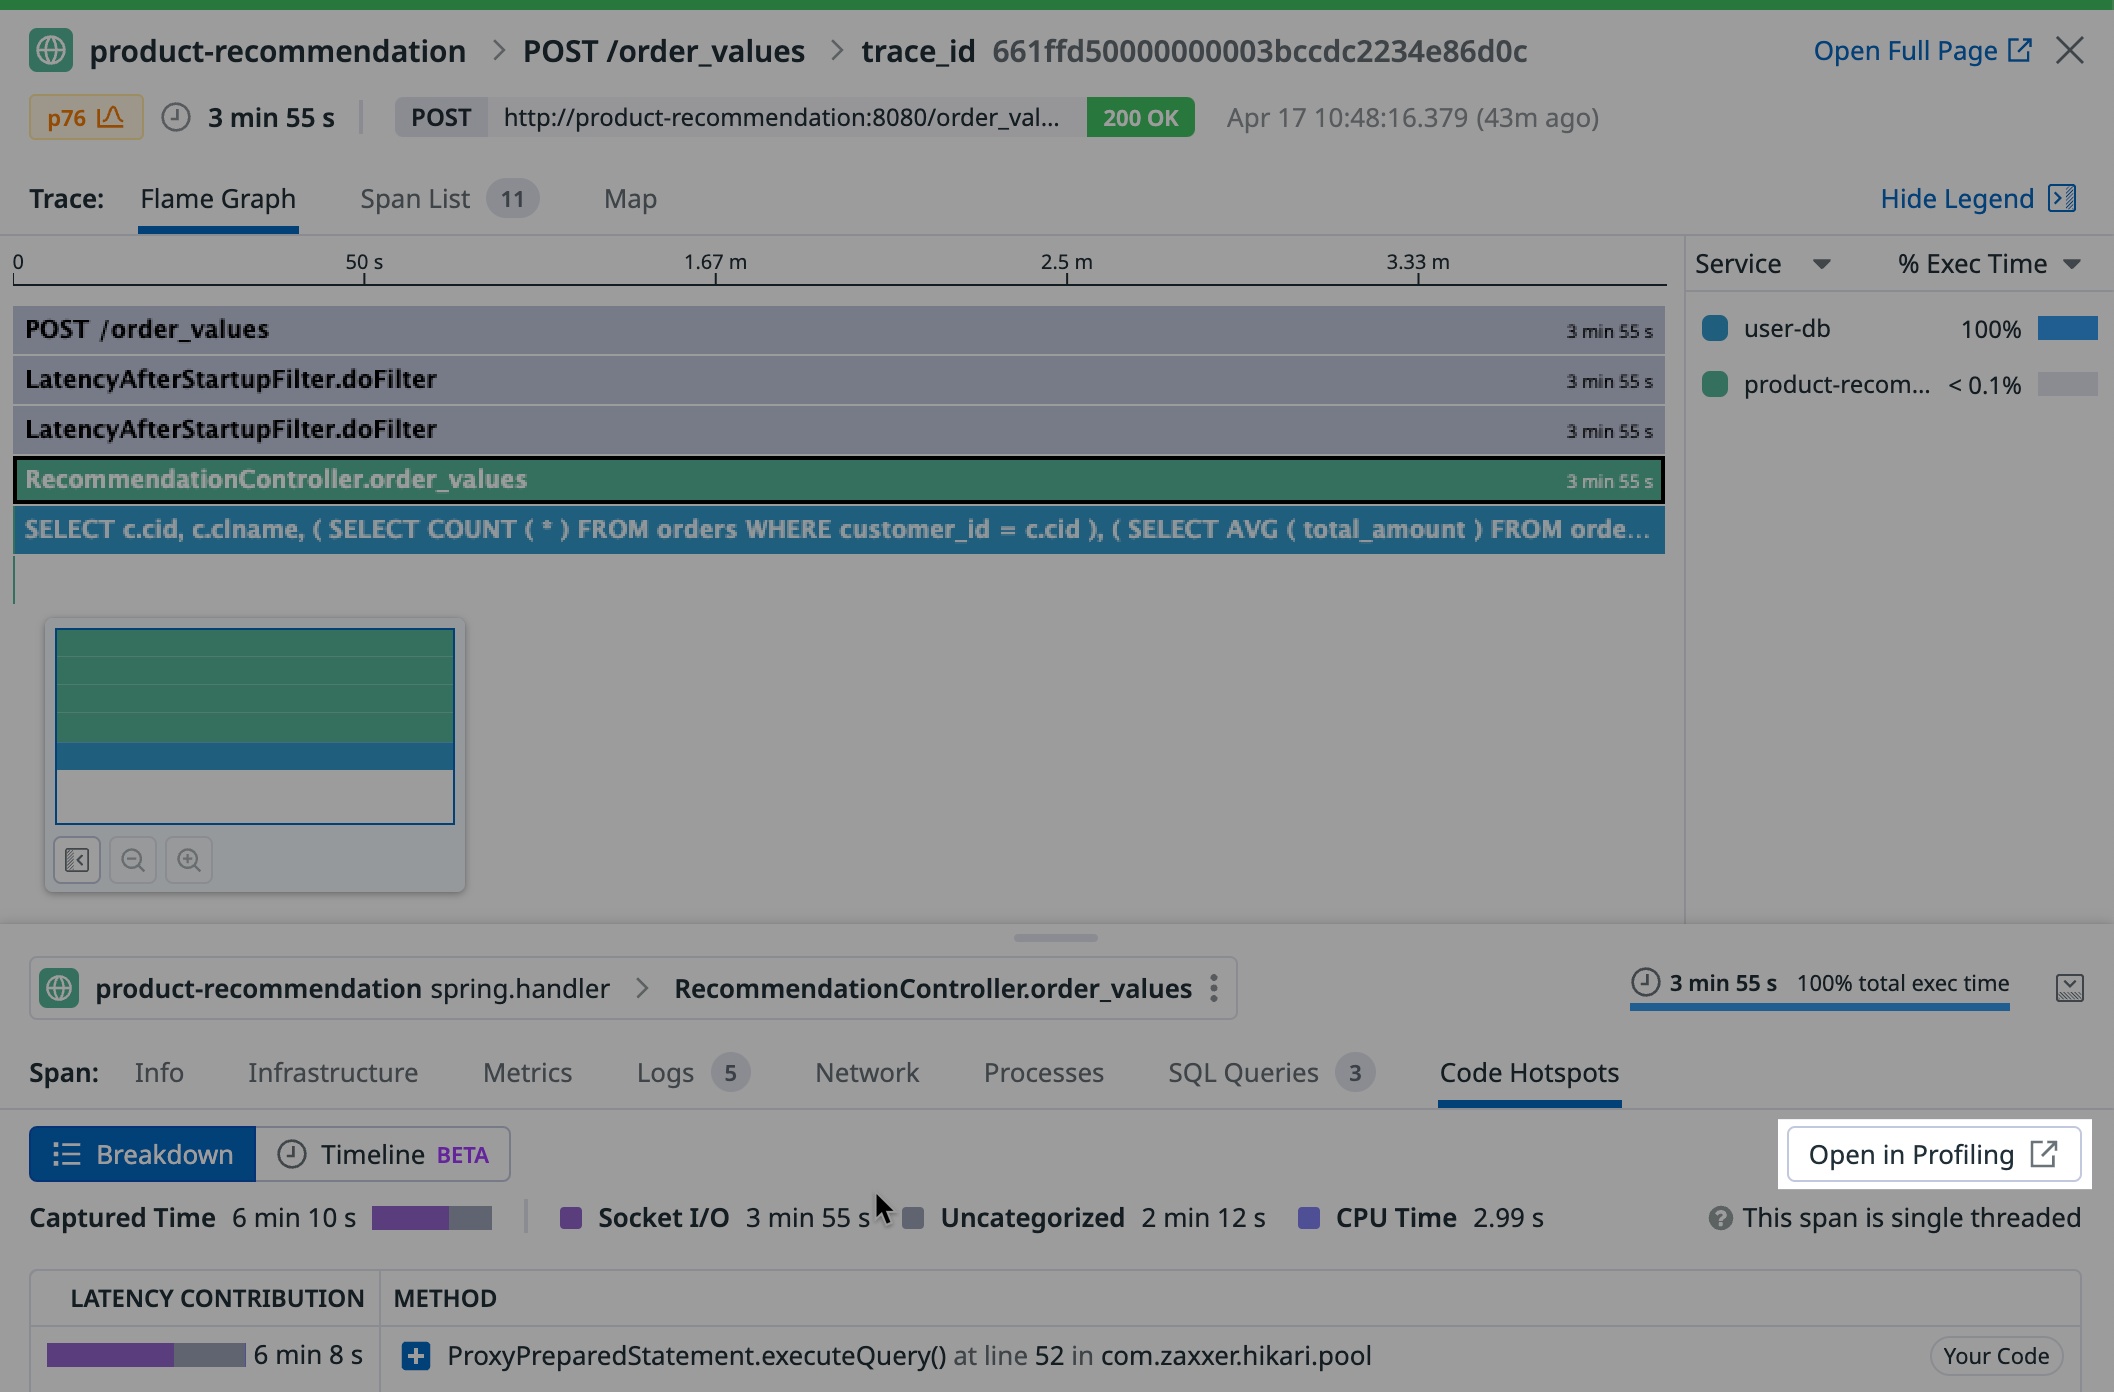
For each type from the breakdown, click Open in Profiling to see the same data opened up in a new page. From there, you can change the visualization to a flame graph. Click the Focus On selector to define the scope of the data:
- Span & Children は、選択したスパンと同じサービス内のすべての子孫スパンにプロファイリングデータをスコープします。
- Span only は、プロファイリングデータをあらかじめ選択されたスパンにのみスコープします。
- Span time period は、スパンがアクティブだった期間中のすべてのスレッドにプロファイリングデータをスコープします。
- Full profile は、データのスコープを以前に選択されたスパンを実行したサービスプロセス全体の 60 秒に設定します。
コードのパフォーマンスを API エンドポイントごとに分解する
前提条件
Endpoint profiling is enabled by default when you turn on profiling for your Java service.
Datadog プロファイラーの使用が必要です。JFR はサポートされていません。
Python サービスのプロファイリングを起動すると、エンドポイントプロファイリングがデフォルトで有効化されます。
Requires dd-trace-py version 0.54.0+.
Go サービスのプロファイリングを起動すると、エンドポイントプロファイリングがデフォルトで有効化されます。
dd-trace-go バージョン 1.37.0 以上が必要で、Go バージョン 1.18 以降で最適に動作します。
Ruby サービスのプロファイリングを起動すると、エンドポイントプロファイリングがデフォルトで有効化されます。
Requires dd-trace-rb version 0.54.0+.
Linux と macOS で Node.js サービスのプロファイリングを有効にすると、エンドポイントプロファイリングがデフォルトで有効になります。Windows ではこの機能は利用できません。
dd-trace-js のバージョン 5.0.0 以降、4.24.0 以降または 3.45.0 以降が必要です。
.NET サービスのプロファイリングを起動すると、エンドポイントプロファイリングがデフォルトで有効化されます。
Requires dd-trace-dotnet version 2.15.0+.
PHP サービスのプロファイリングを起動すると、エンドポイントプロファイリングがデフォルトで有効化されます。
Requires dd-trace-php version 0.79.0+.
エンドポイントプロファイリング
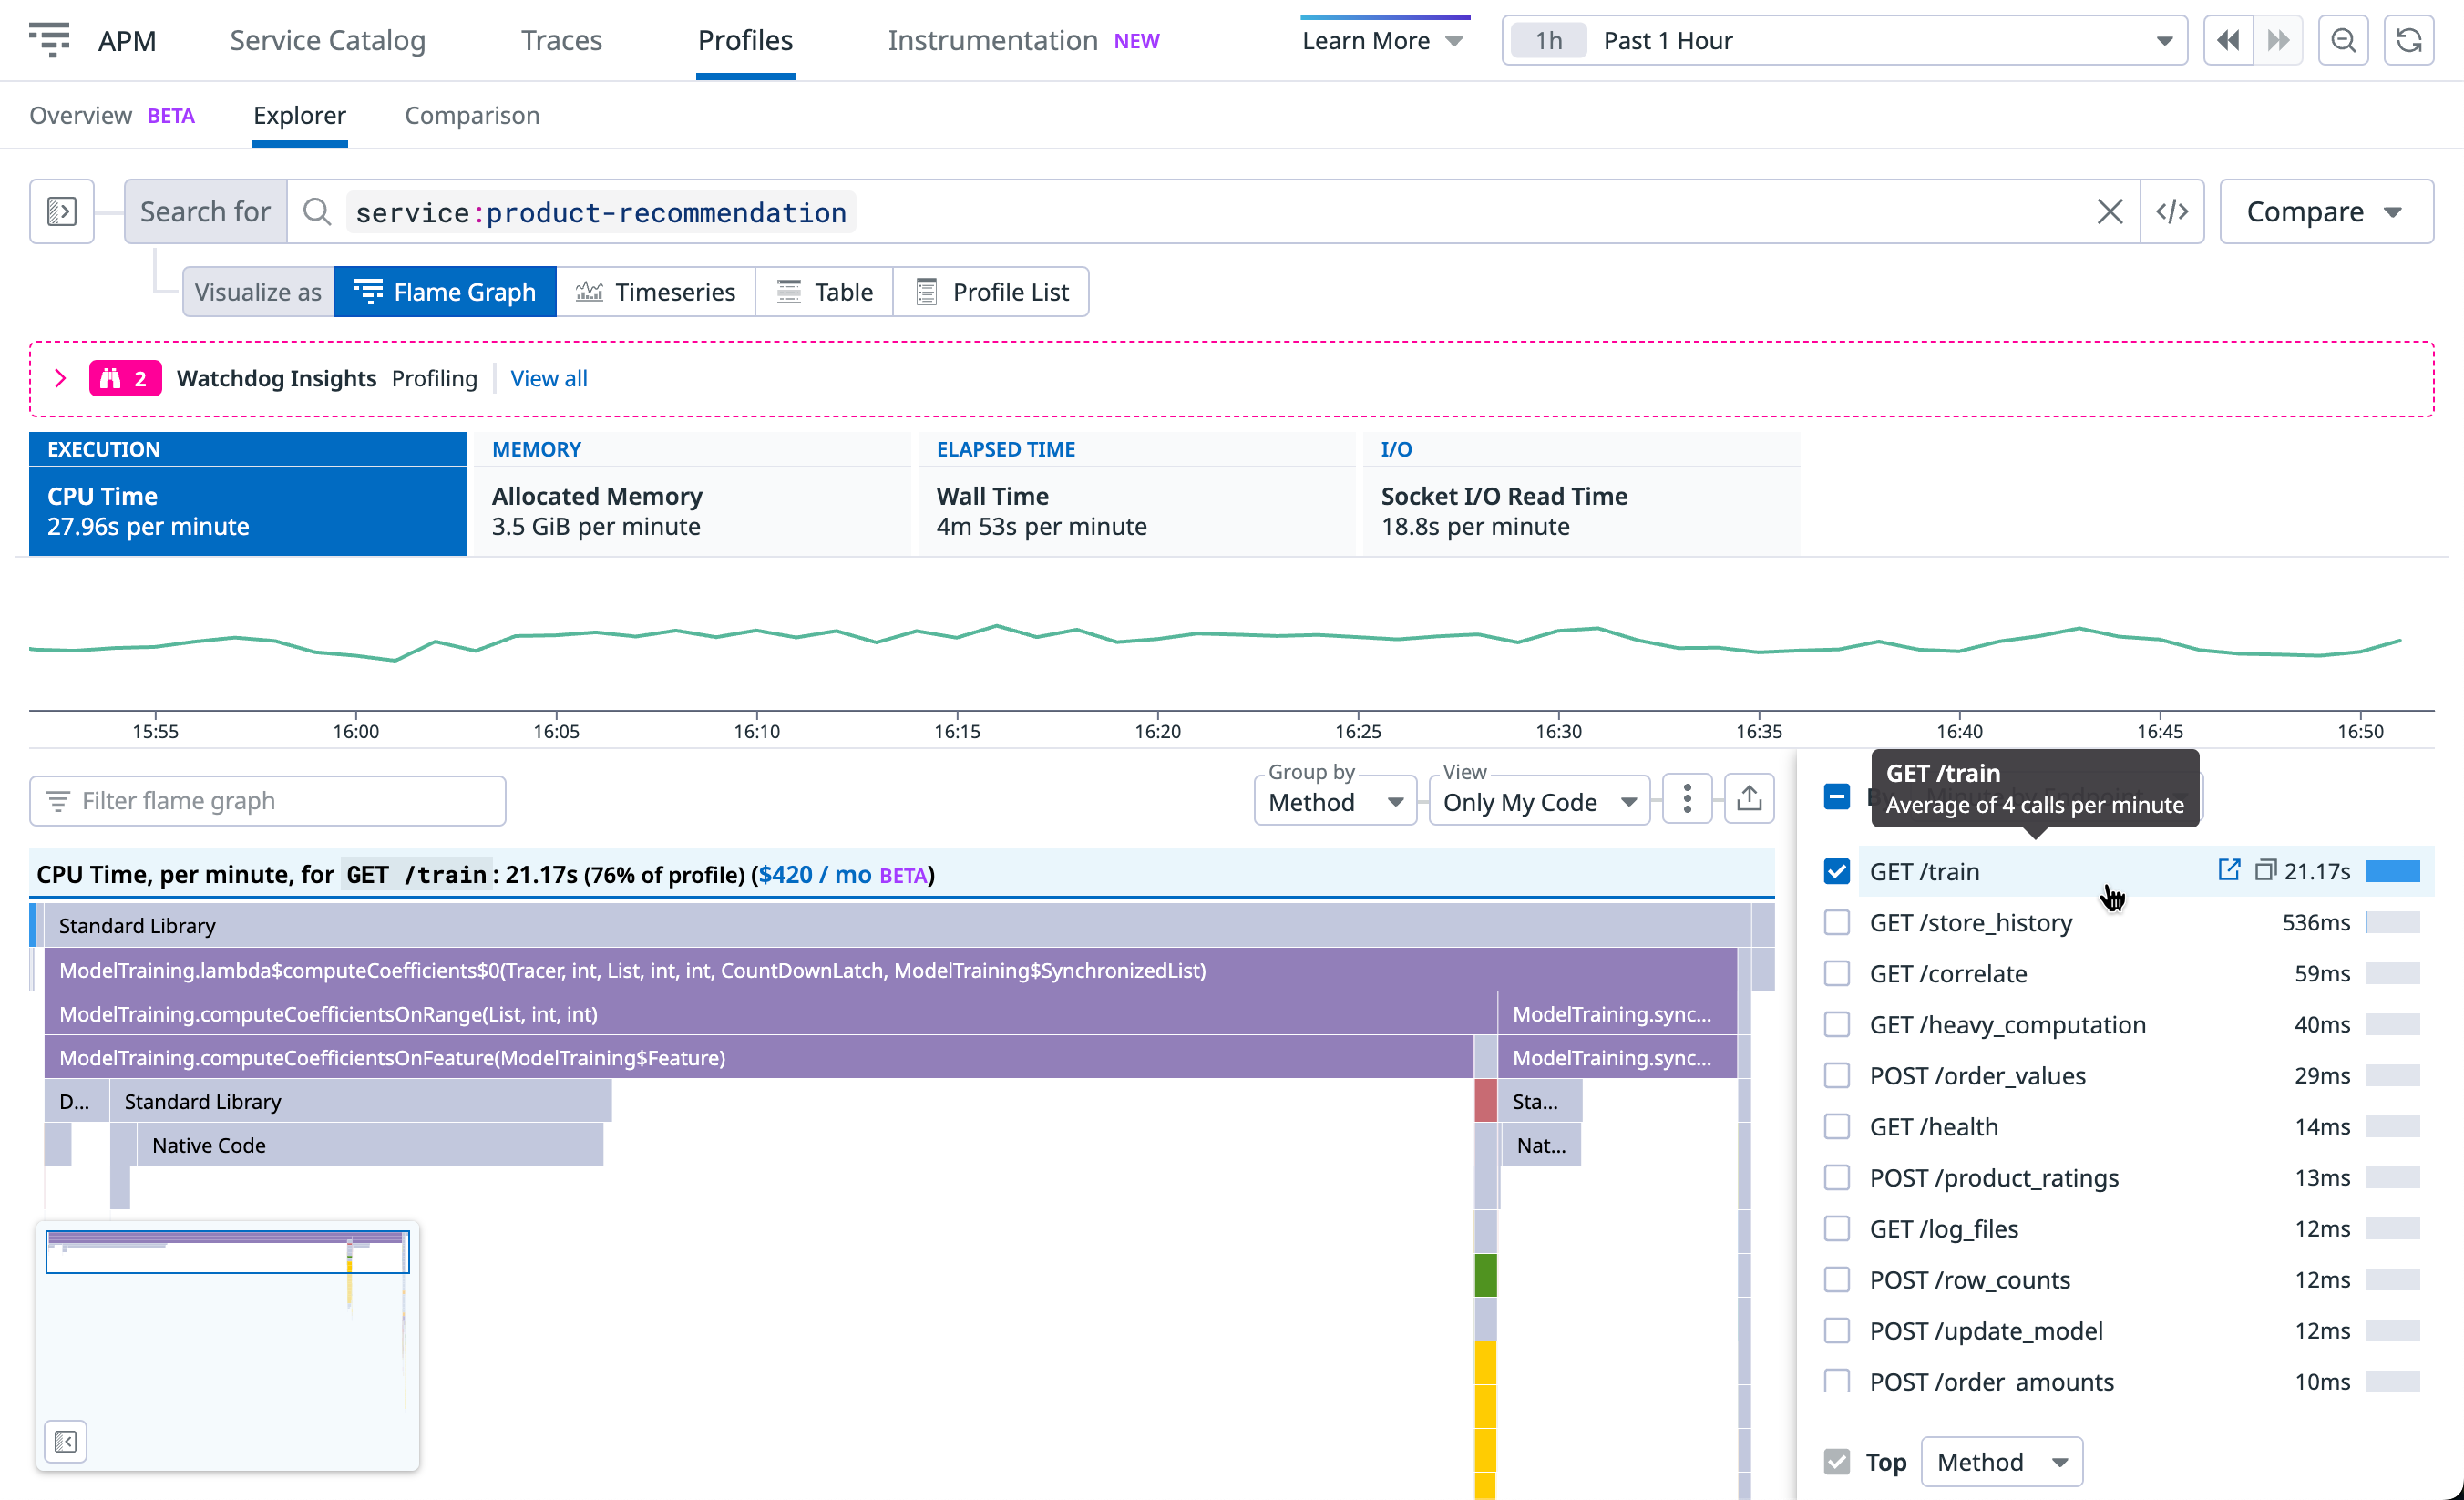
エンドポイントプロファイリングは、Web サービスの任意のエンドポイントでフレームグラフをスコープし、遅いエンドポイント、レイテンシーが多いエンドポイント、エンドユーザーエクスペリエンスが悪い原因となっているエンドポイントを見つけることができます。これらのエンドポイントは、デバッグが難しく、なぜ遅いのかを理解するのが困難な場合があります。遅い原因は、エンドポイントが多くの CPU サイクルを消費するなど、意図しない大量のリソースを消費している可能性があります。
エンドポイントプロファイリングを利用すると、以下のことが可能になります。
- エンドポイント全体のレスポンスタイムを遅くしているボトルネックとなるメソッドを特定する。
- CPU、メモリ、例外などの貴重なリソースを消費する上位のエンドポイントを切り分ける。これは、一般的にパフォーマンスを向上させるためにサービスを最適化しようとしている場合に特に役立ちます。
- サードパーティのコードやランタイムライブラリが、エンドポイントの速度低下やリソース消費の重さの原因になっているかどうかを把握する。
Surface code that impacted your production latency
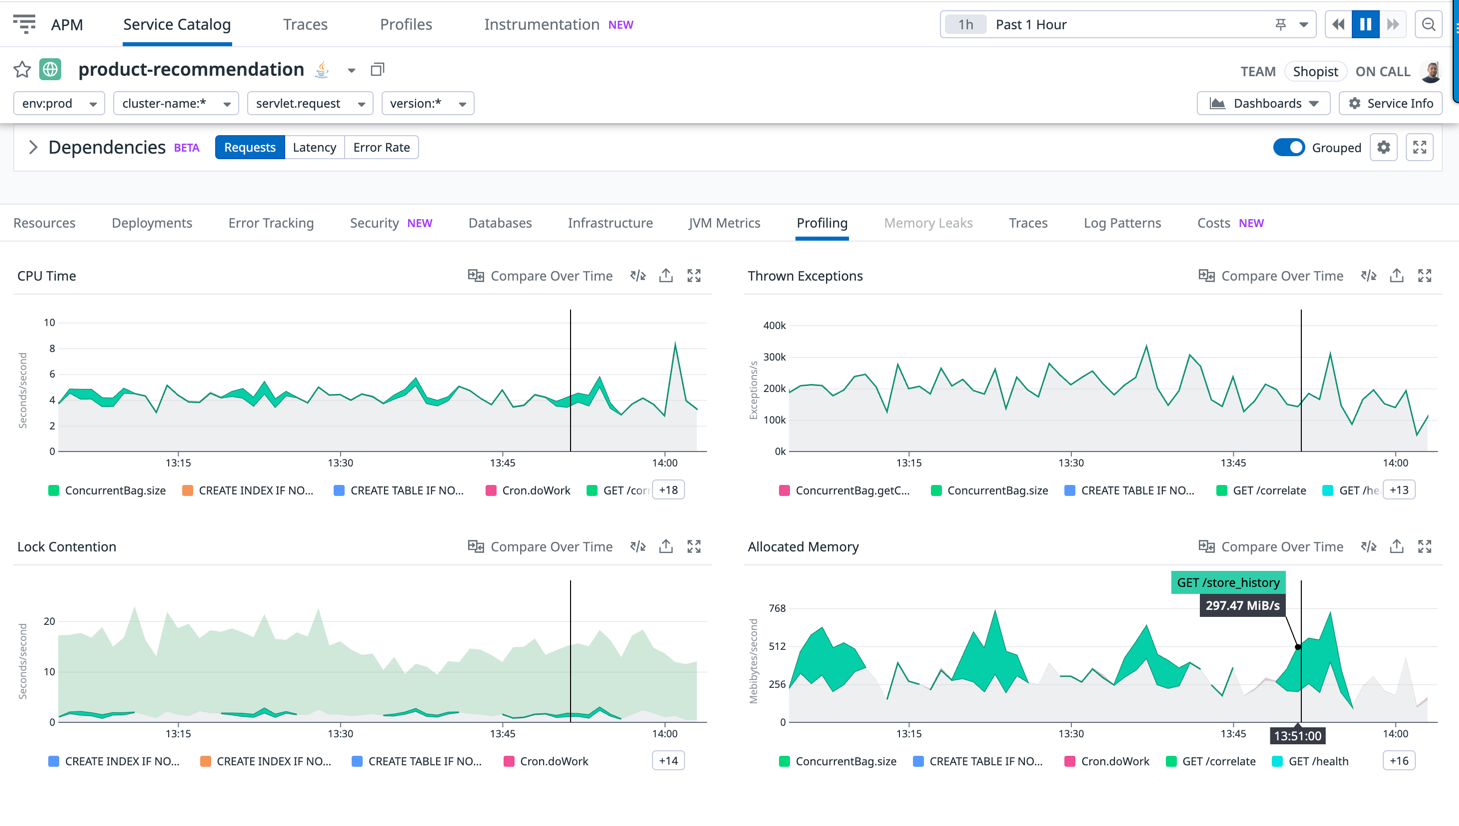
In the APM Service page, use the information in the Profiling tab to correlate a latency or throughput change to a code performance change.
この例では、レイテンシーが、以下のコードによって引き起こされる/GET train でのロック競合の増加とどのようにリンクしているかがわかります。
Thread.sleep(DELAY_BY.minus(elapsed).toMillis());
Track endpoints that consume the most resources
CPU やウォールタイムなどの貴重なリソースを消費している上位のエンドポイントを追跡することは価値があります。このリストは、エンドポイントが回帰していないか、あるいは新たに導入したエンドポイントが大幅にリソースを消費してサービス全体の速度を低下させていないかどうかを確認するのに役立ちます。
The following image shows that GET /store_history is periodically impacting this service by consuming 20% of its CPU and 50% of its allocated memory:
リクエストごとの平均リソース消費量の追跡
Per endpoint call を選択すると、トラフィックが時間の経過とともに変化しても、動作の変化を確認できます。これは、プログレッシブロールアウトのサニティチェックや日々のトラフィックパターンの分析に役立ちます。
The following example shows that CPU per request increased for /GET train:
参考資料
お役に立つドキュメント、リンクや記事:
